
Market Overview
| Study Period | 2021 - 2031 |
|---|---|
| Forecast Data Period | 2026 - 2031 |
| Base Year Market Size (2025) | 6 gigawatt |
| Market Volume (2026) | 6.63 gigawatt |
| Market Volume (2031) | 10.99 gigawatt |
| Growth Rate (2026 - 2031) | 10.56 % |
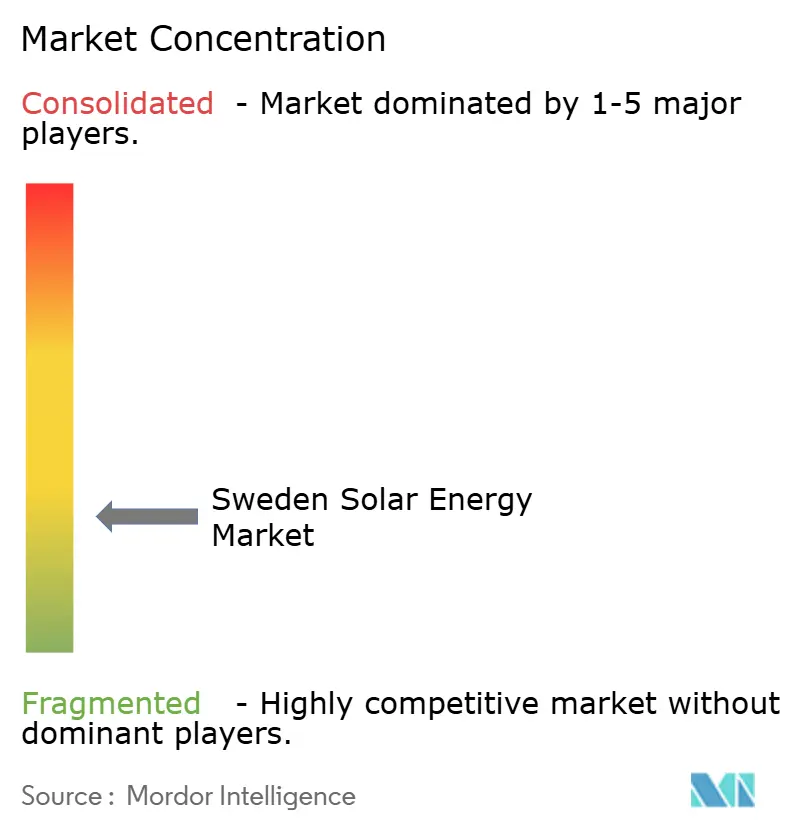
| Market Concentration | Low |
Major Players *Disclaimer: Major Players sorted in no particular order Image © Mordor Intelligence. Reuse requires attribution under CC BY 4.0. | |
Sweden Solar Energy Market Analysis by Mordor Intelligence
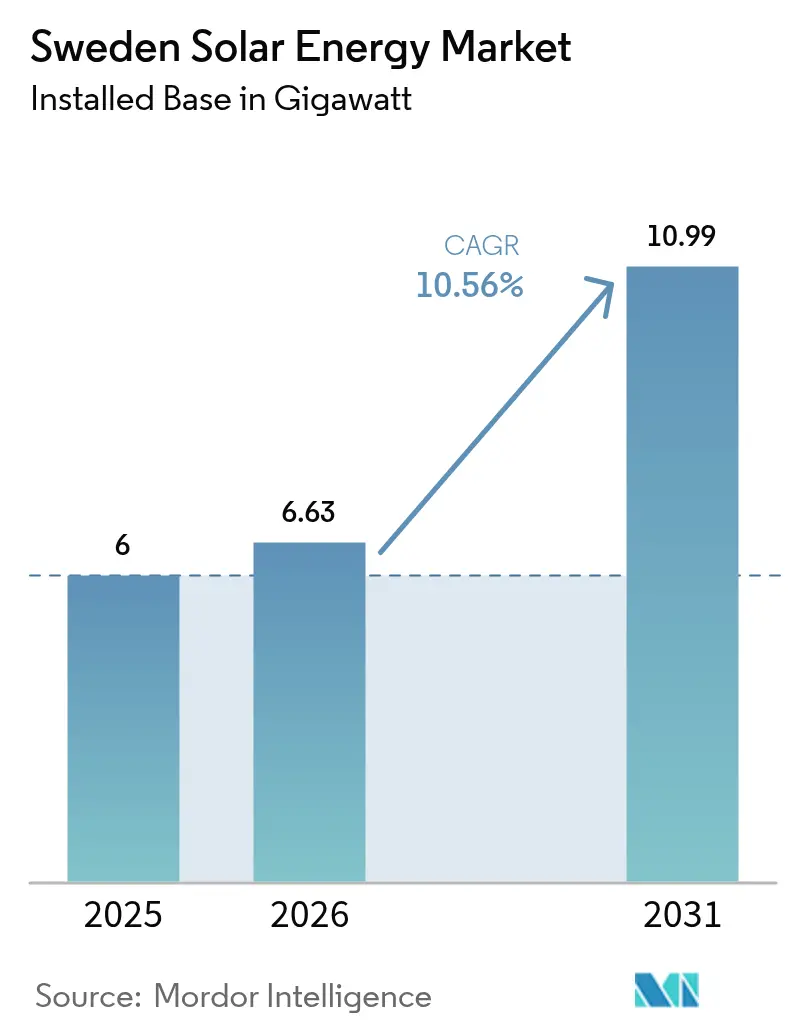
The Sweden Solar Energy Market size in terms of installed base is expected to grow from 6 gigawatt in 2025 to 6.63 gigawatt in 2026 and is forecast to reach 10.99 gigawatt by 2031 at 10.56% CAGR over 2026-2031.
Demand momentum is currently strongest in the residential segment because the 20% Grön Teknik tax deduction continues through June 2025, yet the looming cut to 15% and the abolition of the SEK 0.60 per kWh micro-production credit in early 2026 are reshaping project timing.[1]Swedish Tax Agency, “Grön Teknik Deduction,” skatteverket.se Corporate power-purchase agreements tied to data-center and battery manufacturing loads are accelerating utility-scale pipelines, while module prices that fell below EUR 0.10 per Wp in 2024 have compressed equipment costs and intensified installer competition.[2]Bloomberg, “European Solar Module Pricing Trends,” bloomberg.com Grid queues that average 501 days, a certified-installer shortfall, and Sweden’s low winter irradiation temper growth, but battery coupling, vertical bifacial agrivoltaics, and land-lease partnerships with state forestry firm Sveaskog are opening new niches.[3]Svenska Kraftnät, “Grid Connection Timelines,” svk.se Competitive strategies, therefore, hinge on securing grid capacity, bundling storage, and tailoring technology to Nordic light conditions rather than chasing headline wattage alone.
Key Report Takeaways
- By technology, photovoltaic systems held 100% of capacity in 2025, and crystalline silicon will continue to dominate while thin-film CIGS captures weight-restricted rooftops.
- By grid type, on-grid systems accounted for 87.20% of 2025 installations, yet off-grid systems are advancing at a 16.62% CAGR through 2031 as remote industries bypass connection delays.
- By end-user, residential rooftops led with 48.30% of the Sweden solar energy market share in 2025, whereas utility-scale plants are the fastest-growing segment at 27.36% CAGR to 2031.
- By geography, southern regions delivered roughly 59.30% of 2025 additions and are set to retain volume leadership, but central Sweden offers the highest pipeline growth, where land leases with Sveaskog de-risk permitting.
Note: Market size and forecast figures in this report are generated using Mordor Intelligence’s proprietary estimation framework, updated with the latest available data and insights as of 2026.
Sweden Solar Energy Market Trends and Insights
Drivers Impact Analysis*
| Driver | (~) % Impact on CAGR Forecast | Geographic Relevance | Impact Timeline |
|---|---|---|---|
| Grön Teknik rebate remains until mid-2025 | +1.8% | Nationwide, strongest in southern Sweden | Short term (≤ 2 years) |
| EU Fit-for-55 and RED-III acceleration areas | +2.3% | Nationwide under EU mandates | Medium term (2–4 years) |
| Module prices below EUR 0.10 per Wp | +2.1% | Nationwide with Nordic spillover | Short term (≤ 2 years) |
| Corporate PPAs from data-center and battery plants | +2.5% | Southern and central industrial hubs | Medium term (2–4 years) |
| Grid-flexible rooftop-battery subsidy (proposed) | +1.4% | Stockholm, Gothenburg, Malmö | Medium term (2–4 years) |
| Agrivoltaic vertical bifacial adoption | +0.7% | Rural south and central | Long term (≥ 4 years) |
| Source: Mordor Intelligence | |||
Sweden’s Grön Teknik Rebate Until Mid-2025
The Grön Teknik deduction sustains a 20% tax credit through June 2025, encouraging residential owners to advance purchase decisions before the rate falls to 15%. The looming change elongates payback periods from 8–10 years to 10–12 years for a typical 6 kW system, even after factoring module prices near EUR 0.09 per Wp.[4]Swedish Tax Agency, “Grön Teknik Deduction,” skatteverket.se Installers, therefore, report a surge in first-half 2025 bookings that risks a post-July demand cliff. Larger rooftops above 25 kW remain excluded from the deduction cap, which channels more growth toward smaller homes. As a result, residential contractors are accelerating hiring and inventory purchases to capture the transient peak.
EU Fit-for-55 and RED-III Acceleration Areas
Sweden’s revised National Energy and Climate Plan doubles its 2030 solar target in line with RED-III and requires renewable acceleration zones by May 2025.[5]European Commission, “RED-III Guidelines,” ec.europa.eu Designating brownfield sites and industrial roofs could trim permitting from 501 days to under 180 days, but municipal veto powers persist. Divergent local policies already led Skåne to reject a 50 MW park despite grid approval, confirming that southern pro-renewable councils will attract most near-term capital. Developers, therefore, map municipality attitudes as carefully as irradiation maps when screening sites.
Module Prices Below EUR 0.10 per Wp
Chinese oversupply drove European spot prices down 40% in 2024 to EUR 0.08–0.10 per Wp. The collapse squeezed residential installer margins to 8–12% and triggered a wave of consolidation, including three regional acquisitions by Svea Solar. Utility-scale developers responded by locking in multiyear supply contracts at fixed EUR 0.09 per Wp ahead of possible trade tariffs in 2026. With polysilicon producers operating near cash-cost at EUR 0.08 per Wp, further declines look limited, shifting buyer focus from price to warranty terms and logistics certainty.
Corporate PPAs From Data-Center and Battery Plants
Data-center demand is forecast to reach up to 5 TWh by 2030, and Microsoft extended its 24/7 carbon-free pledge to its Swedish campuses in 2024. Vattenfall therefore signed a 10-year 150 GWh PPA that bundles 50 MW of solar with 20 MWh of batteries, creating the first hourly matched solar contract in Sweden. Battery maker Northvolt, consuming 1.5 TWh annually, has signaled interest in similar structures. These contracts underpin revenue certainty for new utility-scale arrays, accelerating ground-mount finance decisions.
Restraints Impact Analysis*
| Restraint | (~) % Impact on CAGR Forecast | Geographic Relevance | Impact Timeline |
|---|---|---|---|
| Low winter irradiation and seasonal mismatch | −1.5% | National, strongest in the north | Long term (≥ 4 years) |
| Distribution-grid congestion and lengthy permits | −2.2% | Nationwide, acute in the south | Medium term (2–4 years) |
| Certified installer shortage | −1.1% | Urban labor markets | Short term (≤ 2 years) |
| Rooftop competition from green roofs and EV chargers | −0.6% | Stockholm, Malmö, Gothenburg | Medium term (2–4 years) |
| Source: Mordor Intelligence | |||
Low Winter Irradiation and Seasonal Mismatch
Solar capacity factors range from 10% in Norrbotten to 12% in Skåne, with December and January delivering less than 2% of annual output. Swedish demand peaks during winter heating, forcing rooftop owners to export summer surplus at negative prices while buying expensive winter power. Hydro reservoirs currently absorb 10–15 TWh of balancing duties, but that flexibility caps Sweden’s export revenues under Nord Pool. Utility developers respond by co-locating batteries sized for four to six hours of discharge, yet storage adds SEK 2–3 per watt to capital costs, slowing adoption outside corporate PPA structures.
Distribution-Grid Congestion and Lengthy Permits
Connection approval still takes a median of 501 days, and southern zones can exceed 600 days. The legacy 10 kV network was designed for central hydro rather than two-way rooftop flows. Upgrading a single substation costs SEK 5–10 million, and distribution operators are hesitant to socialize that expense. Svenska Kraftnät’s maturity-based queue favors projects with financing and land permits, disadvantaging small developers. The result is a secondary market in grid-ready projects that inflates development premiums and concentrates ownership among capital-rich entities.
*Our forecasts treat driver/restraint impacts as directional, not additive. The impact forecasts reflect baseline growth, mix effects, and variable interactions.
Segment Analysis
By Technology: Photovoltaic Dominance Under Nordic Light Conditions
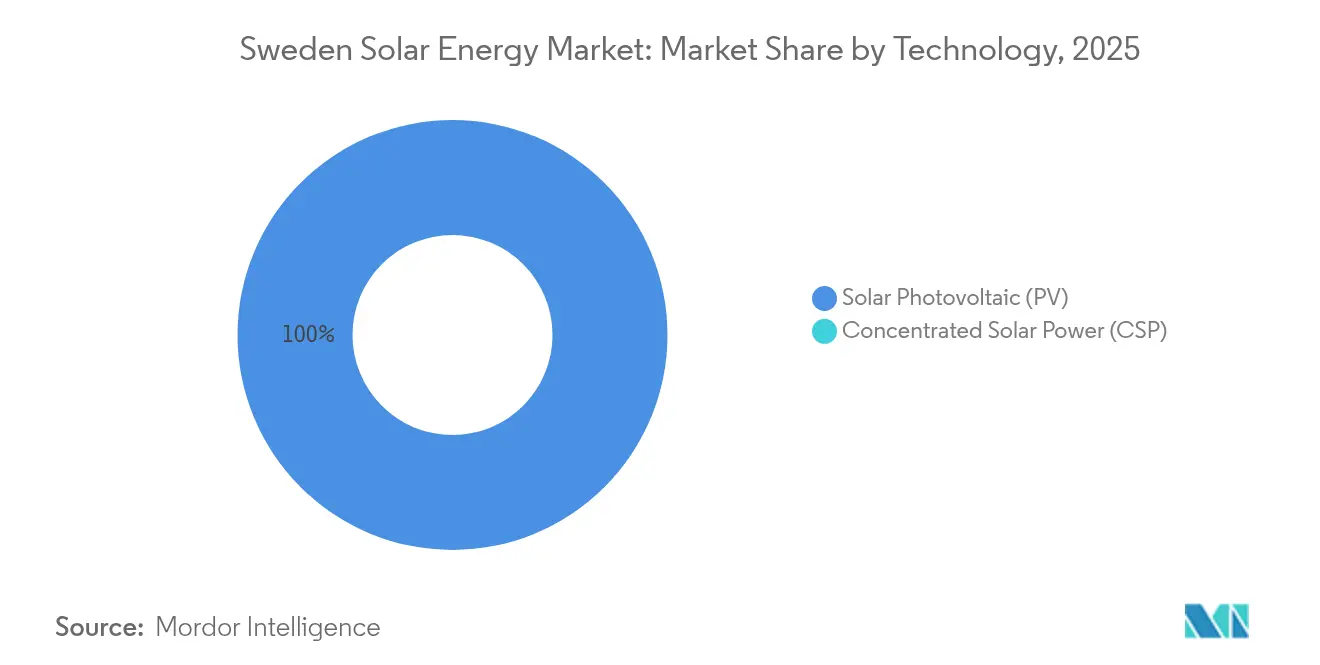
Solar PV held 100% of the Sweden solar energy market in 2025 because low direct normal irradiance renders CSP unviable. Crystalline silicon commands the bulk of installations at 20–22% module efficiency. The Sweden solar energy market size for PV technology is projected to grow from 6 GW in 2025 to about 10.99 GW by 2031 at a 10.56% CAGR. Thin-film CIGS panels address rooftops that cannot tolerate the 15–25 kg per m² weight of crystalline modules, and Midsummer’s 200 MW factory in Flen will supply that niche with deliveries from 2026.
Bifacial modules are advancing in utility arrays because vertical east-west layouts raise yield by 10–15% through diffuse and snow-albedo gains. R&D also centers on perovskite-silicon tandem cells, with a EUR 2.8 million EU grant issued in April 2025 to push efficiencies past 30%. Although pilot production is unlikely before 2027, sustained funding suggests technology competition will emphasize application specificity over headline watt cost.



By Grid Type: Off-Grid Uptick as Developers Evade Queues
On-grid arrays represented 87.20% of 2025 capacity, yet off-grid systems are expanding at 16.62% CAGR because remote mines, telecom towers, and farms are unwilling to wait 501 days for interconnection. The Sweden solar energy market size for off-grid installations stood near 0.77 GW in 2025 and could exceed 1.93 GW by 2031. Cabin owners typically deploy 3–5 kW solar with 10–15 kWh of lithium-ion storage, whereas industrial microgrids combine 100 kW solar with 250–300 kWh batteries to replace diesel. Regulatory proposals to compensate residential batteries for frequency reserve could blur the on-grid and off-grid boundary, since homeowners would stay connected for ancillary revenue yet avoid summer exports.
Larger grid-tied farms face curtailed returns once the micro-production credit ends in 2026, steering developers toward “zero-export” inverter settings and on-site storage. The resulting self-consumption model raises internal rates of return if discharged during evening peaks when spot prices average SEK 1.20 per kWh, far higher than midday lows.
By End-User: Utility-Scale Surge Rebalances the Mix
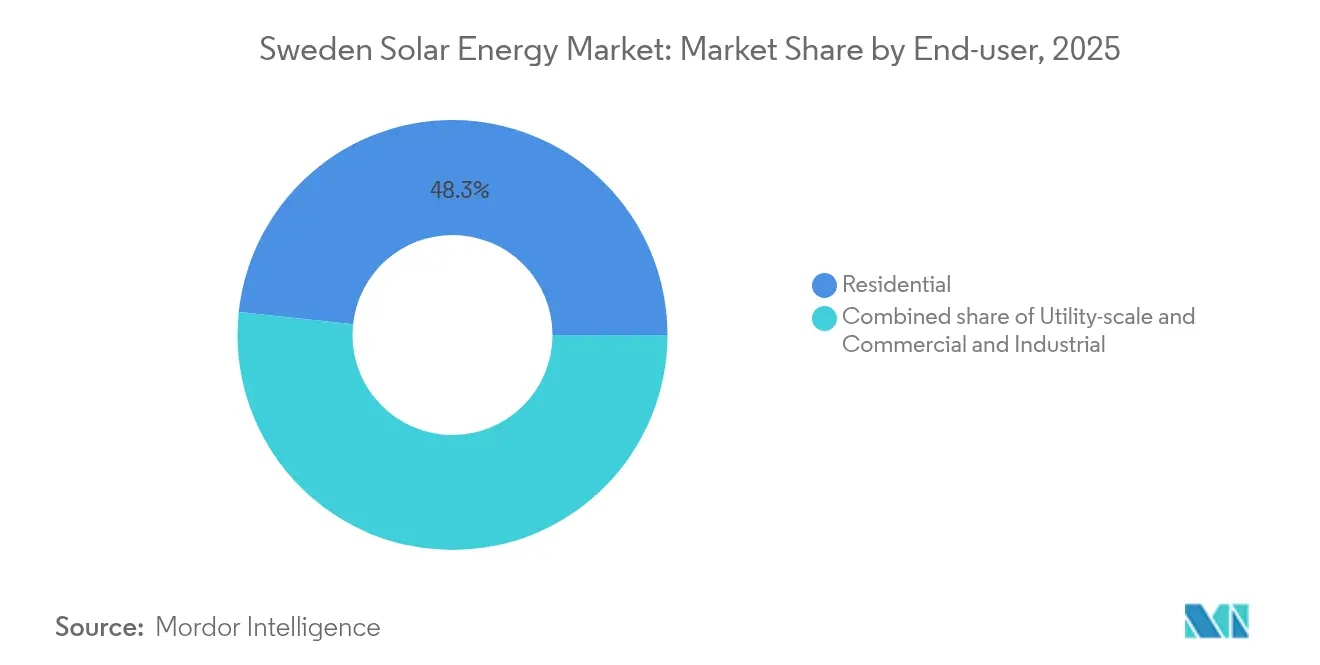
Residential rooftops delivered 48.30% of 2025 additions because high electricity prices and the 20% deduction favored homeowners. Utility-scale projects, however, will grow fastest at 27.36% CAGR, lifting their share from 31.20% in 2025 to more than 46.30% by 2031. The Sweden solar energy market share for utility-scale plants is therefore on track to overtake the residential segment soon after the subsidy cut. Ground-mount economics benefit from capital costs of SEK 6–7 per watt and 10–15 year PPAs with creditworthy buyers such as Microsoft.
C&I rooftops bridge the two extremes. Average systems of 50–150 kW shave demand charges and qualify for emerging grid-flexible battery incentives. Yet green-roof mandates and competing EV charger conduits constrain usable roof area in Stockholm and Malmö. The trajectory of this middle segment hinges on whether a proposed 30% battery-cost subsidy survives parliamentary review in 2025.
Geography Analysis
Southern counties (Skåne, Västra Götaland, Stockholm) delivered roughly 59.30% of Sweden’s 2025 solar additions because irradiation reaches 1,100 kWh per m², about 20% higher than northern averages. They also host the densest transformer capacity, reducing grid reinforcement charges. Competition for agricultural land remains intense, so developers increasingly lease parcels from institutional owners such as Sveaskog, which offered 70 hectares in Skåne at SEK 8,000–12,000 per hectare annually.
Central Sweden (Östergötland, Södermanland) is emerging as an agrivoltaics testbed. A 1 MW vertical bifacial pilot in Östergötland generated 1.2 GWh per year while cutting wheat yield by only 3–5%. However, grid connection lines can cost SEK 1.5–2.0 million per km, so most pilots remain below 5 MW. Expected acceleration-area zoning under RED-III could compress permitting to 180 days in pro-renewable municipalities, yet local veto power still introduces asymmetry, making site scouting a municipality-by-municipality exercise.
Northern regions (Norrbotten, Västerbotten) attract projects that serve industrial loads such as Northvolt’s 1.5 TWh gigafactory. Land leases cost less than SEK 5,000 per hectare annually, but low irradiation holds capacity factors near 10%. Battery co-location, therefore, becomes essential to arbitrage intraday price spreads that widen when hydro dams throttle exports. Svea Solar’s 12 MW battery park for Luleå Energi illustrates this logic, capturing SEK 1.5–2.0 million per year in price differences between midday lows and evening peaks.
Regulatory Landscape
Sweden’s solar market operates under a tax-and-permitting framework that is shifting from subsidy-led residential growth toward clearer grid-connection and authorization rules. The Gron Teknik tax deduction remained a key demand lever through June 2025 at 20%, and the deduction reduced to 15% from July 1, 2025. In parallel, the tax reduction for micro-production of renewable electricity was abolished from January 1, 2026, changing the economics for small on-grid exporters.
On permitting and grid access, authorities have emphasized standardization and lead-time reduction. Energimarknadsinspektionen (Ei) increased scrutiny of grid companies’ routines for connecting solar and wind parks, including information requests and supervision actions initiated in 2025. In February 2026, Ei circulated proposed updated regulations on requirements for grid connection of generators for consultation, aligned with EU Requirements for Generators, Commission Regulation (EU) 2016/631. A step-change arrived with Lag (2026:399) om verksamheter och atgarder for fornybar energi, passed in April 2026 and effective July 1, 2026, implementing EU renewable-energy permitting provisions and introducing more time-bounded processes, including additional simplification for smaller solar installations (with specified exemptions from building-permit requirements up to a defined power threshold).
Competitive Landscape
The top five players, Vattenfall, Svea Solar, Soltech Energy, E.ON, and Fortum, controlled roughly 40–45% of installed capacity in 2024, indicating moderate concentration. Utilities regard solar as a diversification hedge: Vattenfall allocated SEK 19 billion of its SEK 170 billion 2025–2029 plan to “other renewables,” compared with SEK 77 billion for wind. Pure-play operators fill the gap. Svea Solar is vertically integrating by locking in 2 GW of land through Sveaskog, while also adding storage EPC capacity to bid on utility PV plus battery packages.
On the manufacturing side, Midsummer is scaling domestic thin-film output, reducing exposure to Chinese module tariffs. Exeger pursues consumer electronics with dye-sensitized cells, yet its SEK 13.3 million revenue in 2023 underscores the pre-commercial status of that segment. ABB holds about 25–30% of the Swedish inverter supply, giving it pricing power but leaving project-development margins untouched. Installer consolidation is ongoing: three acquisitions by Svea Solar in 2024 and Soltech Energy’s sale of its Ramsjöholm solar park to fund battery assets reveal a shift toward storage and service bundling as pure EPC returns tighten.
Sweden Solar Energy Industry Leaders
Exeger Sweden AB
Vattenfall AB
Svea Solar AB
Eneo Solutions AB
Soltech Energy Sweden AB
- *Disclaimer: Major Players sorted in no particular order

Market Opportunities and Future Outlook
With policy support recalibrated (Gron Teknik reduced to 15% from July 2025 and the micro-production tax reduction removed from January 2026), there is room for business models that depend less on surplus export compensation and more on controllable value streams. Battery-coupled PV and hybrid configurations align with Sweden’s intraday price volatility and grid constraints, and the evidence is visible in the 2026 discourse from industry bodies, which points to a storage-first investment pattern where batteries are installed ahead of, or together with, PV to access frequency regulation and arbitrage. Utility-scale activity is also continuing under market-based contracting.
The permitting and grid-connection reform agenda is another opportunity vector because it targets a binding constraint in Sweden: long connection timelines. Lag (2026:399), effective July 1, 2026, codifies streamlined authorization pathways under EU renewable permitting provisions, and Ei’s 2026 work on updated grid-connection requirements for generators signals tighter and clearer technical compliance expectations for new PV and PV-plus-storage plants. Separate deployment metrics also indicate a large and still-growing installed base that supports aftermarket and repowering opportunities, with official statistics and market reporting pointing to more than 314,600 grid-connected installations and around 5.5 GW cumulative capacity by end-2025, and annual additions around 848 MW in 2024 and about 652 MW in 2025. This base supports opportunities in O&M, inverter and mounting retrofits, battery add-ons to reduce export exposure, and developer strategies that bundle land access and grid readiness, including Sveaskog-linked land pipelines in central and southern Sweden, to reduce permitting and interconnection risk.
Recent Industry Developments
- July 2026: Sweden brought Lag (2026:399) om verksamheter och atgarder for fornybar energi into force on July 1, 2026, implementing EU renewable-energy permitting provisions aimed at faster, more standardized authorization. The framework introduces clearer time-bound processes and simplifications that reduce administrative friction for developers and EPCs across utility-scale and distributed PV.
- April 2026: The Swedish Riksdag passed Lag (2026:399) to simplify and shorten permitting for renewable energy projects. By tightening process structure and creating a more uniform pathway for approvals, the law supports pipeline conversion for ground-mount PV and PV-plus-storage projects that have been constrained by lengthy authorization and grid-queue timelines.
- April 2025: Midsummer secured a EUR 2.8 million EU Innovation Fund grant to develop perovskite-silicon tandem cells targeting above 30% efficiency, with pilot output slated for 2027. The award strengthens a domestic technology and manufacturing narrative alongside Sweden-focused PV deployment, especially for application-specific module formats where weight and Nordic light conditions matter.


Research Methodology Framework and Report Scope
Market Definition and Coverage
This market is defined as the solar power generation capacity installed in Sweden, counted in gigawatts, covering systems that generate electricity from solar resources across connected and stand-alone setups.
Scope exclusions: We exclude project development and financing fees, carbon credits, and non-solar renewables unless they are directly tied to solar generation assets.
Segmentation Overview
- By Technology
- Solar Photovoltaic (PV)
- Concentrated Solar Power (CSP)
- By Grid Type
- On-Grid
- Off-Grid
- By End-User
- Utility-Scale
- Commercial and Industrial (C&I)
- Residential
- By Component (Qualitative Analysis)
- Solar Modules/Panels
- Inverters (String, Central, Micro)
- Mounting and Tracking Systems
- Balance-of-System and Electricals
- Energy Storage and Hybrid Integration
Data Sources, Market Sizing, and Validation
Desk Research
Desk research was used to set the fact base around Sweden power demand, grid conditions, and solar buildout signals, then to cross-check what we heard in interviews. We relied on public energy statistics and policy trackers (national energy agencies, Eurostat, and IEA country data), plus transmission system operator publications that describe grid connections and constraints.
To avoid building a model on one data series, we also scanned sources such as IRENA renewable capacity updates, peer-reviewed articles on Nordic solar performance and yield, and customs or trade statistics for solar components where they help explain near-term activity. Company annual reports and investor presentations were used to validate project pipelines, commissioning timelines, and typical system mix. For a few companies, paid subscriptions for company financials, patent records, and shipment-level trade intelligence were used selectively to fill gaps. These are illustrative examples only, and many other sources were also reviewed for data collection, validation, and research clarification.
Primary Interviews and Surveys
Primary work focused on confirming how capacity gets added in Sweden across rooftop and ground-mounted projects, and which factors are actually slowing or accelerating new connections. We spoke with developers, EPCs, component distributors, utilities, and large commercial buyers, then used follow-up questions to pin down typical project size, timing from order to commissioning, and practical price movements seen in recent bids. To keep inputs realistic, views were balanced across Sweden-relevant supply chain roles and across the broader Nordic and European context that influences equipment availability and policy expectations.
Distribution of primary research fieldwork respondents
| Company type | Respondent position |
|---|---|
| Top tier: 30% | CXOs: 15% |
| Mid tier: 54% | Functional/Unit leaders: 42% |
| Smaller Players: 16% | Managers: 43% |
Market-Sizing & Forecasting
Sizing was built using a top-down capacity reconstruction, where Sweden renewable additions and grid-connection signals are translated into solar installed base by year, and then checked against how the end-user mix is shifting. Once the annual installed base path was formed, we used selective bottom-up approximations to confirm the totals made sense, using sampled project counts, typical system sizes by end user, and channel checks on module and inverter movement.
Inputs treated as key drivers (illustrative, not exhaustive) included annual new solar capacity additions, average system size trends across residential and commercial rooftops, utility-scale commissioning patterns, permitting and connection lead times, and typical capacity factors that affect how much value is attributed to additions in a given year. Assumptions were adjusted when interview feedback pointed to clear changes, such as backlog clearing, grid queue delays, or abrupt shifts in subsidy mechanics.
For forecasting, we used scenario analysis so different outlooks for policy support, grid connection speed, and equipment pricing could be expressed transparently. A central case was kept tied to the most consistent primary inputs, then stress-tested with faster and slower build rates so the CAGR is not driven by one aggressive ramp. When bottom-up checks had missing company coverage, we filled gaps using scaling factors based on known market shares and observed project-size distributions, and then revalidated the implied totals with independent capacity and connection signals.
Data Validation & Update Cycle
Validation was done in several passes, starting with simple consistency checks across units, growth rates, and implied commissioning volumes. Outputs were then compared against independent indicators like reported capacity additions, connection backlog narratives, and the split between rooftop and ground-mounted activity to check whether any portion of the curve looked mechanically inflated.
When a variance was spotted, we reviewed the underlying assumption and sought clarification again from relevant interviewees if the gap was material. Before sign-off, the model and write-up were reviewed by another analyst to confirm the logic is repeatable and that key inputs have a clear source trail. The report is refreshed annually, and interim updates are made when major policy changes, large project announcements, or sharp equipment price movements materially shift the outlook, followed by a final pre-delivery check to keep the view current.
Mordor Intelligence's Sweden Solar Energy Market Estimate Compared With Other Published Estimates
Published estimates for Sweden solar often diverge because some sources size the market as a value of yearly installations, while others size it as installed base capacity, and the two do not move in lockstep. Differences also come from how each publisher treats off-grid systems, whether storage is folded into solar, and which year the currency conversion and pricing assumptions are anchored to.
Some figures lean broader by mixing solar hardware revenue, installation services, and, in some cases, adjacent energy equipment into one value number, which can lift the reported total even when capacity additions slow. For this study, Mordor Intelligence reports the market size as installed solar capacity in Sweden and keeps it limited to generation assets so price swings and one-time service revenues do not distort the trend line.
Benchmark comparison
| Source | Market Size | Gaps in Research Methodology |
|---|---|---|
| Mordor Intelligence | USD 6.00 B (2025) | |
| Regional Consultancy A | USD 2.10 B (2024) | Reported as market value for solar energy activity in 2024, which can include system sales and installation spending, and it is sensitive to short-term pricing and the assumed services scope. |
| Trade Journal B | USD 0.97 B (2024) | Starts from PV installation value in local currency for 2024 and then converts to USD, which can understate or overstate totals depending on FX timing and whether VAT and off-grid items are handled consistently. |
The spread in the table mostly comes from mixing value-based spending measures with capacity-based installed base measures, plus differences in currency timing and what is counted around the core asset. By keeping the model tied to capacity additions, commissioning cadence, and realistic connection timelines, the estimate stays traceable to clear variables that can be checked and updated each year.


Key Questions Answered in the Report
How large is the Sweden solar energy market in 2026?
Installed capacity stands at about 6.63 GW in 2026, on track toward 10.99 GW by 2031.
What is driving new utility-scale solar in Sweden?
Corporate PPAs from data-center and battery factories, plus land-lease deals with Sveaskog, are underpinning most large projects.
How will the Grön Teknik change affect residential solar?
Cutting the deduction from 20% to 15% in July 2025 and ending the micro-production credit in 2026 will lengthen rooftop payback periods by roughly two years.
Why are off-grid systems growing quickly?
Remote industrial sites prefer to avoid 501-day grid queues and use solar plus battery microgrids for energy autonomy.
Which technology is gaining momentum on Swedish farms?
Vertical bifacial arrays enable agrivoltaics that preserve crop yield while boosting energy output by 1015%.
What hurdle most limits near-term solar deployment?
Distribution-grid congestion in southern zones currently imposes the longest delays and highest upgrade costs.
Page last updated on:





