
Market Overview
| Study Period | 2020 - 2031 |
|---|---|
| Forecast Data Period | 2026 - 2031 |
| Base Year Market Size (2025) | USD 209.13 Billion |
| Market Size (2026) | USD 218.64 Billion |
| Market Size (2031) | USD 273.09 Billion |
| Growth Rate (2026 - 2031) | 4.55 % |
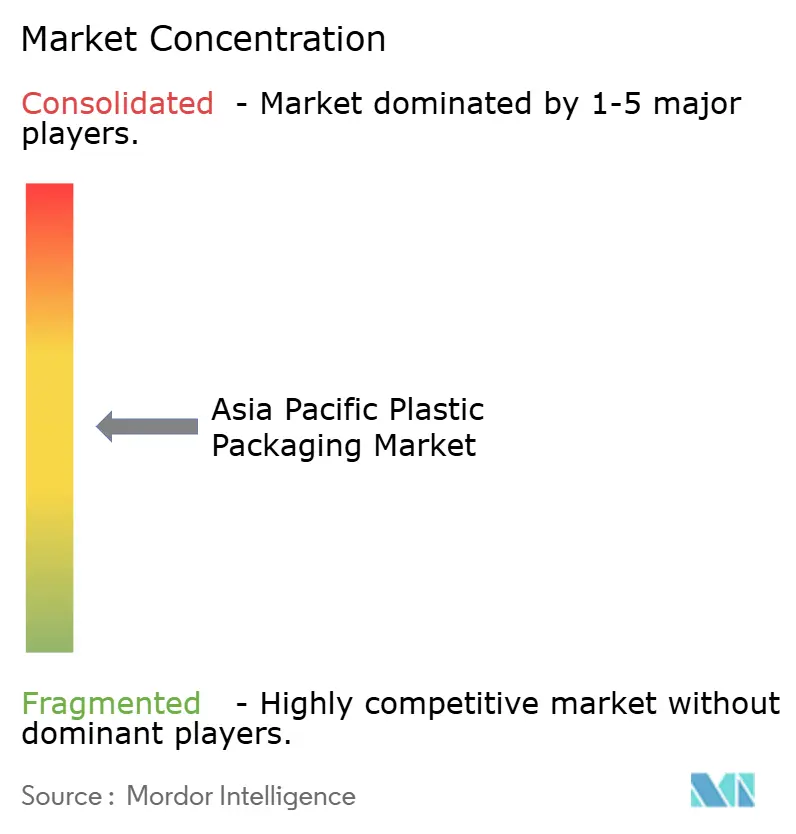
| Market Concentration | Medium |
Major Players *Disclaimer: Major Players sorted in no particular order Image © Mordor Intelligence. Reuse requires attribution under CC BY 4.0. | |
Asia Pacific Plastic Packaging Market Analysis by Mordor Intelligence
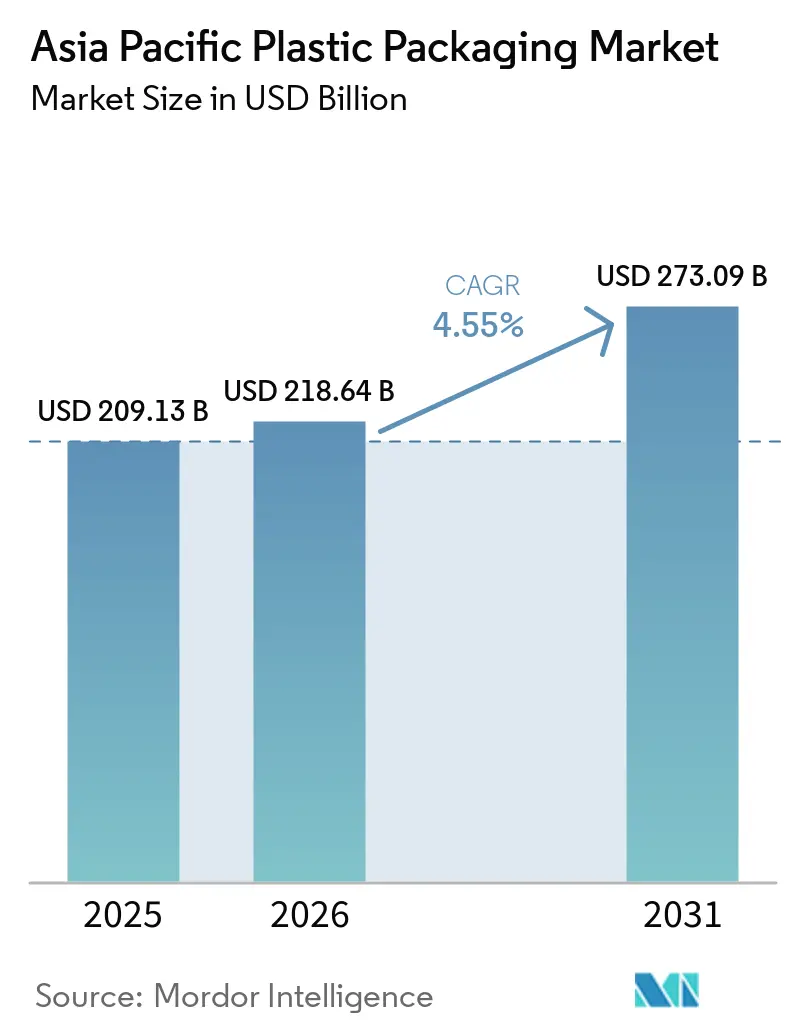
The Asia-Pacific plastic packaging market size is expected to grow from USD 209.13 billion in 2025 to USD 218.64 billion in 2026 and is forecast to reach USD 273.09 billion by 2031 at 4.55% CAGR over 2026-2031. Robust e-commerce growth, shifting consumer preferences, and escalating sustainability mandates underpin demand for cost-efficient, lightweight formats that protect products across complex logistics networks. Regulatory programs such as Thailand’s Extended Producer Responsibility (EPR) Phase 2 accelerate the pivot from multi-layer laminates to mono-material structures, stimulating rapid design innovation. Polyethylene retained leadership with 38.65% share in 2024, while bottle-to-bottle recycling investments propelled Polyethylene Terephthalate (PET) to the fastest 5.32% CAGR through 2030. Flexible solutions captured 54.86% share as pouches and sachets met portion-control and refill initiatives, whereas thermoforming emerged as the quickest-growing process at 5.62% CAGR, reflecting a shift toward precise, thin-wall applications for healthcare and premium food packs.
Key Report Takeaways
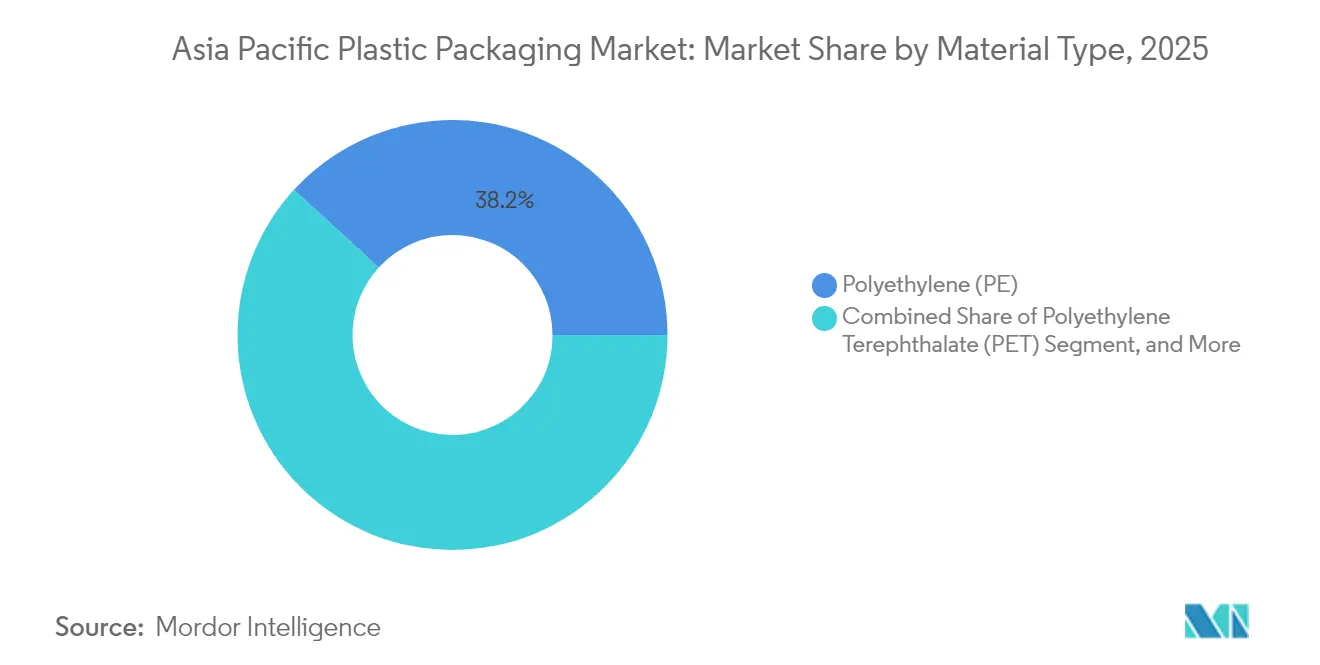
- By material type, polyethylene led with 38.20% of Asia-Pacific plastic packaging market share in 2025; PET is forecast to expand at a 5.24% CAGR through 2031.
- By packaging type, flexible formats commanded 54.30% share of the Asia-Pacific plastic packaging market size in 2025 and are projected to grow at 6.65% CAGR to 2031.
- By product form, pouches and sachets held 34.00% share of the Asia-Pacific plastic packaging market size in 2025, while films and wraps post the highest 5.84% CAGR through 2031.
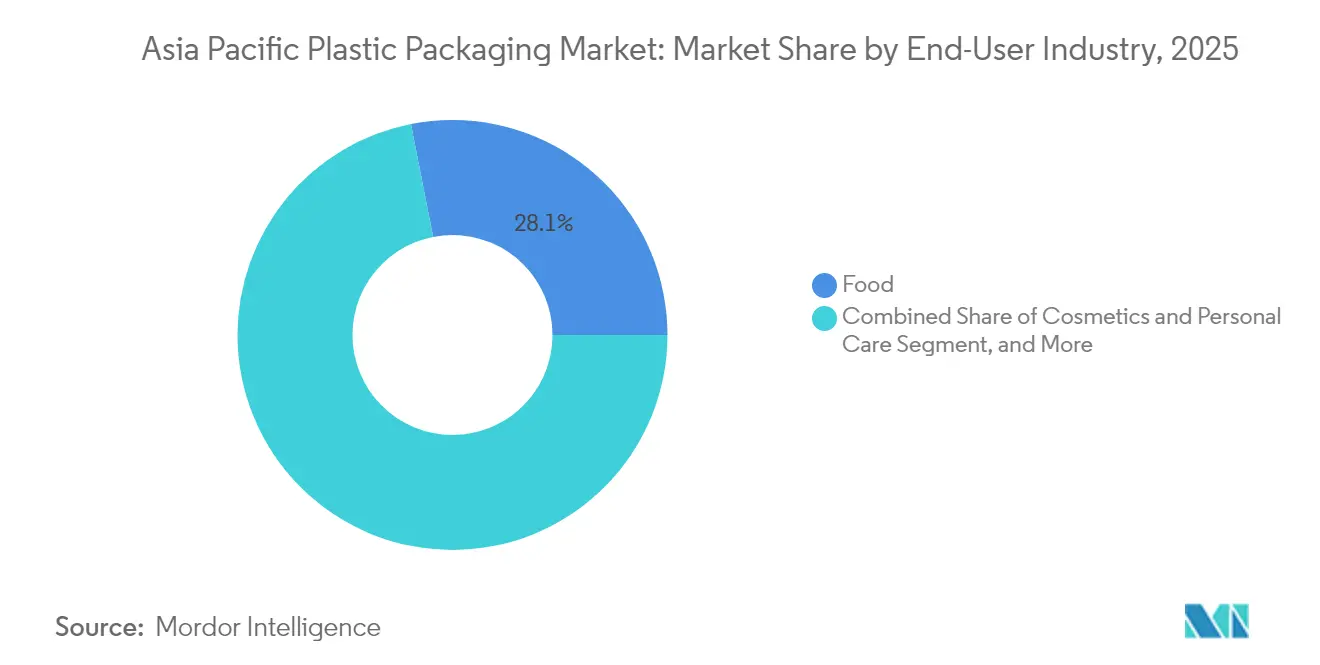
- By end-user industry, food accounted for 28.10% of the Asia-Pacific plastic packaging market size in 2025; cosmetics and personal care is advancing at a 5.92% CAGR to 2031.
- By manufacturing process, extrusion held 27.10% share of the Asia-Pacific plastic packaging market size in 2025, whereas thermoforming records the quickest 5.54% CAGR through 2031.
- By geography, China held 22.20% Asia-Pacific plastic packaging market share in 2025; India delivers the fastest 7.78% CAGR through 2031.
Note: Market size and forecast figures in this report are generated using Mordor Intelligence’s proprietary estimation framework, updated with the latest available data and insights as of 2026.
Market Trends and Insights
Drivers Impact Analysis of Asia Pacific Plastic Packaging Market*
| Driver | (~) % Impact on CAGR Forecast | Geographic Relevance | Impact Timeline |
|---|---|---|---|
| E-commerce boom demanding lightweight, damage-resistant packs | +1.2% | ASEAN core, India, China urban centers | Short term (≤ 2 years) |
| Growing organised retail and convenience-food penetration | +0.8% | India, Vietnam, Philippines, Indonesia | Medium term (2-4 years) |
| Shelf-life extension via advanced barrier films | +0.6% | Japan, South Korea | Long term (≥ 4 years) |
| Sachet-to-refill transition programs in ASEAN | +0.4% | Thailand, Malaysia, Indonesia, Philippines | Medium term (2-4 years) |
| AI-enabled converting lines boosting small-lot customization | +0.5% | Japan, South Korea, Singapore, China Tier-1 cities | Long term (≥ 4 years) |
| Corporate green-bond funding tied to recycled-content KPIs | +0.3% | Australia, Japan, multinational operations | Long term (≥ 4 years) |
| Source: Mordor Intelligence | |||
E-commerce boom demanding lightweight, damage-resistant packs
Rapid parcel growth obliges converters to engineer packaging that survives multiple handling points without inflating freight costs. Beverage producers in Thailand adopted label-free PET bottles during 2024 to facilitate automated sortation in fulfillment centers. Nanoclay-enhanced barrier films enable 30–50% weight reduction versus conventionally laminated formats, lowering material outlay while retaining integrity. Specialized PE and PP grades with superior impact resistance now dominate electronics shipments, whereas platform operators publish stringent drop-test standards that favor suppliers offering proven compression strength.
Growing organised retail and convenience-food penetration
Expansion of modern trade in India, Vietnam, and Indonesia lifts demand for shelf-stable, aesthetic packs calibrated for fluorescent store lighting. Vietnam’s pharmaceutical investments by SK Group and Samil Pharmaceutical illustrate how formal retail elevates packaging standardization.[1]Vietnam Ministry of Health, “Pharmaceutical Sector Development,” MOH.GOV.VN High-barrier BOPP and metallized BOPET films replace foil, ensuring oxygen and moisture defense while improving recyclability. Portion-controlled dairy and ready meals benefit from cold-chain compatible laminates, and consolidated retailers enable converters to spread fixed costs across larger order volumes.
Shelf-life extension via advanced barrier films
Japan’s 2025 positive list for food-contact materials caps migratory limits and spurs development of multi-layer structures using EVOH and specialty nylons, supporting growth in the asia pacific plastic packaging film industry as oxygen transmission falls below 0.1 cc/m²/day. Active packaging incorporating oxygen scavengers pushes ambient shelf life for products formerly chilled, trimming energy expenses. Pharmaceutical blister manufacturers leverage similar chemistries to guarantee label adhesion during elongated storage while meeting serialization mandates.
Sachet-to-refill transition programs in ASEAN
Thailand’s EPR Phase 2 rewards brands for refill-compatible designs, accelerating mono-material PE pouch adoption that eases mechanical recycling. Refill stations in modern trade reduce single-use resin volumes, and reverse-logistics pilots prove economically viable at city scale. Producers coordinate supply chains to manage pouch collection, cleaning, and re-deployment, directing investment toward consumer engagement and tracking platforms that verify plastic-reduction targets.
Restraints Impact Analysis of Asia Pacific Plastic Packaging Market*
| Restraint | (~) % Impact on CAGR Forecast | Geographic Relevance | Impact Timeline |
|---|---|---|---|
| Escalating single-use-plastic bans and EPR fees | -0.9% | EU spillover to ASEAN, Australia, Japan | Short term (≤ 2 years) |
| Volatile crude-linked resin prices | -0.7% | Global, acute in import-dependent markets | Short term (≤ 2 years) |
| PE and PP structural oversupply depressing converter margins | -0.5% | China, India manufacturing hubs | Medium term (2-4 years) |
| Traceability gaps limiting rPET food-grade uptake | -0.3% | Developing markets | Long term (≥ 4 years) |
| Source: Mordor Intelligence | |||
Escalating single-use-plastic bans and EPR fees
Singapore’s beverage-container deposit scheme launching in 2026 imposes a USD 0.10 levy per unit, inflating pack costs and re-routing consumer demand toward refill options. Differing EPR fee structures across ASEAN complicate harmonized pack designs and spur compliant firms to absorb higher resin substitution and testing expenses, squeezing margins versus unregulated competitors.
Volatile crude-linked resin prices
Spot propylene touched USD 1,200/ton in 2024, whittling converter profit where customer contracts fix prices for up to six months.[2]Asian Petrochemical Industry Association, “Propylene Price Analysis,” APIC.ORG Geopolitical supply shocks and refinery turnarounds increase hedging complexity, while currency swings amplify cost swings in import-dependent economies. Emerging bio-based PE and PP add new price variables, challenging procurement strategies.
*Our forecasts treat driver/restraint impacts as directional, not additive. The impact forecasts reflect baseline growth, mix effects, and variable interactions.
Asia Pacific Plastic Packaging Market Segment Analysis
By Material Type:
PE Dominance Faces PET Innovation ChallengePolyethylene held 38.20% Asia-Pacific plastic packaging market share in 2025 through cost-effective versatility across films, bottles, and closures. PET is marching at 5.24% CAGR, buoyed by enzymatic depolymerization partnerships such as Wankai–Carbios targeting 50,000 t/y rPET output in China. PET’s hot-fill capable bottles displace glass in condiments, improving logistics safety and carbon footprints. Polypropylene sustains niches demanding high-heat tolerance, while biodegradable polymers and paper laminates secure premium, regulation-driven slots armed with ISO 17088 certifications.
Continued PE price competitiveness keeps legacy lines running, yet EPR-driven design shifts favor PET mono-material loops thanks to bottle-to-bottle infrastructure. Oxygen-scavenging additives enhance PET’s barrier, and bottle flake supply closes as brand recycled-content pledges trigger Tender-based purchasing. PE producers explore high-density grades blended with metallized strip layers to protect aroma-sensitive goods, seeking parity with PET while safeguarding recyclability.



By Packaging Type:
Flexible Solutions Drive InnovationFlexible formats commanded 54.30% Asia-Pacific plastic packaging market size in 2025, scaling at 6.65% CAGR as converters strip weight and move toward mono-material laminates per Huhtamaki India’s Design for Recycling Guidance. Eliminating aluminum foil and PVC additives unlocks mechanical recycling streams. Rigid containers remain essential for carbonated beverages and personal-care pumps where dimensional accuracy and impact resistance outweigh material-use advantage.
Consumer gravitation to on-the-go snacks and home-delivery meals boosts stand-up pouch volumes, while rigid HDPE bottles gain traction in refill stations supporting controlled reuse cycles. Brand owners pilot QR-enabled pouches that direct consumers to collection points, closing data gaps on post-use material flow. Parallel investment in delamination tech aims to salvage high-value barrier layers, offering flexible packs a path toward parity with bottle recycling rates.
By Product Form:
Pouches Lead Sustainability TransitionPouches and sachets held 34.00% share in 2025, leveraging spouted-pouch sealing breakthroughs like Dukane’s SynQro ultrasonic technology that cuts energy by up to 80% and enables mono-material PE. Films and wraps head growth at 5.84% CAGR as stretch and shrink applications replace corrugated secondary packaging, trimming freight inputs.
Trays serving chilled ready meals deploy PET/PE lidding with antifog coatings, securing shelf appeal. Caps and closures evolve via Origin Materials’ thermoformed PET cap system, allowing bottle-to-bottle recycling and maintaining high-speed line throughput. Bulk bags and FFS sacks in agriculture adopt woven-PP upgrade paths to withstand harsher supply-chain vibrations.
By End-User Industry:
Cosmetics Growth Challenges Food DominanceFood retained 28.10% Asia-Pacific plastic packaging market size in 2025, driven by barrier packs curbing spoilage across extended ambient routes. The cosmetics and personal-care vertical, however, is rising at 5.92% CAGR as refillable jars and PCR-content bottles resonate with millennial and Gen Z purchasers. Kao and C.P. Group’s 2024 MOU showcases bespoke closed-loop solutions for local skincare lines.
Beverage brands push lightweight neck finishes in PET, shaving grams without compromising carbonation. Pharma expansion in India spurs blister and IV-bag demand meeting U.S. and EU audit criteria, while chemical suppliers to auto and electronics specify antistatic films guaranteeing parts integrity.
By Manufacturing Process:
Thermoforming Innovation AcceleratesExtrusion sustained 27.10% Asia-Pacific plastic packaging market size in 2025 owing to high-volume film, sheet, and bottle output, but thermoforming’s 5.54% CAGR underscores migration to intricate, thin-wall geometry packs. TotalEnergies’ 2025 collaboration with SML illustrates edge-trim-free roll-stack lines marrying recyclable materials with energy-efficient heaters.
Injection molding continues in closure systems requiring dimensional rigor, yet hybrid thermo-injection cells cut cycle times for yogurt cups bearing in-mold labels. Blow molding benefits from AI temperature feedback loops, maintaining wall uniformity while trimming regrind rates.
Geography Analysis
China Plastic Packaging Market
China held 22.20% Asia-Pacific plastic packaging market share in 2025, anchored by vast resin capacity and export-oriented converting clusters. Domestic EPR deadlines spur mono-material design adoption and chemical-recycling pilots within Sinopec and CNPC complexes. Belt-and-Road projects open new outlets for converters supplying dairy and snack brands expanding into Central Asia.
India Plastic Packaging Market
India grows fastest at 7.78% CAGR, energized by formal retail expansion and robust pharmaceutical exports. Mold-Tek’s multi-state capacity additions illustrate domestic players scaling automation to satisfy compliance audits for regulated markets. Waste-management rules press brands to collect multilayer films, stimulating alliances with recyclers piloting delamination.
APAC and Oceania Plastic Packaging Market
Japan and South Korea spearhead R&D in biodegradable PBS and enhanced-barrier nylon. Government grants earmarked through 2028 sponsor lab-to-scale transitions, and regional suppliers license tech to ASEAN partners. Australia sets recyclability design standards mirrored by multinationals across Oceania supply chains.
ASEAN Plastic Packaging Market
The rest of Asia-Pacific, including Indonesia, Philippines, and Vietnam, leverages cost advantages to attract investment in pouch and sachet lines serving local food staples and beauty refill models. Green-bond frameworks in Singapore and Malaysia finance rPET pelletizing plants, expanding feedstock for global brand recycled-content pledges.
Regulatory Landscape
Across Asia-Pacific, packaging policy is tightening around extended producer responsibility (EPR), recycled-content thresholds, and auditable reporting. In March 2026, India notified the Plastic Waste Management (Amendment) Rules, 2026, introducing phased recycled-content requirements across rigid, flexible, and multi-layered packaging and adding environmental audit expectations, alongside enforcement of BIS compliance for recycled plastic products (IS 14534:2023) under the updated framework.
In Southeast and East Asia, EPR programs are being formalized and expanded in ways that shape pack design and material selection. Vietnam issued Decree No. 110/2026/ND-CP in April 2026 to set updated EPR requirements for product and packaging recycling and waste treatment, while China released a 2026 State Council action plan on comprehensive solid-waste management that includes mandatory plastic reduction measures and a green transition for express packaging, reinforcing the shift toward mono-material and traceable recycling loops.
Value Chain Analysis
The regional value chain covers petrochemical feedstocks and polymer production (PE, PP, PET), compounding and additive supply, converting (films, pouches, bottles, trays via extrusion, blow molding, injection, and thermoforming), brand owners and co-packers, and distribution through modern trade and e-commerce logistics networks. Upstream activity remains exposed to crude and naphtha-linked volatility and import dependencies, while downstream pack specifications are increasingly driven by platform-led performance requirements (damage resistance for parcel networks) and food-contact compliance regimes.
EPR and recycled-content mandates are reshaping midstream and downstream linkages, pushing converters and brand owners to secure post-consumer resin (PCR) supply, improve traceability, and build collection and sorting partners into procurement decisions. Public and multilateral programs, including UNDP-led plastics circularity initiatives in Asia-Pacific, support collection and recycling capability build-out, while cross-market compliance complexity (different EPR definitions, fee structures, and audit approaches) increases the need for centralized data/reporting systems and long-term contracts with recyclers for rPET and recycled polyolefins.
Competitive Landscape
The Asia-Pacific plastic packaging market is moderately fragmented. Novolex’s USD 6.7 billion merger with Pactiv Evergreen enlarges a cross-regional footprint spanning bags, wraps, and rigid containers, presenting integration playbooks likely to replicate in Asia.[3]Novolex, “Completion of Combination with Pactiv Evergreen,” NOVOLEX.COM Amcor channels green-bond proceeds toward high-barrier, recycle-ready AmFiber lines, reinforcing premium share. Huhtamaki India’s recycling design handbook positions the firm as a knowledge partner to local FMCG brands implementing EPR scorecards.
Emergent disruptors target circularity gaps: Beyond Plastic explores fermentation-based PHA caps addressing ocean-leakage concerns. Amandina Bumi Nusantara’s SNI-approved food-grade rPET signals Southeast Asia’s ascent in closed-loop feedstock. Converter margins hinge on resin hedging and automation; AI deployment in converting lines tilts competitiveness toward capital-rich operators.
Asia Pacific Plastic Packaging Industry Leaders
Amcor plc
Mondi plc
Sonoco Products Company
International Paper Company
Sealed Air Corporation
- *Disclaimer: Major Players sorted in no particular order
Asia Pacific Plastic Packaging Market Companies Covered in this Report
- Amcor plc
- Mondi plc
- Sonoco Products Company
- International Paper Company
- Sealed Air Corporation
- Huhtamaki Oyj
- ALPLA-Werke Alwin Lehner GmbH and Co KG
- Uflex Ltd.
- Plastipak Holdings Inc.
- Pactiv Evergreen Inc.
- Winpak Ltd.
- Toyo Seikan Group Holdings Ltd.
- Nihon Yamamura Glass Co., Ltd.
- Manjushree Technopack Ltd.
- Time Technoplast Ltd.
- Greif Inc.
- IFCO Systems GmbH
- Dynapack Asia Sdn Bhd
- Cheng Loong Corp.

Market Opportunities and Future Outlook
Regulation-driven redesign and compliance services are creating whitespace across mono-material structures, recycled-content integration, and verifiable traceability systems for multi-country operations. India and Vietnam tightened EPR-linked obligations in 2026, with India moving through the Plastic Waste Management (Amendment) Rules, 2026, and Vietnam through Decree No. 110/2026/ND-CP, which raises demand for packaging formats that can meet recycled-content thresholds and documentation requirements without disrupting high-volume food, personal care, and healthcare supply chains.
Cross-border logistics and regional manufacturing investments also support differentiation. The RCEP Green Packaging Mutual Recognition Arrangement took effect on June 1, 2026, enabling reusable express packaging certified to China standard GB/T 37572-2025 to circulate into markets such as Australia, Japan, New Zealand, and South Korea without re-testing, which supports scale-up of reusable transit packaging in parcel networks. On the supply side, packaging producers are adding capacity and capability for more localized, higher-spec output, including Amcor commencing an expansion of its flexible packaging facility in Dongguan, China (new manufacturing unit and automated warehousing) and ALPLA opening a manufacturing hub in Calamba City, Philippines, both aligned with faster-turnaround regional supply and customer-specific sustainability scorecards.
Recent Industry Developments in Asia Pacific Plastic Packaging Market
- July 2026: Amcor commenced an expansion of its flexible packaging facility in Dongguan, China, adding a new 7,000-square-meter manufacturing unit and an automated warehouse. The project increases in-region capacity for food and personal care flexible packaging while supporting faster service levels for China-focused and export-oriented FMCG supply chains.
- May 2025: Novolex and Pactiv Evergreen completed their USD 6.7 billion combination, expanding scale across food and specialty packaging categories. The integration strengthens global procurement leverage and provides a template for footprint rationalization and portfolio broadening that can influence competitive intensity in Asia-Pacific packaging supply.
- February 2024: Kao and C.P. Group signed an MOU focused on developing closed-loop solutions for local skincare and related packaging streams. The collaboration underscores brand-owner pull for circular packaging models in Asia, increasing demand for design-for-recycling formats and reliable post-consumer resin supply partnerships.


Asia Pacific Plastic Packaging Market Report Scope and Research Methodology
Market Definition and Coverage
This market covers the value of plastic packaging products sold across Asia-Pacific, spanning rigid and flexible formats used to pack and protect consumer and industrial goods.
Scope exclusions: It does not count paper, glass, or metal packaging, and it excludes packaging services that are billed separately from the packaging product sale.
Segments Covered in This Report
- By Material Type
- Polyethylene (PE)
- Polypropylene (PP)
- Polyethylene Terephthalate (PET)
- Polystyrene and EPS
- Other Material Types
- By Packaging Type
- Flexible Plastic Packaging
- Rigid Plastic Packaging
- By Product Form
- Bottles and Jars
- Trays and Containers
- Pouches and Sachets
- Bags and Sacks
- Films and Wraps
- Other Product Forms
- By End-User Industry
- Food
- Beverage
- Pharmaceuticals and Healthcare
- Cosmetics and Personal Care
- Industrial
- Other End-user Industries
- By Manufacturing Process
- Extrusion
- Injection Molding
- Blow Molding
- Thermoforming
- By Country
- China
- India
- Japan
- South Korea
- Australia
- Rest of Asia Pacific
Data Sources, Market Sizing, and Validation
Desk Research
Desk research was used to build the starting structure of the market and to anchor country-level demand signals to real-world activity. We relied on public statistics and technical references such as UN Comtrade trade data, national statistics offices in large APAC economies, OECD and World Bank macro indicators, and public customs or port authority releases where available. For plastics and packaging context, we also used industry association sites, peer-reviewed polymer and packaging journals, and government environment and waste-management policy updates that affect packaging material choices.
Alongside these, we reviewed company annual reports, investor presentations, and reliable press coverage to understand capacity additions, resin cost pass-through patterns, and changes in end-use demand (for example food, beverages, personal care, and healthcare packaging). Select paid subscriptions were used only to speed up checks on company financials, news coverage, patent activity, and shipment-level import-export patterns when country data was not reported consistently. The source list above is illustrative, and many other public and paid references were also used to collect, cross-check, and clarify inputs.
Primary Interviews and Surveys
Primary work helped us test the desk assumptions that typically move the value curve in plastic packaging, such as price realization, mix shifts between rigid and flexible, and how quickly sustainability requirements are changing purchasing decisions. We spoke with stakeholders across the value chain, including packaging converters, resin-linked suppliers, distributors, and large end users, and then cross-checked views across major APAC countries so that one country did not overly influence the regional outcome.
Distribution of primary research fieldwork respondents
| Company type | Respondent position |
|---|---|
| Top tier: 26% | CXOs: 15% |
| Mid tier: 56% | Functional/Unit leaders: 34% |
| Smaller Players: 18% | Managers: 51% |
Market-Sizing & Forecasting
The model starts with a top-down build where packaging demand is reconstructed by linking end-use packaging consumption in Asia-Pacific to production, trade, and macro indicators, and then converting it into value using observed price bands. We check the totals with selective bottom-up approximations, such as sampled supplier revenue patterns, channel feedback on volume movement, and a simple ASP times volume sanity check by key formats. This helps adjust for mix and reporting gaps.
Inputs that mattered most included resin price direction and pass-through timing, flexible versus rigid mix changes, packaged food and beverage output trends, e-commerce shipment intensity that increases demand for protective packaging, and healthcare and personal care consumption shifts that affect higher value packs. For forecasting, scenario analysis was used because cost pass-through, regulation timelines, and consumer downtrading can move volumes and prices in different directions. Expert feedback helped bound the scenarios to realistic ranges. Where bottom-up signals were missing for smaller countries, we filled gaps using proxy indicators like packaged goods output and import dependence, before validating that the implied per-capita packaging value stayed within a sensible range.
Data Validation & Update Cycle
Outputs were validated through multiple checks so the final number is not driven by one data series. We compare results against independent signals like trade intensity, packaged goods production changes, and reported capacity additions, and then we re-check sharp year-on-year shifts that do not match what interviewees and public data suggest.
Before sign-off, the model and assumptions go through a step-by-step analyst review where variances are explained, corrected, or documented. Reports are refreshed annually, and interim updates are made when there are material events such as major regulatory changes, sharp resin price shocks, or large capacity moves. Before delivery, a final update pass is completed so clients receive the most current view available.
Mordor Intelligence's Asia Pacific Plastic Packaging Market Size Compared Against Other Published Estimates
Published market values for APAC plastic packaging can look far apart because firms make different choices on what to count, how they treat pricing, and which year they lock as the base. Currency conversion timing, the handling of producer versus end-user price, and the refresh cadence also influence the final number.
By tracking key demand indicators and refreshing price realization assumptions country by country, Mordor Intelligence keeps the estimate tied to packaging product revenues in Asia-Pacific instead of mixing in retail margins or broad adjacent materials.
Benchmark comparison
| Source | Market Size | Gaps in Research Methodology |
|---|---|---|
| Mordor Intelligence | USD 209.13 B (2025) | |
| Trade Data Publisher A | USD 141.00 B (2024) | Value is commonly framed at nominal wholesale prices and can exclude logistics, marketing, and retail margins, and the year and country coverage can be less consistent across APAC. |
| Industry Data Publisher B | USD 132.80 B (2035) | Long-range projections may assume slower value growth and may rely on broad price baselines, which can understate nearer-term mix changes between flexible and rigid formats. |
The spread mainly comes from price basis and boundary choices, plus how far the forecast horizon stretches. Our approach stays repeatable by linking the value build to observable demand signals, then using interview feedback to correct mix and pricing assumptions before finalizing the totals.


Key Questions Answered in the Report
How large is the Asia-Pacific plastic packaging market in 2026?
The region generated USD 218.64 billion in 2026.
What is the projected CAGR for Asia-Pacific plastic packaging to 2031?
The market is forecast to advance at 4.55% CAGR.
Which material is growing fastest in Asia-Pacific plastic packaging?
PET leads with a projected 5.24% CAGR, driven by recycling infrastructure.
Why are flexible packs expanding quickly in Asia-Pacific?
Mono-material pouches and film weight savings align with EPR mandates and e-commerce logistics.
Which country will deliver the highest growth through 2031?
India is expected to post a 7.78% CAGR on organized retail and pharma expansion.
Page last updated on:





