Surface Radars Market Size and Share
Market Overview
| Study Period | 2019 - 2030 |
|---|---|
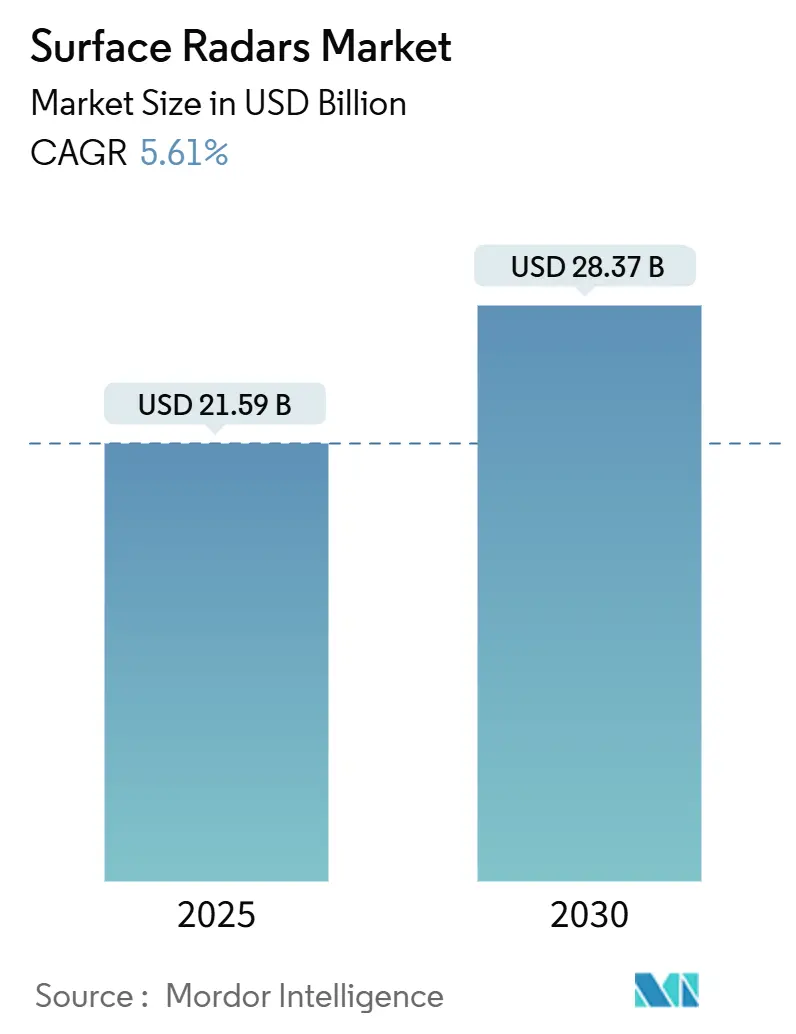
| Market Size (2025) | USD 21.59 Billion |
| Market Size (2030) | USD 28.37 Billion |
| Growth Rate (2025 - 2030) | 5.61% CAGR |
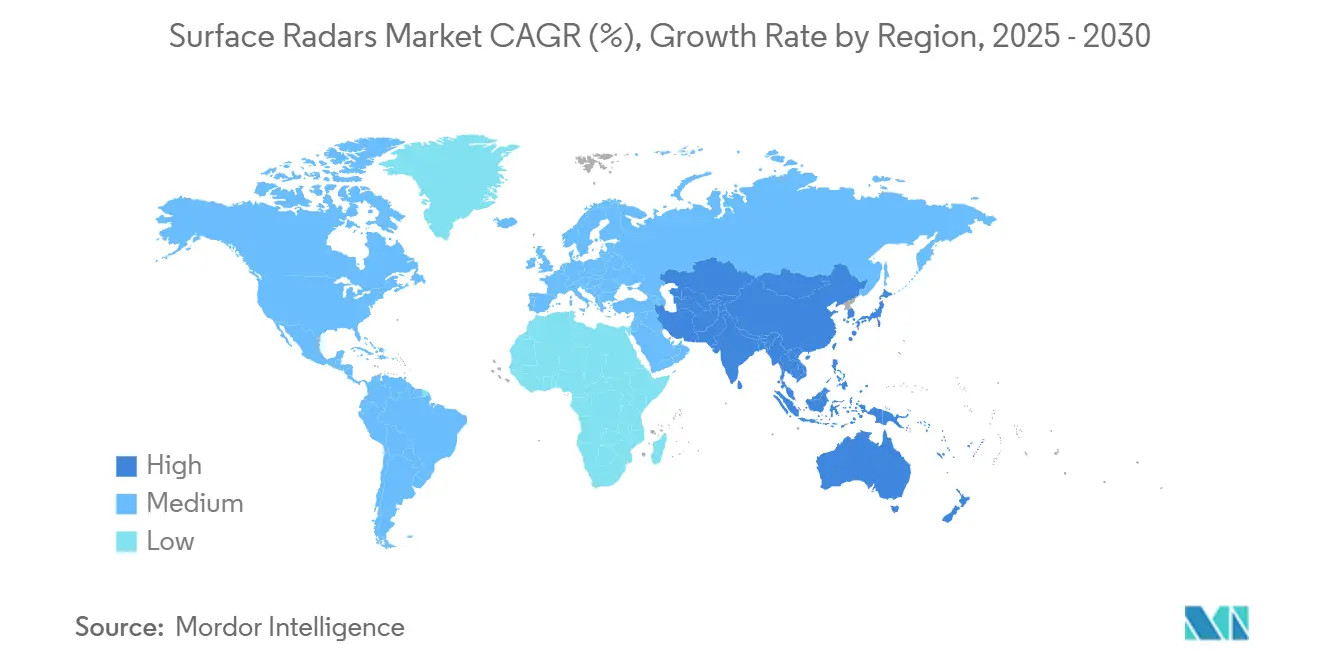
| Fastest Growing Market | Asia Pacific |
| Largest Market | North America |
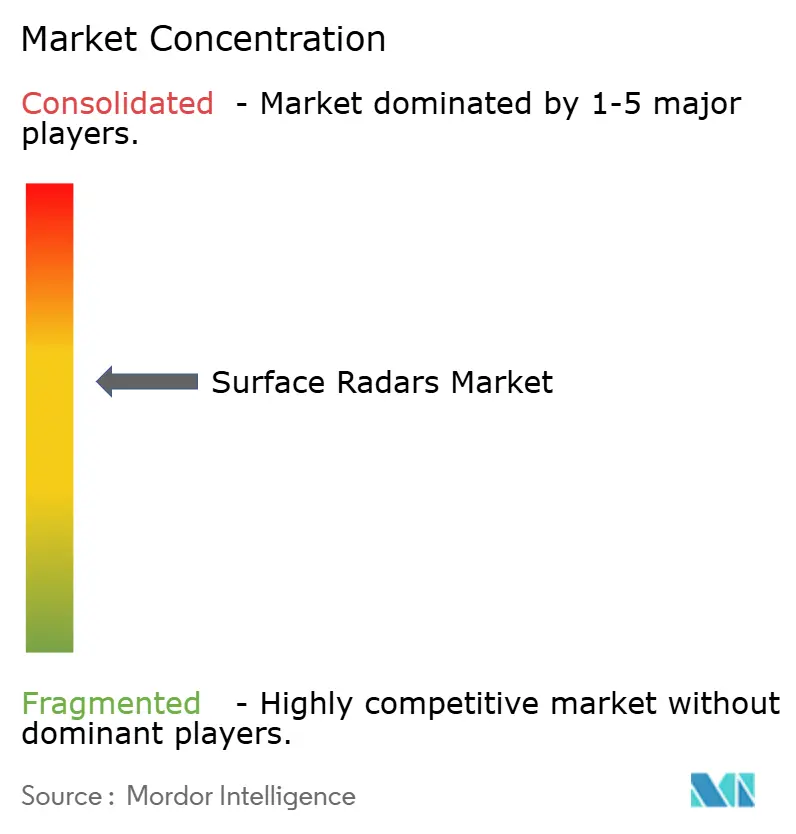
| Market Concentration | Medium |
Major Players *Disclaimer: Major Players sorted in no particular order Image © Mordor Intelligence. Reuse requires attribution under CC BY 4.0. | |
Surface Radars Market Analysis by Mordor Intelligence
The surface radars market size is valued at USD 21.59 billion in 2025 and is forecasted to reach USD 28.37 billion by 2030, reflecting a 5.61% CAGR. Robust modernization programs, expanding coastal surveillance networks, and accelerated replacement of legacy systems with active electronically scanned array (AESA) platforms underpin this growth trajectory. Intensifying geopolitical tensions sustain high defense outlays, while advances in gallium-nitride (GaN) power electronics and digital beam-forming elevate detection range, target classification accuracy, and multi-mission versatility. Maritime domain awareness initiatives amplify demand for radars that seamlessly track air, surface, and low-observable threats under spectrum-congested conditions. Competitive dynamics remain moderately consolidated as long-established contractors leverage mature AESA portfolios, but new entrants gain visibility by embedding AI-enabled signal processing and software-defined architectures.
Key Report Takeaways
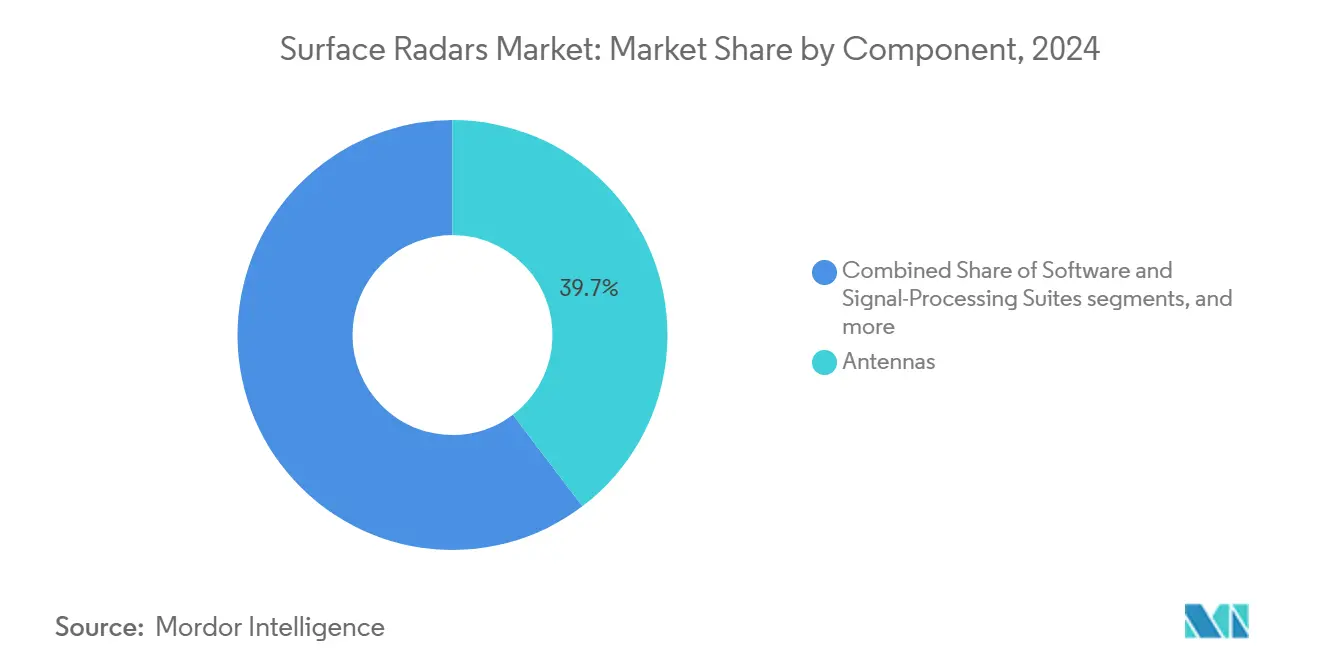
- By component, antennas led the surface radar market with a 39.68% share in 2024, whereas software and signal-processing suites are projected to deliver the fastest 6.57% CAGR through 2030.
- By platform, land-based fixed installations held 56.32% of 2024 revenue; naval surface vessels registered the highest 7.48% CAGR to 2030.
- By frequency band, L-/UHF-band systems captured 41.28% of the 2024 surface radars market share; X-/Ku-Ka-band solutions expand at a 7.29% CAGR through 2030.
- By application, surveillance accounted for 59.51% of 2024 revenue, while air-defense radars climbed at a 6.59% CAGR over the forecast horizon.
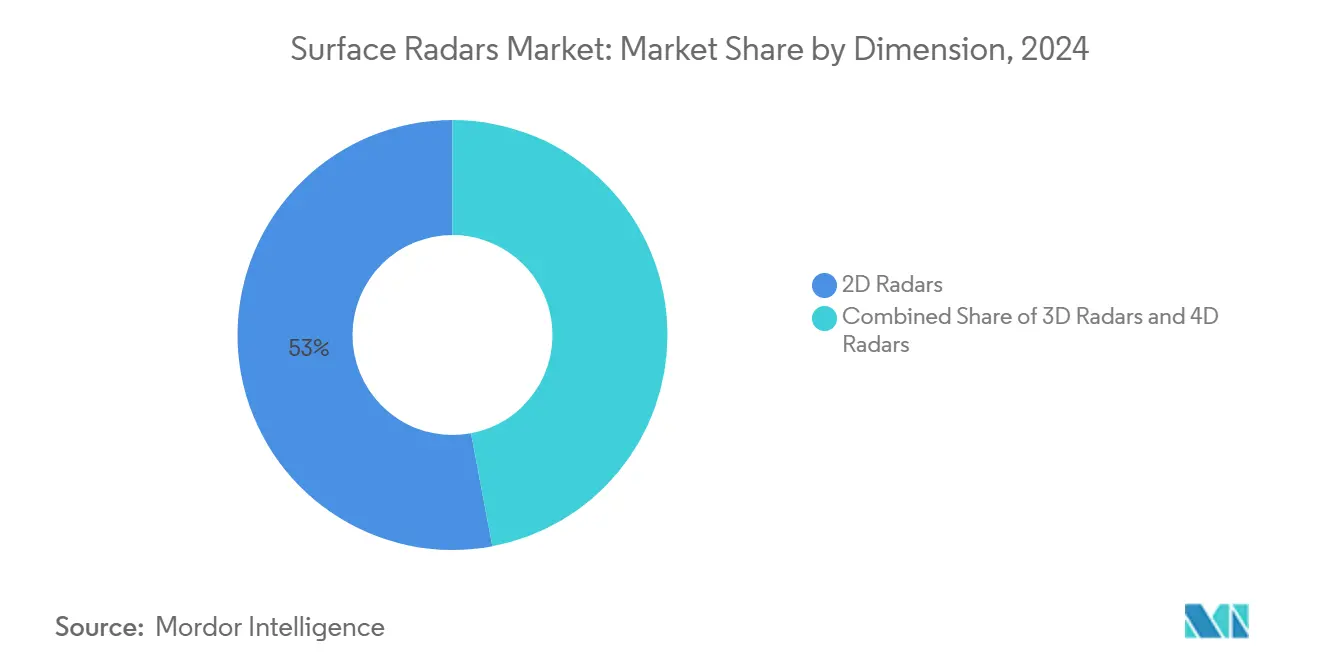
- By dimension, 2D radars retained a 52.97% share in 2024; 4D technology advances at an 8.41% CAGR to 2030.
- By geography, North America commanded 39.59% of 2024 sales; Asia-Pacific grew fastest at a 5.92% CAGR to 2030.
Global Surface Radars Market Trends and Insights
Drivers Impact Analysis*
| Driver | (~) % Impact on CAGR Forecast | Geographic Relevance | Impact Timeline |
|---|---|---|---|
| Expansion of multi-mission coastal surveillance networks | +1.20% | Global, concentrated in Asia-Pacific and Europe | Medium term (2-4 years) |
| Modernization programs for legacy air-defense radar parks | +1.80% | North America and Europe, expanding to Asia-Pacific | Long term (≥ 4 years) |
| Integration of active electronically-scanned array (AESA) technology into ground radars | +1.50% | Global, led by North America and Europe | Medium term (2-4 years) |
| Rise in frequency-congested environments driving digital beam-forming R&D | +0.90% | Global, notably urban theaters | Long term (≥ 4 years) |
| Sovereign radar production to reduce import dependency | +1.10% | Asia-Pacific, Middle East, select Europe | Long term (≥ 4 years) |
| Advanced threat detection requirements for 4D radar capabilities | +1.30% | Global, early adoption in North America and Europe | Medium term (2-4 years) |
| Source: Mordor Intelligence | |||
Expansion of Multi-Mission Coastal Surveillance Networks
Next-generation coastal networks integrate air, surface, and low-slow-small (LSS) drone detection to secure sea lanes and littoral economic zones. The Philippines-Japan coastal radar deal demonstrates a bilateral push for shared maritime domain awareness, while HENSOLDT’s passive radar certification underscores dual-use civil defense potential.[1]HENSOLDT News, “HENSOLDT Passive Radar to Be Used in Civil Aviation,” hensoldt.net AI-enabled classification cuts operator workload, making multi-mission suites attractive amid a constrained workforce. Regional navies increasingly link fixed coastal sites with shipborne sensors, producing data-fused common operating pictures that improve interdiction efficiency and accident response time.
Modernization Programs for Legacy Air-Defense Radar Parks
Cold-War-era assets are phased out in favor of GaN-powered AESA arrays that track maneuvering threats, hypersonic glide vehicles, and massed drones. RTX’s Lower Tier Air and Missile Defense Sensor cleared Milestone C and entered production for US and Polish forces, with 12 additional nations requesting procurement data. Lockheed Martin shipped 19 TPY-4 transportable 3D radars to the US Air Force, spotlighting global appetite for highly mobile, software-upgradeable systems. Extended service lives, lower life-cycle costs, and interoperability with networked C2 nodes drive replacement cycles.
Integration of AESA Technology into Ground Radars
Active arrays deliver rapid electronic beam steering, multi-target tracking, and resilience against jamming. Northrop Grumman’s USD 16.7 million APG-83 order evidences the diffusion of fighter-grade AESA into ground platforms. Active arrays deliver rapid electronic beam steering, multi-target tracking, and resilience against jamming.[2]John Keller, “Air Force Asks Northrop Grumman for AESA Radar Systems,” militaryaerospace.com They also merge air-surveillance and fire-control tasks onto a single aperture, trimming shipboard and land-site real estate while lowering auxiliary-power demands. Northrop Grumman’s USD 16.70 million APG-83 order signals the diffusion of fighter-grade AESA modules into fixed and mobile ground platforms, expanding economies of scale for standard line-replaceable units (LRUs). Field-swappable tiles shorten the mean time to restore and ease logistics for dispersed deployments that lack depot support. Gallium-nitride transmit/receive modules raise power density and thermal tolerance. However, elongated qualification cycles temper near-term fielding rates and prompt services to dual-source critical semiconductors for schedule assurance.
Rise in Frequency-Congested Environments Driving Digital Beam-Forming R&D
Commercial 5G rollouts and ubiquitous emitters crowd the spectrum, forcing defense labs to refine adaptive beam-forming and cognitive radar. Urban littoral zones expose coastal sensors to interference from container-port networks, cellular towers, and vehicle radars, degrading sensitivity unless sophisticated filtering is applied. MIT Lincoln Laboratory’s high-duty-cycle waveform mitigates near/far interference while sustaining detection range in dense traffic, validating time-of-arrival-weighted processing for contested bands.[3]MIT Lincoln Laboratory, “High-Duty-Cycle Radar with Near/Far Pulse Compression Interference Mitigation,” ll.mit.edu Program managers now specify digital beam-forming back-ends that retune in microseconds to dodge interferers without mechanical motion. Government regulators experiment with spectrum-sharing frameworks that protect mission-critical S- and X-band channels yet accommodate telecom expansion, putting a premium on live coexistence demos during certification trials.
Restraints Impact Analysis*
| Restraint | (~) % Impact on CAGR Forecast | Geographic Relevance | Impact Timeline |
|---|---|---|---|
| Spectrum-allocation delays for S- and X-band extensions | −0.8% | Global, acute in North America and Europe | Short term (≤ 2 years) |
| Budget diversion toward unmanned ISR payloads | −1.2% | North America and Europe, spreading to Asia-Pacific | Medium term (2-4 years) |
| Long qualification cycles for GA-N TR-modules | −0.6% | Global, all major defense markets | Long term (≥ 4 years) |
| Increasing reliance on space-based SAR substitutes | −0.9% | Global, higher in developed economies | Medium term (2-4 years) |
| Source: Mordor Intelligence | |||
Spectrum-Allocation Delays for S- and X-Band Extensions
Military planners confront lengthy coordination with telecom regulators, delaying coastal and air-defense radars slated for contested bands. FCC proceedings on the 3.45–3.55 GHz tranche highlight the tension between 5G commercialization and national-security priorities, extending project schedules and inflating contingency budgets. Contractors must warehouse completed arrays while awaiting certification, accruing holding costs that ripple through supply chains. Some programs pursue frequency-agile front-ends to sidestep licensing bottlenecks, but these modifications add engineering complexity and can re-trigger qualification cycles. Uncertainty compels defense ministries to carve out schedule reserve and authorize interim life-extension upgrades for legacy systems to avoid surveillance gaps.
Budget Diversion Toward Unmanned ISR Payloads
Procurement priorities now tilt toward unmanned intelligence, surveillance, and reconnaissance platforms, reducing funds for large fixed radars. The US Department of Defense (DoD) plans to invest USD 258.70 billion in drone programs this decade, redirecting capital once earmarked for ground-based arrays. Multi-sensor UAVs provide mobile coverage without permanent site footprints, enabling rapid redeployment as threat axes shift. To stay relevant, prime contractors position surface radars as network nodes that fuse airborne feeds, thus complementing rather than competing with unmanned assets. Vendors advance passive-receive modes and low-power expeditionary kits that ride with maneuver units, aligning with the distributed-sensor concepts favored in modern force-design roadmaps.
*Our forecasts treat driver/restraint impacts as directional, not additive. The impact forecasts reflect baseline growth, mix effects, and variable interactions.
Segment Analysis
By Component: Software-Centric Evolution Sustains Value Growth
The surface radars market size for antennas reached USD 8.57 billion in 2024, equating to a 39.68% share. Momentum nonetheless tilts toward software and signal-processing suites, expanding at a 6.57% CAGR as operators prioritize AI-assisted classification and clutter suppression to enhance lethality within electromagnetic spectrum–contested zones. The intrinsic scalability of software licensing promotes recurring revenue models and facilitates rapid capability insertion without hardware overhauls. Transmit/receive modules remain pivotal, benefiting from GaN’s higher power efficiency and thermal resilience. Power amplifiers secure a stable demand in long-range early-warning radars where output power correlates with the detection envelope. The “other components” cluster—encompassing quantum-optimized scheduling algorithms and compact exotic materials—emerges as a sandbox for next-generation performance leaps, with DLR’s quantum-computing radar resource initiative exemplifying front-edge R&D.
Second-tier suppliers capitalize on open-architecture mandates, coupling COTS processors with bespoke firmware to shorten integration cycles. Ecosystem diversification increases vendor optionality for primes while lowering the total cost of ownership for ministries of defense procuring through competitive tendering. Software-defined radios (SDRs) share common microelectronics with radars, creating cross-domain economies of scale.


By Platform: Naval Recapitalization Accelerates
Land-based fixed installations dominated 2024 revenue, reflecting sustained homeland defense budgets and the need for persistent over-the-horizon surveillance. However, naval surface vessels epitomize the fastest-rising opportunity set, growing at a 7.48% CAGR as blue-water navies retrofit destroyers, frigates, and amphibious ships with multi-function AESA arrays capable of ballistic missile defense and sea-skimming target intercepts. The SPY-6 family under a USD 646 million US Navy order marks scale procurement momentum.
Land-mobile platforms achieve balanced demand where maneuvers require air-picture mobility. Lockheed Martin’s AN/TPY-4 shipments illustrate a preference for transportable radar “kits” that rapidly airlift into contested theaters. Emerging airborne early-warning and space-based adjuncts complement ground nodes, underscoring convergence toward multi-layered sensor webs.
By Frequency Band: High-Band Adoption Gains Pace
L-/UHF-band radars held the leading share due to entrenched long-range surveillance roles and superior foliage penetration. Yet X-/Ku-/Ka-bands register a 7.29% CAGR, underpinned by precision-tracking imperatives for missile-defense cueing and counter-UAS missions. Regulatory bodies continue to navigate coexistence between military payloads and commercial satcom links, nudging designers toward frequency-agile, spectrum-aware architectures. C-band radars persist in weather monitoring and marine navigation niches. At the same time, multi-band systems employ advanced digital frequency synthesis to dynamically select optimal bands, raising resilience against denial or deception tactics.
By Dimension: 4D Technology Commands Innovation Budgets
2D solutions endure for basic sea-lane monitoring, but defense ministries pivot budget shares toward 3D and accelerating 4D procurement. The latter’s 8.41% CAGR mirrors the requirement to resolve cluttered low-altitude corridors where drones and cruise missiles transit. MatrixSpace Radar, selected by DHS for remote air-awareness trials, typifies compact 4D form factors that integrate seamlessly onto autonomous ground vehicles and perimeter towers.[4]MatrixSpace, “HSWERX Awards MatrixSpace Radar,” matrixspace.com Data-rich velocity-enabled tracks feed AI fusion engines, shrinking kill-chain timelines.
By Application: Air-Defense Segment Outpaces Other Missions
Surveillance continues to anchor revenue as coast guards, port authorities, and border police mandate continuous situational awareness. Nonetheless, air-defense outlays accelerate at 6.59% CAGR, driven by the proliferation of stand-off cruise missiles, swarming munitions, and hypersonic glide threats. Integrated fire-control radars interface directly with missile batteries, heightening performance specifications around track-while-scan capacity and latency. Perimeter security and battlefield ISR sustain niche-market pull, whereas counter-drone cells emerge as cross-segment integrators combining radar, EW, and kinetic effector layers.
Geography Analysis
North America’s surface radars market size approached USD 8.55 billion in 2024, reflecting investment in homeland IAMD and coastal domain awareness. RTX’s continued SPY-6 deliveries and Lockheed Martin’s TPY-4 acquisitions illustrate capital concentration in long-range, software-upgradeable sensors. Canadian participation in the Australia-Canada over-the-horizon radar partnership expands continental coverage while fostering two-nation industrial collaboration.
Asia-Pacific’s demand accelerates as maritime tensions spur coastal radar and shipborne sensor acquisition. The surface radars market size for the region is projected to exceed USD 6.35 billion by 2030, driven by Japan-Philippines technology exchanges and Taiwan’s multi-firm MOUs for IBCS-compatible systems. Sovereign build programs in India and Australia embed local value-add, supporting national security policy and export goals. Diverse topography and vast littoral stretches drive the uptake of transportable and naval systems optimized for archipelagic surveillance.
Europe shows steady replacement cycles synchronized with NATO capability roadmaps. Sweden’s Ground Master 200 procurement and Germany’s passive radar certification push sustain domestic manufacturing lines as HENSOLDT and Thales ramp throughput. Following the Russia–Ukraine conflict, elevated threat perceptions catalyze funding for counter-UAV and ballistic-missile defense sensors. Meanwhile, Middle East and African states seek multilayer PESA/AESA combinations to shield critical energy infrastructure, whereas South America adopts modest upgrades tied to border narcotics surveillance budgets.

Competitive Landscape
Market structure is moderately consolidated, with the top five suppliers capturing a significant revenue share in 2024. Lockheed Martin Corporation, RTX Corporation, Northrop Grumman Corporation, Thales Group, and HENSOLDT AG anchor portfolios spanning fixed, mobile, and naval configurations. RTX’s USD 646 million SPY-6 award and Lockheed Martin’s 3DELRR line reveal enduring leverage of incumbents in high-budget programs. HENSOLDT’s quantum-computing R&D and Thales Nederland’s production expansion highlight the European drive toward digital innovation.
Emerging entrants like Echodyne, MatrixSpace, and Arbe Robotics carve niches through metamaterial ESA, AI-augmented perception, and automotive cross-overs. Partnerships—e.g., Arbe’s alliance with NVIDIA—underline convergence between defense and commercial autonomy segments. Strategic differentiation shifts toward software-defined modularity, enabling faster over-the-air update cycles and lower obsolescence risk. Supply-chain resilience initiatives have propelled localized GaN fabrication and TR-module assembly inside key customer geographies, buffering against export-control headwinds.
Barriers to entry linger high owing to stringent military certifications, classified performance benchmarks, and capital-intensive anechoic test facilities. Yet open-architecture standards gradually democratize subsystem sourcing, encouraging smaller firms to supply specialized digital-signal-processing boards or cognitive-EW add-ons. Overall, competitive rivalry intensifies as stakeholder governments encourage diversified vendor bases for supply security.
Surface Radars Industry Leaders
Lockheed Martin Corporation
RTX Corporation
Thales Group
Northrop Grumman Corporation
HENSOLDT AG
- *Disclaimer: Major Players sorted in no particular order

Recent Industry Developments
- June 2025: RTX achieved a USD 646 million SPY-6 production and sustainment contract, raising total orders to 42 naval arrays.
- January 2025: HENSOLDT launched quantum-computing radar optimization research with DLR and Tensor AI, targeting multi-platform resource scheduling breakthroughs.
- January 2025: Lockheed Martin booked USD 118.40 million for additional AN/TPY-4 transportable radars, elevating the total 3DELRR contract to USD 471.60 million.


Global Surface Radars Market Report Scope
| Transmit/Receiver Modules |
| Antennas |
| Power Amplifiers |
| Software and Signal-Processing Suites |
| Other Components |
| Land-based Fixed Installations |
| Land-based Mobile Systems |
| Naval Surface Vessels |
| Other Platforms |
| L-/UHF-Band |
| S-Band |
| C-Band |
| X-/Ku-/Ka-Band |
| Multi-Band |
| 2D Radars |
| 3D Radars |
| 4D Radars |
| Surveillance |
| Air Defense |
| Perimeter and Security |
| Battlefield ISR |
| Other Applications |
| North America | United States | |
| Canada | ||
| Mexico | ||
| Europe | United Kingdom | |
| France | ||
| Germany | ||
| Italy | ||
| Russia | ||
| Rest of Europe | ||
| Asia-Pacific | China | |
| India | ||
| Japan | ||
| South Korea | ||
| Australia | ||
| Rest of Asia-Pacific | ||
| South America | Brazil | |
| Rest of South America | ||
| Middle East and Africa | Middle East | Saudi Arabia |
| Israel | ||
| Rest of Middle East | ||
| Africa | South Africa | |
| Rest of Africa | ||
| By Component | Transmit/Receiver Modules | ||
| Antennas | |||
| Power Amplifiers | |||
| Software and Signal-Processing Suites | |||
| Other Components | |||
| By Platform | Land-based Fixed Installations | ||
| Land-based Mobile Systems | |||
| Naval Surface Vessels | |||
| Other Platforms | |||
| By Frequency Band | L-/UHF-Band | ||
| S-Band | |||
| C-Band | |||
| X-/Ku-/Ka-Band | |||
| Multi-Band | |||
| By Dimension | 2D Radars | ||
| 3D Radars | |||
| 4D Radars | |||
| By Application | Surveillance | ||
| Air Defense | |||
| Perimeter and Security | |||
| Battlefield ISR | |||
| Other Applications | |||
| By Geography | North America | United States | |
| Canada | |||
| Mexico | |||
| Europe | United Kingdom | ||
| France | |||
| Germany | |||
| Italy | |||
| Russia | |||
| Rest of Europe | |||
| Asia-Pacific | China | ||
| India | |||
| Japan | |||
| South Korea | |||
| Australia | |||
| Rest of Asia-Pacific | |||
| South America | Brazil | ||
| Rest of South America | |||
| Middle East and Africa | Middle East | Saudi Arabia | |
| Israel | |||
| Rest of Middle East | |||
| Africa | South Africa | ||
| Rest of Africa | |||


Key Questions Answered in the Report
How large is the surface radars market in 2025?
The surface radars market size is assessed at USD 21.593 billion in 2025, with a 5.61% CAGR projected through 2030.
Which segment is growing fastest within surface radars?
4D radars post the highest 8.41% CAGR to 2030 as defense agencies seek velocity-enabled target discrimination.
Why are X-/Ku-Ka-band radars gaining traction?
Their finer resolution supports precision tracking for missile defense and counter-UAS missions, driving a 7.29% CAGR.
Which region shows the strongest growth?
Asia-Pacific leads at a 5.92% CAGR owing to heightened defense spending and indigenous production initiatives.
What is driving naval radar demand?
Global fleet modernization and integrated air-and-missile defense requirements boost naval platform radars at 7.48% CAGR.
How do AI and software define radar evolution?
AI-enabled signal processing cuts false alarms while software-defined upgrades allow rapid capability insertion without hardware swaps.
Page last updated on:


