Naval Radar Systems Market Size and Share
Market Overview
| Study Period | 2020 - 2031 |
|---|---|
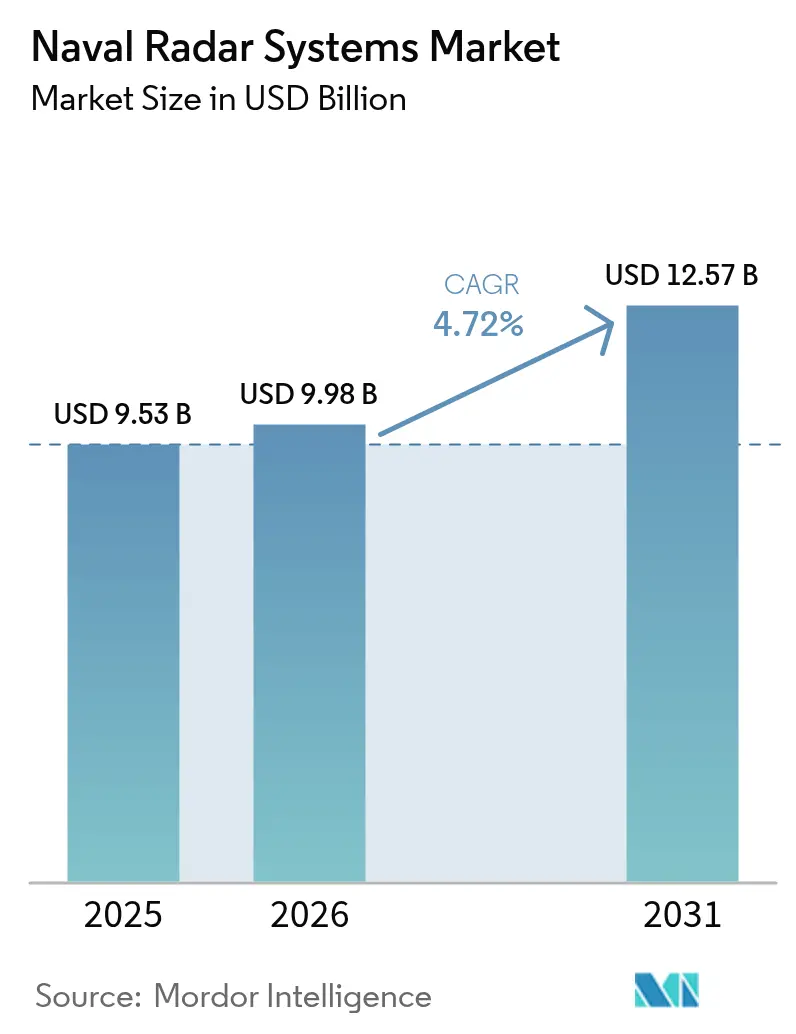
| Market Size (2026) | USD 9.98 Billion |
| Market Size (2031) | USD 12.57 Billion |
| Growth Rate (2026 - 2031) | 4.72% CAGR |
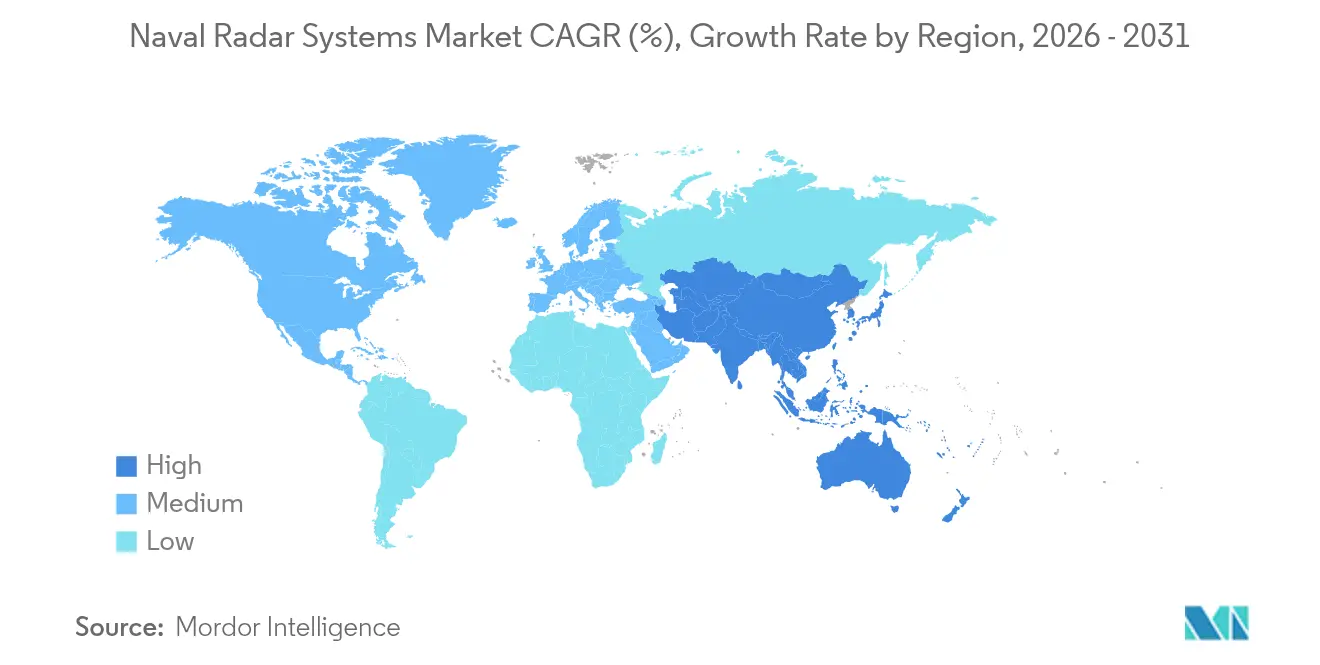
| Fastest Growing Market | Asia Pacific |
| Largest Market | North America |
| Market Concentration | Medium |
Major Players *Disclaimer: Major Players sorted in no particular order Image © Mordor Intelligence. Reuse requires attribution under CC BY 4.0. | |
Naval Radar Systems Market Analysis by Mordor Intelligence
The naval radar systems market size is expected to grow from USD 9.53 billion in 2025 to USD 9.98 billion in 2026 and is forecast to reach USD 12.57 billion by 2031 at 4.72% CAGR over 2026-2031. Sustained demand springs from multi-domain missile threats, a transition from legacy 2-D sensors, and the need for radar electronic warfare (EW) fusion that shortens kill-chain timelines. Falling GaN cost curves, now below USD 4 per watt, enable affordable power-dense transmit-receive modules, helping suppliers preserve margins despite aggressive price negotiations. Modernization funding remains anchored in North America and Europe. Yet, Indo-Pacific surface-fleet growth tilts future volume toward Asia-Pacific, keeping the naval radar systems market on a resilient, mid-single-digit trajectory. Competitive dynamics intensify as primes consolidate RF component supply chains to hedge against gallium export controls while smaller firms use AI-enabled architectures to penetrate emerging unmanned segments.
Key Report Takeaways
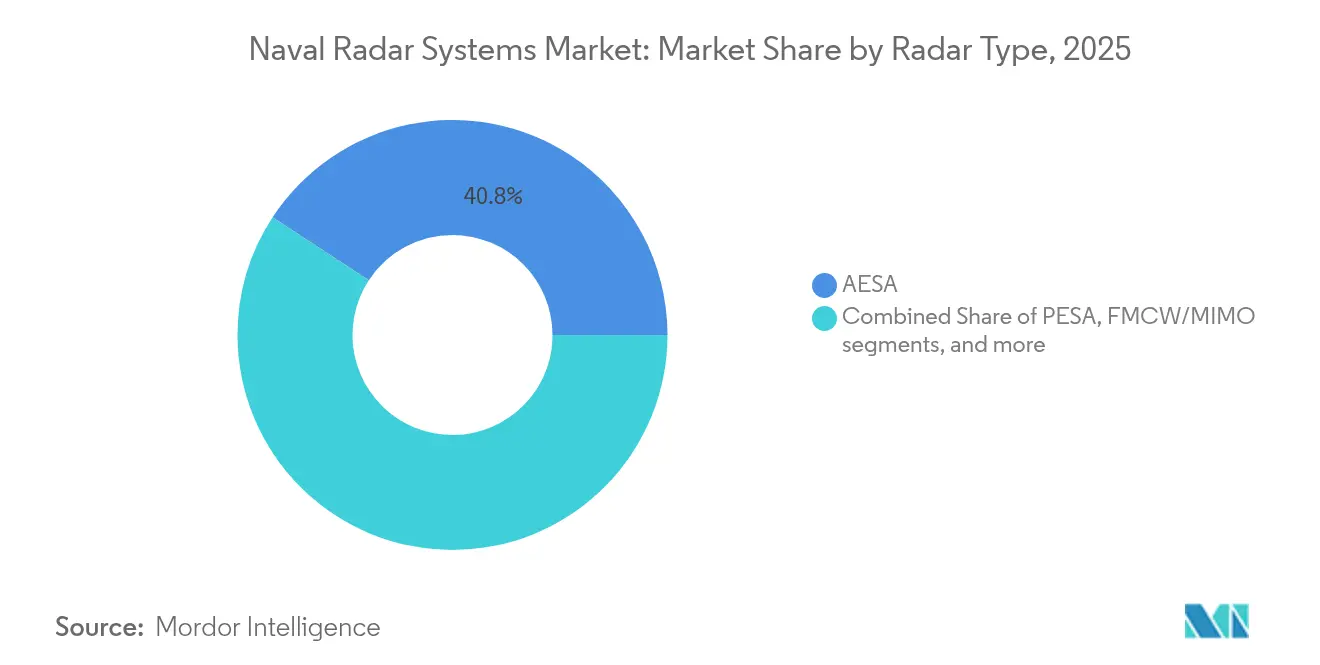
- By radar type, AESA accounted for 40.78% of the naval radar systems market share in 2025, whereas FMCW/MIMO is poised for the fastest 6.55% CAGR through 2031.
- By platform, destroyers and cruisers commanded a 38.74% share of the naval radar systems market in 2025, while unmanned surface and AUV platforms are projected to expand at an 8.12% CAGR.
- By application, surveillance and early-warning held 31.92% share of the naval radar systems market size in 2025; electronic-warfare support is forecasted to grow at 5.62% CAGR.
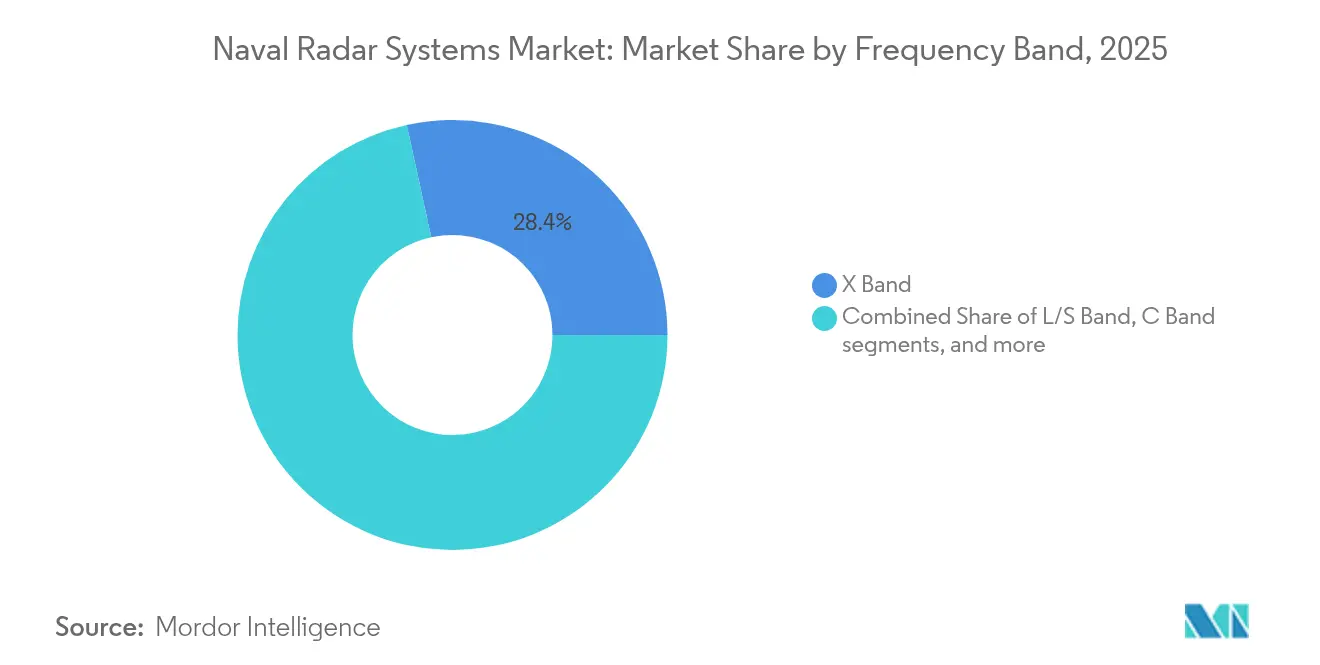
- By frequency band, the X-band remained dominant with a 28.41% share, yet Ku/Ka-band solutions are on track for a 6.52% CAGR.
- By component, antenna and array panels captured a 35.62% share, and transmitters/power amplifiers are set for the quickest 4.65% CAGR.
- By range, short-range systems (less than 50 km) secured a 40.86% share, whereas long-range systems (greater than 200 km) should rise at a 7.42% CAGR.
- By geography, North America retained a 37.21% share of the naval radar systems market in 2025; Asia-Pacific is advancing at an 8.31% regional CAGR.
Note: Market size and forecast figures in this report are generated using Mordor Intelligence’s proprietary estimation framework, updated with the latest available data and insights as of 2026.
Global Naval Radar Systems Market Trends and Insights
Drivers Impact Analysis*
| Driver | ( ~ ) % Impact on CAGR Forecast | Geographic Relevance | Impact Timeline |
|---|---|---|---|
| Escalating multi-domain missile threats | +1.2% | Indo-Pacific and Middle East | Medium term (2-4 years) |
| Modernization cycles from 2-D to AESA | +0.8% | North America and Europe | Long term (≥4 years) |
| Indo-Pacific naval build-up and frigate programs | +0.7% | Asia-Pacific | Medium term (2-4 years) |
| Mandatory radar cross-section management | +0.4% | Global | Long term (≥4 years) |
| GaN cost curve less than USD 4/W | +0.6% | Global | Short term (≤2 years) |
| Integration of radar-EW fusion chips | +0.5% | North America and EU | Medium term (2-4 years) |
| Source: Mordor Intelligence | |||
Escalating Multi-Domain Missile Threats
Shipborne radar requirements changed after sea-skimming, and hypersonic missiles showcased harsh lessons in the Red Sea and overwhelming legacy sensors during saturation raids. The US Navy accelerated SPY-6 back-fit packages beginning in 2026 with a USD 536 million budget to bolster detection windows.[1]Company Release, “SPY-6 Back-Fit Program Accelerated,” Naval News, navalnews.com China’s push toward near-light-speed radar that reveals submarines hundreds of meters below the surface widens the technology gap and presses allies to field agile multi-function arrays. As a result, suppliers are designing software-defined waveforms that concurrently track ballistic, hypersonic, and sea-skimming profiles without mode-switch latency. These converging threats underpin a steady spending cadence inside the naval radar systems market.
Modernization Cycles of Aged 2-D Radars to AESA
Frigates and destroyers commissioned before 2005 are near obsolescence, triggering large-scale AESA retrofits such as Germany’s EUR 200 million (USD 232.42 million) F124 upgrade awarded to Hensoldt and IAI. The Netherlands followed with four air-defense frigates worth EUR 3.5 billion (USD 4.07 billion), embedding active-phased-array suites at the build stage rather than mid-life. South Korea’s Hanwha Systems prototype can concurrently track 4,000 targets, illustrating sovereign technology responses to export limits. Replacement programs increasingly value firmware-driven enhancements that avoid dry-dock structural changes. These dynamics lock in a predictable upgrade backlog supporting the naval radar systems market expansion through 2030.
Indo-Pacific Naval Build-Up and Frigate Programs
Australia committed AUD 50 billion (USD 32.47 billion) to double its surface fleet, lining up multi-year radar procurement arcs that uplift regional demand. Japan’s first SPY-7(V)1 for its Aegis-equipped vessels delivers S-band GaN power with 4,828 km terrestrial reach. The Philippines fielded Mitsubishi Electric FPS-3ME units valued at PHP 5.5 billion (USD 96.76 million) to strengthen maritime domain awareness. Taiwan’s sole-source Raytheon contract further tightens schedules amid rising cross-strait tension. These programs underpin the fastest regional CAGR in the naval radar systems market.
Mandatory Radar Cross-Section Management
Stealth-centric navies now mandate integrated masts and flush sensor mounting, yielding up to 46.46 dBsm arithmetic mean signature reduction versus conventional layouts. Early design involvement between shipyards and radar OEMs uses a shooting-and-bouncing-rays simulation to optimize antenna placement across multi-band threats. The collaboration aligns survivability, sensor performance, and electromagnetic compatibility without retrofit penalties. Consequently, low-observable requirements move from “nice-to-have” to baseline contract specification, sustaining premium pricing power for compliant solutions.
Restraints Impact Analysis*
| Restraint | ( ~ ) % Impact on CAGR Forecast | Geographic Relevance | Impact Timeline |
|---|---|---|---|
| Export-control limits on GaN MMICs | -0.9% | Global | Medium term (2-4 years) |
| Cost overruns driving radar de-scoping | -0.6% | North America and Europe | Short term (≤2 years) |
| Littoral S/X-band spectrum congestion | -0.4% | Coastal regions | Long term (≥4 years) |
| Hull-top weight and power constraints | -0.3% | Global | Medium term (2-4 years) |
| Source: Mordor Intelligence | |||
Export-Control Limits on GaN MMICs
China controls 85% of the primary gallium supply, and recent export curbs elevate procurement risk for Western radars using GaN modules. US export listings further restrict 40–230 GHz devices, complicating co-development with allies.[2]Bureau Release, “Commerce Control List—Category 6,” Bureau of Industry and Security, bis.doc.gov Washington and Brussels sponsor domestic gallium refineries, yet multi-year timelines keep dependency high, inserting delivery uncertainty into several naval radar systems market contracts.
Cost Overruns Driving Radar De-Scoping
The US Navy swapped its Dual Band Radar for Enterprise Air Surveillance Radar on CVN-79, cutting USD 180 million but lowering performance.[3]Sam LaGrone, “Cost-Driven Radar Swap on CVN-79,” USNI News, news.usni.org GAO highlights AN/SPY-6 schedule slips rooted in underestimated software complexity, echoing across allied budgets. Fiscal ceilings force capability trade-offs that dampen near-term revenue for high-end sensors inside the naval radar systems market.
*Our forecasts treat driver/restraint impacts as directional, not additive. The impact forecasts reflect baseline growth, mix effects, and variable interactions.
Segment Analysis
By Radar Type: AESA Dominance Drives Modernization
AESA systems held the largest 40.78% naval radar systems market share in 2025, thanks to robust multi-target tracking and jam-resistant digital beamforming. The naval radar systems market size for FMCW/MIMO radars is projected to expand at 6.55% CAGR through 2031, propelled by demand for software-defined multifunctionality that supports concurrent communications links. Traditional passive electronically scanned arrays (PESA) linger in cost-sensitive upgrades, while quantum and photonic concepts occupy the “Others” category as long-range R&D bets.
Lockheed Martin’s SPY-7 demonstrated persistent tracking for Spain’s F-110 frigate program, with delivery in 2026 and commissioning in 2028. Meanwhile, FMCW solutions migrating from automotive supply chains show favorable volume economics, compressing entry barriers for new vendors. Cross-domain algorithm sharing reduces development cycles, giving navies affordable pathways to plug-and-play waveform libraries that future-proof their fleet sensors.


By Platform: Unmanned Systems Reshape Naval Operations
Destroyers and cruisers accounted for 38.74% of the overall naval radar systems market size in 2025 because fleet air-defense doctrines still center on large combatants. However, unmanned surface and AUV platforms head the growth table with an 8.12% CAGR, reflecting distributed lethality strategies that call for low-signature scouts.
Miniaturized GaN power amplifiers and conformal antennas now satisfy the size, weight, and power (SWaP) envelopes of unmanned hulls, unlocking new procurement layers. Submarine mast radars also advance, enabling periscope-depth situational awareness with minimal exposure. Modular “payload bay” concepts allow common sensor cores to slide between unmanned and manned vessels, lowering integration costs and stoking cross-platform fleet standardization.
By Application: Electronic Warfare Integration Accelerates
Surveillance and early warning maintained a 31.92% share of the naval radar systems market in 2025, remaining indispensable for blue-water command decisions. The naval radar systems market size for electronic-warfare support is on track for a 5.62% CAGR as adversaries flood the spectrum with agile jamming, forcing navies to embed EW receivers within primary radar tiles.
Collins Aerospace’s USD 904 million Cooperative Engagement Capability upgrade stitches AESA radar tracks into secure datalinks, fusing threat libraries across distributed vessels. AI-based classifiers now auto-label emitter fingerprints, cutting operator reaction time. Surveillance, fire-control, and EW codebases converge onto a single back-plane, promising lifecycle cost drops as navies update mission packages via secure patches instead of hull visits.
By Frequency Band: X-Band Leadership Faces Ku/Ka Challenge
X-band radars retained a 28.41% share in 2025 owing to optimal sea-state clutter rejection and mature fire-control algorithms. The naval radar systems market size for Ku/Ka-band systems is projected to broaden at a 6.52% CAGR because high-resolution imaging and SATCOM coexistence drive dual-band procurement.
Dynamic spectrum-sharing research indicates S-band radars can cohabitate with LTE at greater than 50 km separation, but regulatory adoption remains slow. Cognitive radar prototypes using reinforcement learning alter pulse patterns in real time, minimizing mutual interference. Software-defined architectures allow quick band reconfiguration, empowering navies to match emission profiles with mission threat envelopes and sovereign spectrum rules.
By Component: Antenna Innovation Drives Performance
Antenna and array panels cornered 35.62% of 2025 revenue, defining system gain and beam agility. Transmitters and power amplifiers are heading for the highest 4.65% CAGR as GaN parts deliver triple the power density of legacy gallium-arsenide devices.
Modular tile arrays let maintainers swap failed modules dockside, avoiding lengthy depot visits. Photonic front-ends promise wider instantaneous bandwidth yet remain mostly in laboratory validation. Meanwhile, AI-tuned cooling loops lower array junction temperatures by 8 °C, extending mean-time-between-failure and sharpening radar availability metrics across the naval radar systems market.
By Range: Long-Range Systems Lead Growth
Short-range radars under 50 km captured 40.86% of the 2025 demand for navigation, harbor defense, and close-in gun support. Long-range systems over 200 km should advance at 7.42% CAGR as ballistic missile defense (BMD) fleets roll out persistent discrimination radars capable of 360° volumetric tracking.
Distributed power architectures reduce cabling mass in multi-antenna airborne platforms, concepts now migrating to naval topside arrays. Short-range FMCW modes embed inside larger AESA packages, giving commanders a digital “zoom lens” that flexes between local force-protection and theater-wide cueing without hardware swaps.
Geography Analysis
North America led with 37.21% of the naval radar systems market share in 2025, underpinned by the US Navy’s plan to install SPY-6 on 65 surface combatants and to field Enterprise Air Surveillance Radar aboard future carriers. Canada’s selection of SPY-7 for River-class destroyers adds cross-border industrial synergy, while Mexico’s incremental coastal surveillance upgrades leave room for follow-on orders. Robust defense budgets exceeding USD 800 billion provided multiyear funding visibility, enabling OEMs to lock in scale pricing for GaN devices.
Asia-Pacific represents the fastest-growing cluster, expanding at 8.31% CAGR to 2031 as China’s submarine-tracking radar tests accelerate regional procurement urgency. Japan’s USD 41 million indigenous long-range radar program and South Korea’s KDX-II destroyer refits, worth USD 300 million, evidence a strategic tilt toward sovereign sensor ecosystems. Australia’s AUD 50 billion (USD 32.47 billion) fleet expansion and the Philippines’ PHP 5.5 billion (USD 96.76 million) radar import package underscore the region’s broad spending front, cushioning suppliers against order volatility elsewhere.
Europe posts steady gains as NATO cohesion intensifies. Germany’s EUR 200 million (USD 232.42 million) ( F124 upgrade and the Netherlands’ EUR 3.5 billion (USD 4.07 billion) frigate build ensure a rolling backlog. Spain integrates SPY-7 into F-110 hulls, while the Franco-Italian Horizon mid-life overhaul, worth EUR 1.5 billion (USD 1.74 billion), pushes common standards across multiple navies. Eastern Mediterranean tensions nudge Greece toward new air-defense frigates, and Norway eyes enhanced coastal sensors, suggesting a secure medium-term growth lane despite fiscal scrutiny.

Competitive Landscape
The naval radar systems market is moderately concentrated. RTX Corporation, Lockheed Martin Corporation, Thales Group, and Northrop Grumman Corporation collectively account for major revenue, each leveraging vertically integrated semiconductor lines, ship-set integration teams, and in-house signal-processing IP. Their scale affords early access to scarce gallium supplies and the capital required for 200 kW-class GaN amplifier development.
Disruption nevertheless brews at the edges. Echodyne’s metamaterial apertures furnish high-gain dishes at a fraction of legacy cost, enabling small patrol craft to host precision sensors for the first time. Anduril’s 2025 acquisition of Numerica folded Spyglass radar into its AI-centric Lattice platform, showcasing how software-first entrants swallow RF specialists to present turnkey solutions. Meanwhile, Ultra Maritime’s USD 421 million surface-search radar award shows that second-tier players can secure marquee contracts by emphasizing open-architecture compliance.
Strategic themes revolve around control of GaN wafer capacity, sensor-EW convergence, and autonomy-ready designs. Primes cultivate sovereign fabs to alleviate embargo risk. European mid-caps partner on shared aperture demonstrators to win export licenses barred to US ITAR-laden gear. Joint ventures and co-development memoranda of understanding aim to bundle training, digital twin, and lifecycle support, tilting competition toward service-based revenue streams that grow faster than hardware alone within the naval radar systems market.
Naval Radar Systems Industry Leaders
RTX Corporation
Thales Group
Northrop Grumman Corporation
HENSOLDT AG
Lockheed Martin Corporation
- *Disclaimer: Major Players sorted in no particular order


Recent Industry Developments
- June 2025: RTX won a USD 646 million production lot for 18 additional AN/SPY-6(V) radars under a broader USD 3 billion framework, extending deliveries to 2028.
- June 2025: Sweden selected Lockheed Martin TPY-4 with first deliveries in 2027, the third customer for the open-architecture radar.
- June 2025: RTX and Kongsberg introduced GhostEye radar for NASAMS, adding 360° AESA coverage.
- May 2025: Hanwha Systems signed a USD 40 million contract to develop multifunction radar for L-SAM II.


Research Methodology Framework and Report Scope
Market Definitions and Key Coverage
According to Mordor Intelligence, naval radar systems encompass all purpose-built, ship- or submarine-mounted primary radar equipment, antennas, transmitter-receiver modules, wave-guides, signal processors, consoles, and embedded software that provide detection, tracking, navigation, or fire-control functions for commissioned naval platforms across blue-water and littoral theaters. We count factory-fit units and mid-life upgrade kits sold by original equipment makers or prime integrators, valuing them at contract award price.
Scope exclusion: Shore-based coastal surveillance radars, civil marine radars for merchant shipping, and post-warranty maintenance service revenues are excluded.
Segmentation Overview
- By Radar Type
- AESA
- PESA
- FMCW/MIMO
- Others
- By Platform
- Destroyers and Cruisers
- Frigates
- Corvettes and OPVs
- Aircraft Carriers and Amphibious Ships
- Submarines (mast-mounted)
- Unmanned Surface/AUV Platforms
- By Application
- Surveillance and Early Warning
- Missile Guidance/Fire Control
- Navigation and Collision-Avoidance
- Surface Search and Target Tracking
- Weather and Environmental Monitoring
- Electronic Warfare Support
- By Frequency Band
- L/S Band
- C Band
- X Band
- Ku/Ka Band
- By Component
- Transmitter/Power Amplifier
- Receiver/Down-converter
- Antenna/Array Panels
- Other Components
- By Range
- Short (Less than 50 km)
- Medium (50–200 km)
- Long (Greater than 200 km)
- Geography
- North America
- United States
- Canada
- Mexico
- Europe
- United Kingdom
- Germany
- France
- Russia
- Rest of Europe
- Asia-Pacific
- China
- India
- Japan
- South Korea
- Australia
- Taiwan
- Rest of Asia-Pacific
- South America
- Brazil
- Rest of South America
- Middle East and Africa
- Middle East
- Turkey
- Saudi Arabia
- Rest of Middle East
- Africa
- South Africa
- Rest of Africa
- Middle East
- North America
Detailed Research Methodology and Data Validation
Primary Research
We conducted structured interviews and short surveys with naval procurement officers in North America, Europe, and Asia-Pacific, radar design engineers at tier-1 integrators, and defense economists tracking shipbuilding pipelines. Insights from these conversations clarified average sell-price spreads, radar fit-out rates by hull class, and planned retrofit volumes, allowing us to fine-tune assumptions derived from desk research.
Desk Research
Our analysts reviewed open-access, high-credibility sources such as the U.S. Department of Defense budget justification books, Congressional Research Service fleet reports, European Defence Agency defense data, UN Comtrade shipment codes 852610/852691, and annual NATO defense expenditure tables. Select trade association briefs, such as IMDEX Asia papers, company 10-Ks, and investor decks enriched cost benchmarks. For company-level triangulation, we tapped paid dashboards in D&B Hoovers and Global Security. This list is illustrative; many other reputable feeds supported data gathering and cross-checks.
Market-Sizing & Forecasting
The base year pool is first built through a top-down fleet inventory and program-budget reconstruction, multiplying platform counts by verified radar fit factors and contract unit prices. Results are then sense-checked with selective bottom-up snapshots, such as sample supplier roll-ups and channel checks, which are used to align totals. Key model inputs include new-build surface-combatant deliveries, GaN module cost curves, average radar share of total combat-system spend, regional defense-budget growth, and adoption rates of multi-function AESA suites. Forecasts to 2030 employ a multivariate regression that links unit demand to fleet modernization cadence, procurement cycle length, and macro defense-outlay projections, while scenario bands address exchange-rate swings and program delays.
Data Validation & Update Cycle
Before sign-off, outputs pass three levels of analyst review, variance tests versus independent fleet and trade signals, and re-contacts with select interviewees. Reports refresh annually; material program revisions trigger interim updates, and an analyst reruns final checks just prior to client release.
Why Mordor's Naval Radar Systems Baseline Commands Reliability
Published estimates often vary because firms slice the market differently and refresh at different times. Our disciplined scope and annual validation give decision-makers a dependable starting point.
Key gap drivers include whether retrofit kits are counted, if coastal or merchant-marine radars are blended in, currency conversion timing, and how price-erosion trajectories are modeled.
Benchmark comparison
| Market Size | Anonymized source | Primary gap driver |
|---|---|---|
| USD 9.53 B (2025) | Mordor Intelligence | |
| USD 4.64 B (2024) | Global Consultancy A | Excludes retrofits and submarine platforms, counts only new surface-combatant installs |
| USD 5.24 B (2024) | Regional Consultancy B | Omits antenna and power-module sales; mixed spot and average currency rates |
| USD 12.67 B (2024) | Trade Journal C | Bundles coastal surveillance and merchant-fleet radars, inflating addressable market |
Taken together, the comparison shows why Mordor's carefully bounded definition, price-validated inputs, and annual refresh cadence yield a balanced figure that buyers can trace back to clear variables and repeatable steps.


Key Questions Answered in the Report
What is the current size of the naval radar systems market?
The naval radar systems market generated USD 9.98 billion in 2026 and is projected to reach USD 12.57 billion by 2031, advancing at a 4.72% CAGR.
Which radar type leads adoption today?
AESA radars hold the largest 40.78% share, reflecting their superior multi-target and EW resilience capabilities.
Which region is growing fastest for naval radar procurements?
Asia-Pacific is expanding at 8.31% CAGR, spurred by Indo-Pacific surface-fleet expansion and frigate modernization programs.
How are export controls affecting suppliers?
Restrictions on GaN MMIC exports and China’s dominance in gallium supply introduce schedule risk and spur investment in domestic semiconductor capacity.
What platform segment shows the highest growth potential?
Unmanned surface and autonomous underwater vehicles are forecast to grow at 8.12% CAGR as navies adopt distributed sensor architectures.
Who are the major players in this industry?
RTX Corporation, Lockheed Martin Corporation, Thales Group, and Northrop Grumman Corporation collectively hold a major market share, with emerging competition from firms like Echodyne and Anduril.
Page last updated on:


