Substation Automation Market Size and Share
Market Overview
| Study Period | 2020 - 2031 |
|---|---|
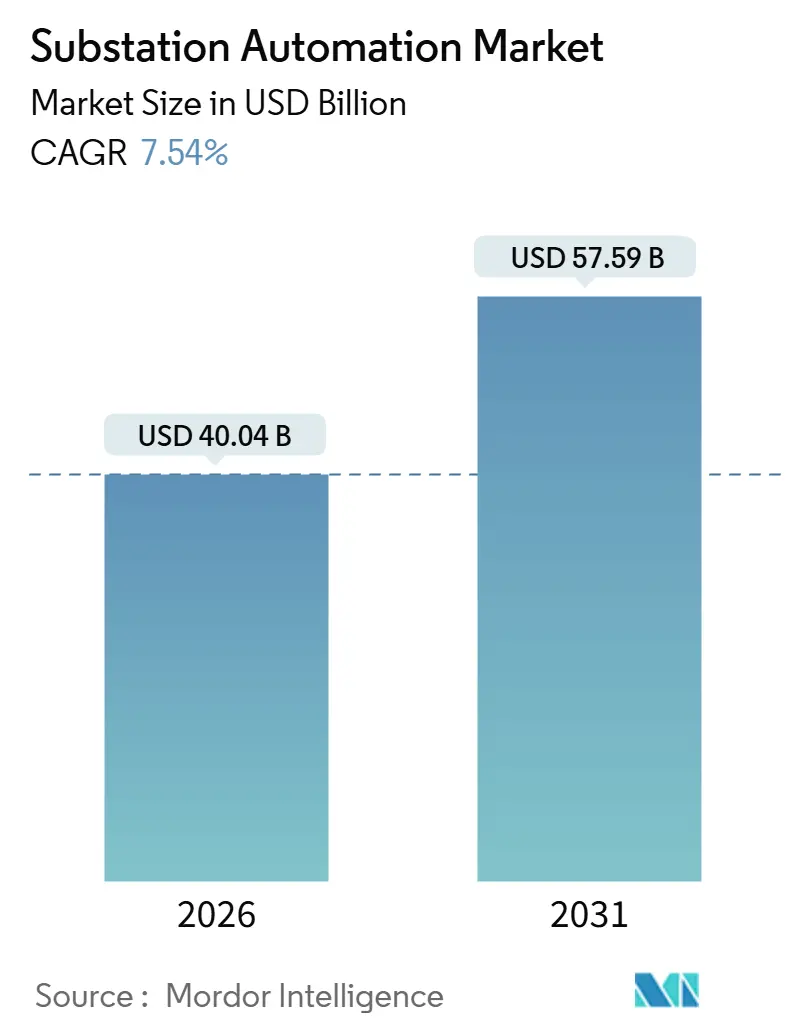
| Market Size (2026) | USD 40.04 Billion |
| Market Size (2031) | USD 57.59 Billion |
| Growth Rate (2026 - 2031) | 7.54% CAGR |
| Fastest Growing Market | Asia Pacific |
| Largest Market | North America |
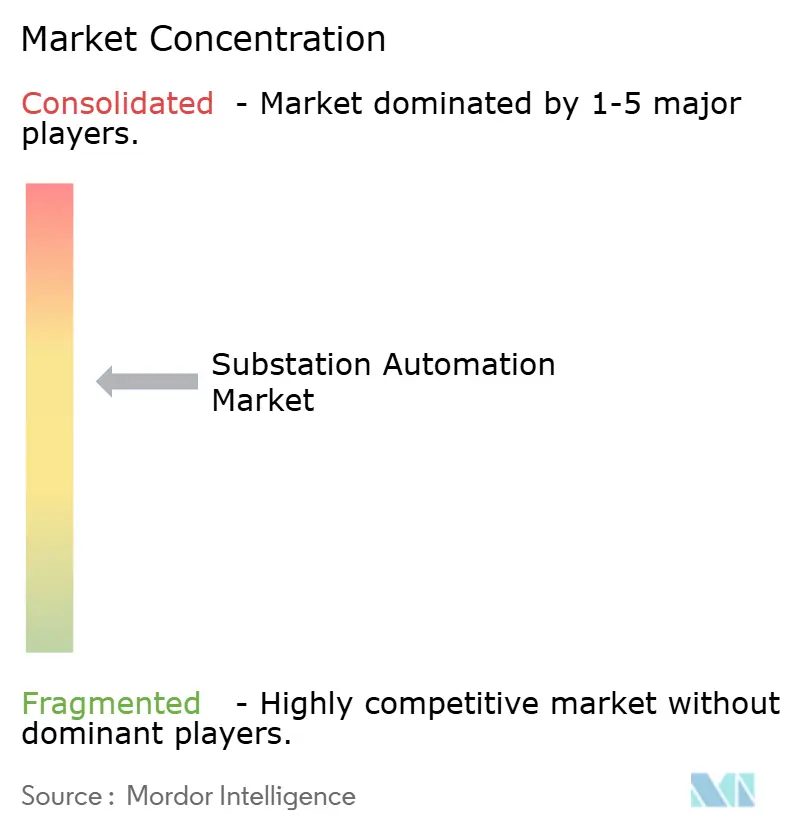
| Market Concentration | Medium |
Major Players *Disclaimer: Major Players sorted in no particular order Image © Mordor Intelligence. Reuse requires attribution under CC BY 4.0. | |
Substation Automation Market Analysis by Mordor Intelligence
The substation automation market size stood at USD 40.04 billion in 2026 and is projected to reach USD 57.59 billion by 2031, advancing at a 7.54% CAGR. Demand is accelerating as aging transformers exceed 40 years of service, compelling North American and European utilities to digitize protection schemes ahead of stricter reliability deadlines. Cloud-native supervisory control and data acquisition (SCADA) platforms are replacing on-premise servers, allowing real-time analytics that reduce false trips and extend maintenance intervals. Private LTE and 5G backhaul are being layered on top of deterministic Ethernet rings to build spectrum-independent redundancy for critical protection traffic. Meanwhile, hyperscale data center operators specify sub-cycle fault detection and automated load shedding in new substations to preserve 99.995% uptime, boosting supplier pipelines across every continent.
Key Report Takeaways
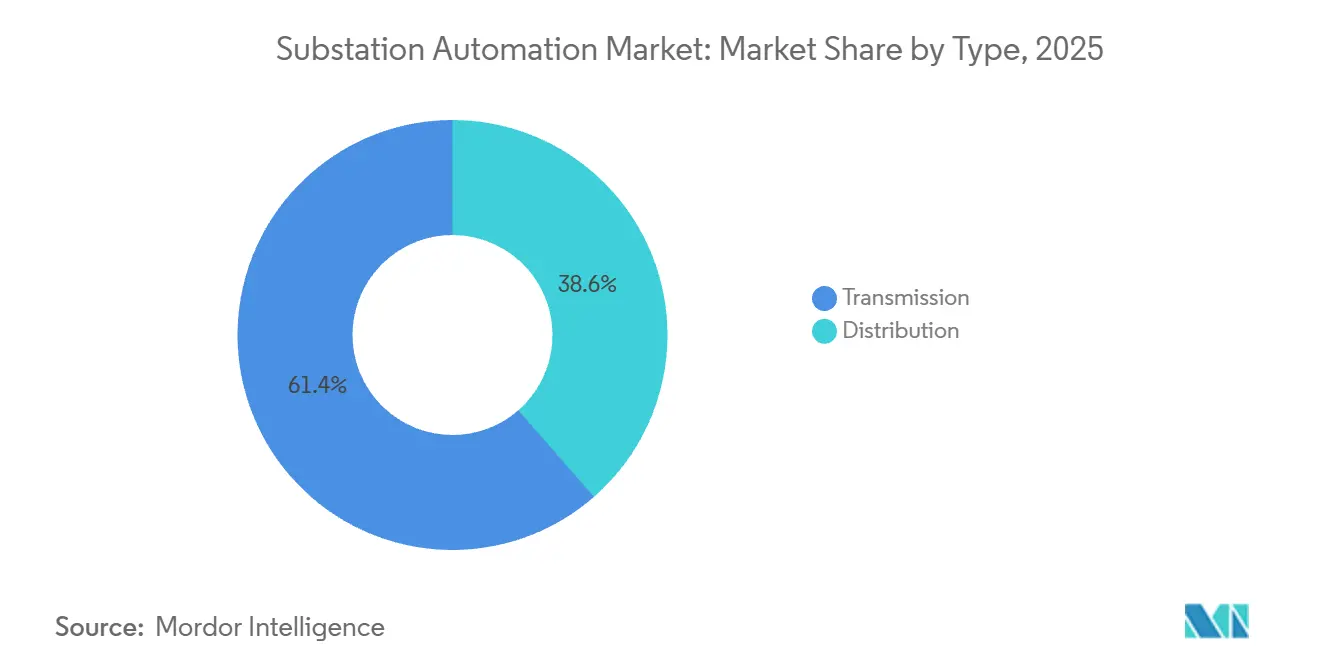
- By type, transmission substations led with 61.43% revenue share in 2025; distribution automation is forecast to expand at an 8.91% CAGR to 2031.
- By module, intelligent electronic devices secured 45.31% of the substation automation market share in 2025, while SCADA is expected to post the fastest 9.46% CAGR through 2031.
- By communication technology, wired Ethernet commanded 68.91% of deployments in 2025, yet private LTE and 5G links are advancing at an 8.14% CAGR over the forecast period.
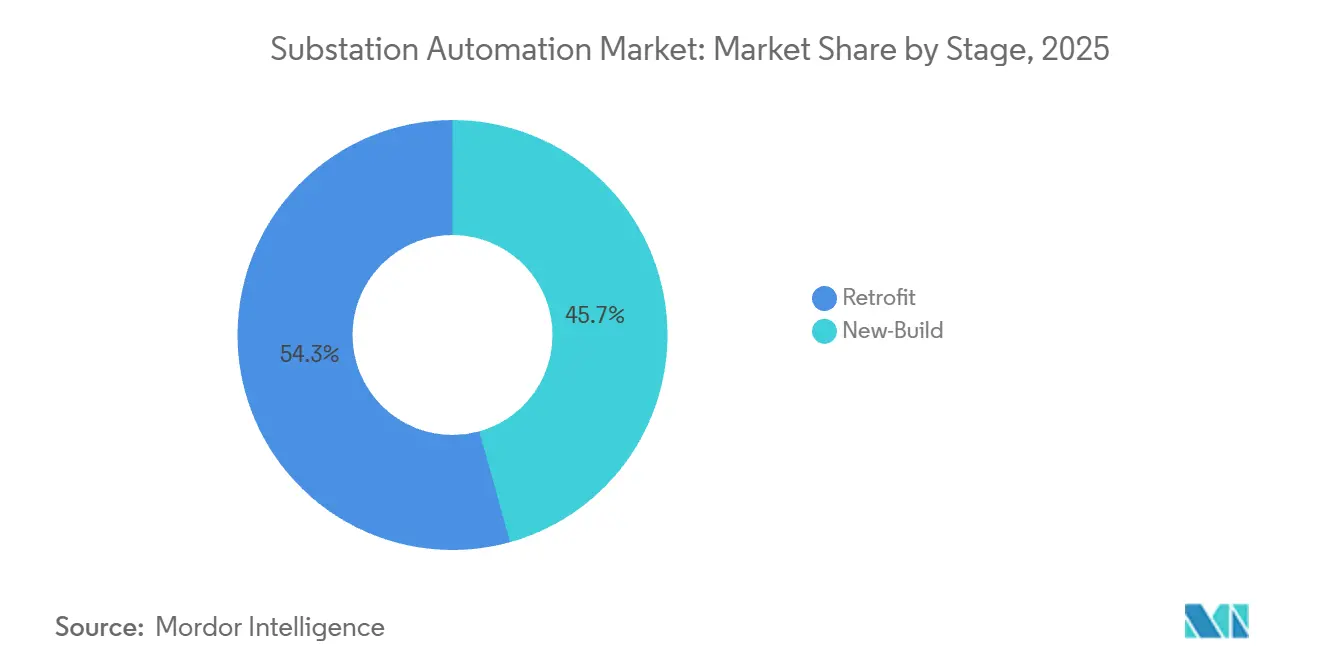
- By stage, retrofit projects accounted for 54.32% of the substation automation market size in 2025 and new-build installations are projected to grow at a 9.63% CAGR to 2031.
- By end user, utilities held 72.43% share in 2025, while mining operations are poised for a 9.11% CAGR through 2031.
- By geography, North America dominated with 34.12% of the 2025 base, while Asia-Pacific is on track for the fastest expansion, registering a 9.73% CAGR during the outlook period.
Note: Market size and forecast figures in this report are generated using Mordor Intelligence’s proprietary estimation framework, updated with the latest available data and insights as of January 2026.
Global Substation Automation Market Trends and Insights
Drivers Impact Analysis*
| Driver | (~) % Impact on CAGR Forecast | Geographic Relevance | Impact Timeline |
|---|---|---|---|
| Aging Grid-Infrastructure Replacement Cycle Accelerates | +1.8% | North America and Europe, spillover to Australia and New Zealand | Medium term (2-4 years) |
| Renewable-Energy Integration Needs Advanced Control | +1.5% | Global, peak in Europe, China, India and California | Long term (≥ 4 years) |
| Mandatory Reliability and Smart-Grid Regulations | +1.3% | North America, Europe, China | Short term (≤ 2 years) |
| Rapid Cost and Performance Gains in IED and Analytics | +1.2% | Global early adopters in North America, Germany, Japan, South Korea | Medium term (2-4 years) |
| Data-Center Load Boom Triggers Digital Substation Roll-outs | +1.0% | North America, Europe, Singapore, Australia, emerging India and Middle East | Short term (≤ 2 years) |
| Virtualized PAC and SaaS-Based Operations and Maintenance Models | +0.7% | North America and Europe, pilots in ASEAN and Middle East | Long term (≥ 4 years) |
| Source: Mordor Intelligence | |||


Aging Grid-Infrastructure Replacement Cycle Accelerates
More than 60% of power transformers in the United States have surpassed their 40-year design life, prompting utilities to favor IEC 61850 retrofits that cut commissioning time by up to 40%. European transmission system operators are leveraging Connecting Europe Facility grants to upgrade substations with phasor measurement units, enabling real-time congestion management and deferring costly line construction. Australian regulators now require IEC 61850 Edition 2 compliance for new installations above 66 kV, compressing vendor selection timelines across the national grid. Transformer lead times have doubled to 24 months because of grain-oriented electrical steel shortages, making retrofit projects the fastest avenue to reliability gains. As a result, utilities are diverting capital from like-for-like replacements toward digital overlays that extend asset life without waiting for new hardware deliveries.
Renewable-Energy Integration Needs Advanced Control
Wind and solar resources introduce sub-second voltage swings that legacy relays cannot address, so grid operators are deploying intelligent electronic devices with model-predictive algorithms for fast frequency response.[1] International Energy Agency, “Renewables 2025,” iea.org Global renewable additions reached 510 GW in 2025, and grid-connected batteries passed 100 GW, amplifying the need for automated charge-discharge coordination at the substation level. Germany now mandates automated voltage regulation on substations serving renewable clusters above 10 MW by 2026, accelerating investment in static VAR compensators integrated with IEC 61850 gateways. China State Grid has rolled out more than 8,000 digital substations across its ultra-high-voltage backbone, using AI-driven fault prediction to cut unplanned outages by 25%. India’s new standards for 220 kV and above require sampled-value process buses, shrinking substation footprints by up to 40%. Collectively, these mandates channel fresh spending into advanced control schemes that support high-penetration renewables.
Mandatory Reliability and Smart-Grid Regulations
Federal Energy Regulatory Commission Order 881 obliges U.S. utilities to detect and clear faults tied to inverter-based resources within three cycles, driving adoption of responsive protection algorithms. North American Electric Reliability Corporation CIP-013 extends cybersecurity requirements to the hardware supply chain, adding USD 50,000-USD 150,000 in compliance expense per substation. Europe’s Network Code on Demand Connection forces large industrial customers to enable sub-200 millisecond load shedding, prompting widespread installation of bay control units that can receive grid-operator commands. South Korea’s latest grid code compels substations above 154 kV to integrate distributed-energy-resource management systems before 2027, nudging utilities toward RESTful application programming interfaces and publish-subscribe messaging. These overlapping rules shorten refresh cycles from two decades to less than a decade and keep the substation automation market firmly in growth mode.
Rapid Cost and Performance Gains in IED and Analytics
Average intelligent electronic device prices fell almost 35% between 2020 and 2025 as suppliers shifted from proprietary ASICs to commercial off-the-shelf processors, widening accessibility for mid-tier utilities. Edge-computing modules now run machine-learning models locally, eliminating the need to stream terabytes of waveform data to the cloud for analysis. Siemens reported that its GridEdge platform cut false trips by 60% through adaptive settings that respond to topology changes in real time. ABB integrated substation data with enterprise resource planning through its Ability Ellipse suite, lowering unplanned outages by 18% across pilots in North America and Europe. The combination of cheaper hardware and real-time analytics unlocks an operational-expenditure payback story, not merely a compliance narrative, for every new deployment.
Restraints Impact Analysis*
| Restraint | (~) % Impact on CAGR Forecast | Geographic Relevance | Impact Timeline |
|---|---|---|---|
| High CAPEX and Integration Complexity | -1.1% | Global, most acute in emerging markets and smaller municipal utilities | Short term (≤ 2 years) |
| Escalating Cybersecurity Compliance Costs | -0.9% | North America, Europe, Australia | Medium term (2-4 years) |
| Supply-Chain Pinch in Grain-Oriented Electrical Steel | -0.6% | Global, peak constraints in North America and Europe | Short term (≤ 2 years) |
| Scarcity of IEC-61850-Skilled Engineers | -0.5% | Global, most severe in North America, Europe and Australia | Long term (≥ 4 years) |
| Source: Mordor Intelligence | |||
High CAPEX and Integration Complexity
Retrofits cost USD 500,000-USD 5 million per site, and integration often surpasses hardware expense because proprietary protocols must interoperate with IEC 61850.[2]Edison Electric Institute, “Utility Capital Investment Survey 2025,” eei.org Small municipal utilities allocate under 8% of capital budgets to digital infrastructure, roughly half the share set aside by large investor-owned peers. Multi-vendor environments demand custom gateways that raise latency and create single points of failure, driving caution among risk-averse operators. A 2025 utility survey ranked integration risk ahead of cybersecurity and workforce readiness as the primary roadblock to faster adoption. Engineering firms now offer prefab panels that trim on-site commissioning from eight weeks to three, but uptake remains concentrated among well-capitalized utilities.
Escalating Cybersecurity Compliance Costs
NERC CIP-013 supply-chain rules require firmware integrity checks, software bills of materials and network segmentation, adding USD 30,000-USD 80,000 in annual operating expense per substation. Europe’s NIS2 Directive mandates incident reporting within 24 hours and demands end-to-end encryption across substation links, pushing utilities toward hardware security modules that lift per-device pricing by up to a quarter. Australia’s Security of Critical Infrastructure Act requires yearly penetration testing and isolation of operational technology, layering additional cost and governance overhead. Firmware updates for intelligent electronic devices now arrive quarterly rather than annually, multiplying lifecycle management tasks. Insurance underwriters increasingly demand IEC 62351 compliance as a prerequisite for grid-resilience coverage, reinforcing the cost headwind.
*Our forecasts treat driver/restraint impacts as directional, not additive. The impact forecasts reflect baseline growth, mix effects, and variable interactions.
Segment Analysis
By Type: Transmission Backbone Anchors Spending, Distribution Gains Momentum
Transmission projects captured 61.43% of 2025 revenue as utilities fortified ultra-high-voltage corridors with phasor measurement units, dynamic line-rating sensors and wide-area protection. Distribution automation, however, is adding the most incremental value, expanding at an 8.91% CAGR through 2031 as advanced metering and feeder automation mitigate bidirectional flows from rooftop solar and community batteries. IEC 61850-90-5 allows sampled values to ride wide-area networks without dedicated fiber, making transmission upgrades practical even in remote areas.
Resilience demands push utilities to adopt self-healing algorithms that reclose or reroute feeders within seconds, shrinking customer-average interruption duration by nearly half in recent California and Texas pilots. Transmission operators are also synthesizing modular multilevel converters into high-voltage direct-current links, embedding digital control as an integral feature. As CAPEX migrates from passive steel and copper toward active electronics, the substation automation market continues to shift from pure-play protection toward integrated grid-optimization.

By Module: IED Dominance Persists, SCADA Modernization Accelerates
Intelligent electronic devices retained a 45.31% revenue lead in 2025, underpinning every protection and measurement function across the voltage spectrum. SCADA platforms, though smaller today, are growing 9.46% per year by evolving into containerized microservices that let utilities spin up analytics on demand in public or private clouds. The substation automation market size attached to SCADA upgrades is widening because virtual instances replace specialized hardware in secondary control rooms.
Multifunctional devices now bundle remote terminal unit, bay controller and gateway roles, lowering spares and easing training requirements. Schneider Electric’s software-defined relay updates travel over the air, reducing technicians’ site visits by roughly 70% across the asset life. Hitachi Energy’s Lumada suite converges SCADA feeds with weather and asset health predictions, cutting unplanned downtime by more than one-fifth. As software assumes an ever-larger share of value, suppliers that own scalable platforms are positioned to capture recurring revenue from subscription analytics.
By Communication Technology: Ethernet Leads, Wireless Gains Traction for Redundancy
Deterministic Ethernet accounted for 68.91% of substation links in 2025 thanks to predictable latency and immunity to radio-frequency interference. Yet private LTE and 5G are advancing at an 8.14% CAGR as network slicing now guarantees sub-10 millisecond delays for grid-control traffic, meeting the stringent requirements of modern protection schemes. Fiber-optic process buses replace hundreds of copper conductors, cutting installation labor in half and delivering 4 kHz sampled-value streams that pinpoint faults within 100 m on 300 km transmission lines.[3]IEEE Power and Energy Society, “Distribution Automation Best Practices,” ieee.org
Wi-SUN mesh networks flourish in distribution feeders where extensive fiber builds would be cost-prohibitive. The alliance has certified more than 200 device models, ensuring multi-vendor interoperability. Power-line communication remains niche but proves useful for temporary circuits during commissioning. Meanwhile, time-sensitive networking embedded in industrial switches from Cisco and Rockwell enables converged IP networks that move protection, control and enterprise traffic over a single fabric with deterministic quality of service.
By Stage: Retrofit Projects Dominate Near-Term, New-Build Gains Long-Term Share
Retrofit programs comprised 54.32% of total revenue in 2025 as utilities sought to stretch aging assets amid 18-month transformer lead times and to tap incentive funds earmarked for grid resilience. New-build installations, though smaller today, will climb at a 9.63% CAGR through 2031, propelled by hyperscale data centers, green-hydrogen electrolyzers, and electric-vehicle gigafactories that demand bespoke high-voltage feeds with digital protection. A brownfield-first strategy persists for critical loads such as hospitals, where outage costs surpass USD 10,000 per minute.
Modular panels pre-assembled in factories blur the retrofit-versus-new-build divide by enabling fast swaps during scheduled outages. General Electric validated this approach in 2025 when a North American utility cut engineering hours by 60% and halved program duration using standardized hardware templates. Greenfield substations for data centers now specify IEC 61850 Edition 2.1, embedding cybersecurity and predictive maintenance from day one, raising the technological baseline for the broader substation automation market.
By End User: Utilities Anchor Demand, Mining Emerges as High-Growth Vertical
Utilities owned 72.43% of end-user revenue in 2025 as regulators, aging assets and renewable complexity converged to make automation non-negotiable. Mining, however, represents the fastest-moving industrial segment with a 9.11% CAGR because autonomous haulage, electric shovels and high-frequency grinders require voltage precision better than ±5%. Petrochemical, metals and oil-and-gas operators follow closely, blending onsite cogeneration with grid imports via bay control units to trim demand charges that swallow up to a quarter of monthly power bills.
Transportation agencies deploy fiber rings and Wi-SUN meshes at rail traction substations to balance loads in real time across electrified corridors, integrating substation data into asset performance management dashboards. Data-center developers demand N+2 redundancy with automatic failover within 50 milliseconds, and airports retrofit existing substations to support electric ground support equipment and shore-power docks. Together these verticals establish a durable undercurrent of growth that complements core utility spending.
Geography Analysis
North America contributed 34.12% of global revenue in 2025 after the Infrastructure Investment and Jobs Act set aside USD 65 billion for grid modernization, and FERC Order 881 tightened ride-through standards for inverter-based resources. The Electric Reliability Council of Texas said 78% of new wind and solar projects above 50 MW required advanced protection, accelerating retrofits across its footprint. Canada’s system operator now obliges substations above 115 kV to accept distributed-energy-resource commands, fueling upgrades in Ontario and Alberta. Mexico’s utility has embarked on a five-year plan to digitize 320 substations and cut unplanned outages by 30% before 2029.
Asia-Pacific is the fastest-growing region at 9.73% CAGR through 2031. China State Grid has already deployed more than 8,000 digital substations across its ultra-high-voltage network. India’s Power Grid Corporation will automate 450 sites under the Green Energy Corridor program, locking in large orders for protection and control devices. Japan requires substations above 154 kV to accommodate distributed-energy-resource systems by 2027, while South Korea is spending USD 1.2 billion on upgrades at facilities serving semiconductor fabs and battery plants. ASEAN members tap Asian Development Bank financing to establish cross-border interconnections that rely on IEC 61850 compliance for interoperability.[4]Asian Development Bank, “ASEAN Power Grid Integration,” adb.org
Europe maintains steady investment through the Connecting Europe Facility, which co-funded 42 transmission projects worth EUR 3.8 billion (USD 4.1 billion) in 2025. Germany requires substations feeding renewable clusters above 10 MW to install automated voltage control by 2026, while the United Kingdom allocates GBP 1.5 billion (USD 1.9 billion) for 180 digital upgrades that shore up offshore-wind integration. Middle Eastern utilities digitize substations to manage summer cooling peaks above 70 GW, and World Bank programs seed pilots in Kenya, Ghana and Senegal.


Competitive Landscape
Revenue concentration is moderate, with ABB, Siemens, Schneider Electric, Hitachi Energy, and General Electric controlling roughly 55% of global sales in 2025. These incumbents protect their installed bases through multi-year service contracts that bundle firmware, cybersecurity monitoring, and predictive analytics, yet software-as-a-service models are pressuring margins by shifting spend from capital to operating budgets. Asian challengers NR Electric and CG Power sell IEC 61850 relays at up to 50% lower prices, obliging Western firms to open low-cost plants in India, Vietnam, and Mexico.
The innovation frontier is virtualized protection, in which utilities run relay logic on commercial-off-the-shelf servers. ABB partnered with Microsoft Azure in 2025 to launch a cloud-native platform that enables municipal utilities to avoid capital outlays for on-premises SCADA. Siemens Energy is expanding its Nuremberg factory to produce 2,000 bay-control units per year, embedding AI-based quality checks in a carbon-neutral plant. Hitachi Energy secured a multiyear contract in India to automate 85 transmission substations, integrating phasor measurement and dynamic line rating into a single project scope.
Schweitzer Engineering Laboratories offers sub-1 millisecond synchrophasor relays for wide-area schemes, while Beckwith Electric focuses on arc-flash mitigation in industrial networks. Cisco and Rockwell compete on the communications layer by embedding time-sensitive networking in ruggedized switches. Patent grants in sampled-value compression and AI-based fault classification rose to 127 in 2025, signaling intensifying research and development. Rising NERC CIP-013 and IEC 62351 compliance thresholds raise the bar for new entrants yet also create acquisition targets for incumbents seeking embedded cybersecurity expertise.
Substation Automation Industry Leaders
ABB Limited
Hitachi Energy Ltd
Siemens AG
Schneider Electric SE
General Electric Co.
- *Disclaimer: Major Players sorted in no particular order

Recent Industry Developments
- December 2025: Siemens Energy announced a USD 450 million expansion of its digital substation factory in Nuremberg, aiming for 2,000 bay-control units per year by 2027.
- November 2025: Hitachi Energy won a USD 320 million order from India’s Power Grid Corporation for digital automation across 85 transmission substations.
- October 2025: ABB and Microsoft launched a cloud-native protection platform that executes relay logic on Azure edge nodes.
- September 2025: Schneider Electric released EcoStruxure Grid Advisor, enabling over-the-air relay setting updates and cutting site visits by 70%.


Research Methodology Framework and Report Scope
Market Definitions and Key Coverage
Our study defines the substation automation market as every hardware, firmware, and supervisory software package installed inside high, medium, or low-voltage substations that enables remote measurement, protection, control, and data exchange through networked intelligent electronic devices (IEDs), bay controllers, RTUs, SCADA hosts, and secure communication links. According to Mordor Intelligence, the 2025 baseline values only reflect revenue earned from new-build or retrofit automation packages; pure civil works, conventional switchgear sold without digital interfaces, and post-meter distribution management tools are out of scope.
Scope exclusion: manual substations that lack IP-addressable control equipment are not counted.
Segmentation Overview
- By Type
- Transmission
- Distribution
- By Module
- Intelligent Electronic Devices (IED)
- Remote Terminal Unit (RTU)
- Bay Control Unit (BCU)
- Supervisory Control and Data Acquisition (SCADA)
- By Communication Technology
- Wired
- Fiber-Optic
- Ethernet
- Power-Line
- Wireless
- Private-LTE / 5G
- Wi-SUN / Mesh RF
- Wired
- By Stage
- Retrofit
- New-Build
- By End User
- Utilities
- Industrial (Oil and Gas, Metals, Mining, Petro-Chem)
- Transportation (Rail, Airports, Ports)
- Data Centres and Cloud Campuses
- By Geography
- North America
- United States
- Canada
- Mexico
- Europe
- Germany
- United Kingdom
- France
- Italy
- Spain
- Russia
- Rest of Europe
- Asia Pacific
- China
- Japan
- India
- South Korea
- ASEAN
- Australia and New Zealand
- Rest of Asia Pacific
- South America
- Brazil
- Argentina
- Rest of South America
- Middle East
- Saudi Arabia
- UAE
- Turkey
- Rest of Middle East
- Africa
- South Africa
- Nigeria
- Rest of Africa
- North America
Detailed Research Methodology and Data Validation
Primary Research
Mordor analysts interviewed grid-planning engineers, relay panel integrators, and digital-substation program managers across North America, Europe, Gulf Cooperation Council, India, and ASEAN. These discussions clarified live penetration rates of retrofit programs, typical wireless versus wired choices, and the pace of price erosion that secondary sources cannot quantify. Insights were triangulated with short surveys sent to independent protection consultants and component distributors.
Desk Research
We began by extracting historic grid expansion and refurbishment spending from tier-1 public sources such as the International Energy Agency, United States Energy Information Administration, Eurostat, and national transmission operator investment plans, which gave us grounded volumes for transformer bays and retrofit cycles. Utility tariff filings, IEEE and IEC working papers, and customs trade codes for IEDs were then mined to benchmark average selling prices. Company 10-Ks, investor decks, and dispatches captured through Dow Jones Factiva and D&B Hoovers supplied vendor mix and margin patterns. This list is illustrative; many additional open datasets and paid archives were reviewed to reinforce data validity.
Market-Sizing & Forecasting
A top-down production and trade reconstruction of substation counts, feeder additions, and refurbishment budgets set the demand pool, which is subsequently validated through selective bottom-up supplier roll-ups and channel checks. Key variables like annual kilometers of new transmission lines, renewable capacity additions, average IED price curves, utility cap-ex approval cycles, and regional cybersecurity mandates drive the model. Forecasts to 2030 are generated through multivariate regression blended with scenario analysis for energy transition speed, and gap areas in the roll-ups are plugged using normalized ASP times volume proxies confirmed in primary calls.
Data Validation & Update Cycle
Before sign-off, results pass anomaly screens, senior analyst peer review, and variance checks against independent grid reliability indices. Reports refresh each year; should material policy shifts or supply shocks appear, we re-contact key respondents and push an interim update so clients always receive our latest view.
Why Mordor's Substation Automation Baseline Commands Reliability
Published estimates rarely align because firms choose unlike scopes, divergent price assumptions, or slower refresh rhythms. By locking our definition to network-ready equipment only, employing live ASP curves, and refreshing annually, we give decision-makers a steadier anchor.
Benchmark comparison
| Market Size | Anonymized source | Primary gap driver |
|---|---|---|
| USD 37.2 Bn (2025) | Mordor Intelligence | - |
| USD 47.8 Bn (2024) | Global Consultancy A | Bundles turnkey EPC work and passive switchgear; uses list prices |
| USD 46.6 Bn (2024) | Industry Journal B | Applies fixed 6% annual price uplift and limited primary interviews |
| USD 36.8 Bn (2024) | Research Boutique C | Excludes retrofit labor savings, applying conservative retrofit counts |
The comparison shows that larger numbers often stem from broader scopes or unverified mark-ups, while smaller totals miss retrofit value. Mordor's disciplined, variable-driven model strikes a balanced, transparent midpoint clients can track and replicate with confidence.


Key Questions Answered in the Report
What is the current value of the substation automation market?
It reached USD 40.04 billion in 2026 and is forecast to grow to USD 57.59 billion by 2031.
Which application area is expanding fastest?
Distribution automation is advancing at an 8.91% CAGR as utilities digitize last-mile grids to host rooftop solar, batteries and electric-vehicle chargers.
Why are utilities prioritizing retrofits over new build?
Transformer lead times now approach two years, so digital overlays on existing yards provide quicker reliability gains while extending asset life.
How are cybersecurity rules influencing purchasing decisions?
NERC CIP-013 and Europe’s NIS2 mandate firmware integrity checks, network segmentation and rapid incident reporting, adding USD 30,000-USD 80,000 in annual costs per substation and steering buyers toward equipment with baked-in security features.
Which regions will deliver the strongest growth through 2031?
Asia-Pacific, led by China, India, Japan and South Korea, is projected to post a 9.73% CAGR as ultra-high-voltage lines and renewable corridors roll out.
What technology shift should vendors watch?
Virtualized protection and control software that runs on commercial off-the-shelf servers threatens hardware margins but opens subscription revenue opportunities for advanced analytics.
Page last updated on:


