Electric Power Distribution Automation Systems Market Size and Share
Market Overview
| Study Period | 2020 - 2031 |
|---|---|
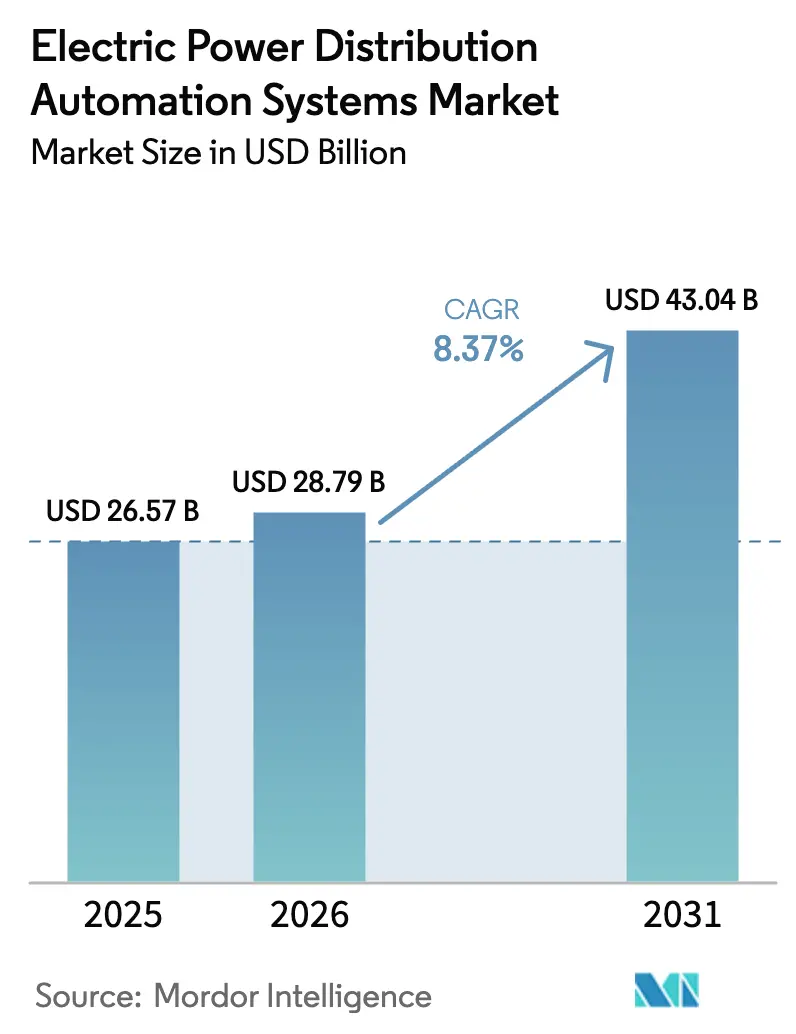
| Market Size (2026) | USD 28.79 Billion |
| Market Size (2031) | USD 43.04 Billion |
| Growth Rate (2026 - 2031) | 8.37% CAGR |
| Fastest Growing Market | Asia Pacific |
| Largest Market | Asia Pacific |
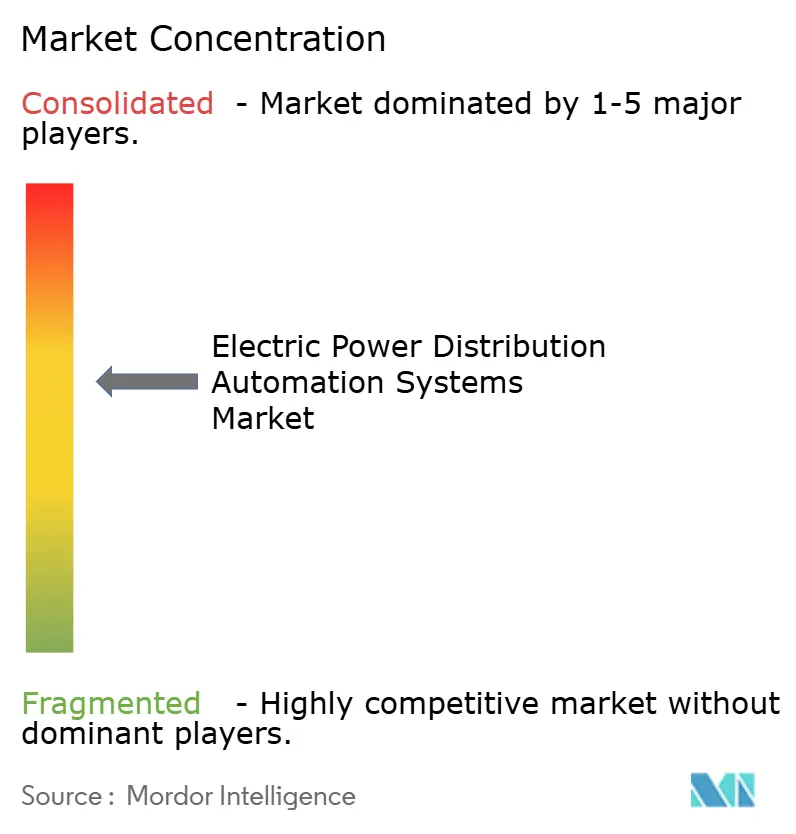
| Market Concentration | Medium |
Major Players *Disclaimer: Major Players sorted in no particular order Image © Mordor Intelligence. Reuse requires attribution under CC BY 4.0. | |
Electric Power Distribution Automation Systems Market Analysis by Mordor Intelligence
The electric power distribution automation systems market size in 2026 is estimated at USD 28.79 billion, growing from 2025 value of USD 26.57 billion with 2031 projections showing USD 43.04 billion, growing at 8.37% CAGR over 2026-2031. Persistent regulatory backing, accelerated grid-modernization timetables, and mounting distributed-energy resource (DER) interconnection requests have been the principal catalysts behind this expansion of the electric power distribution automation systems market. Utilities secured regulatory approval for 78% of proposed modernization investments in 2024, signaling a decisive shift toward performance-based ratemaking that rewards reliability and customer-centric metrics. Asia-Pacific retained volumetric leadership, contributing 46.7% of global revenue in 2024, aided by World Bank-financed projects and large-scale deployments in Thailand, Brazil, and Peru that showcase edge-intelligence functionality. [1]World Bank Energy Practice, “Smart Grids Initiative Supporting 20 Projects Across 19 Countries,” worldbank.org Meanwhile, software-defined architectures—particularly advanced distribution management systems (ADMS)—captured heightened utility interest, growing at 13.5% while reducing SAIDI/SAIFI indices by 25-30% in early pilots. Supply-chain stress around transformers and power semiconductors elongated lead times, yet federal resilience grants, such as the USD 5.7 billion GRIP allocation for 65 modernization projects, continued to offset such headwinds.
Key Report Takeaways
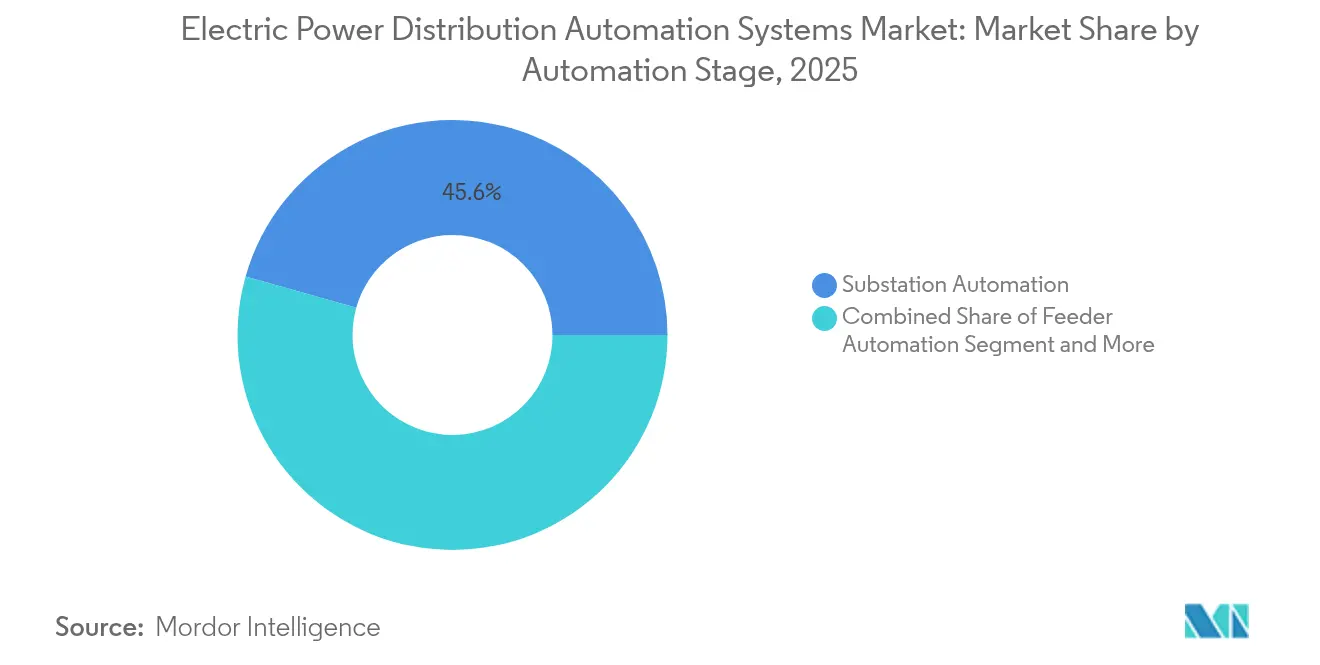
- By automation stage, substation automation led with 45.62% of electric power distribution automation systems market share in 2025, whereas consumer-side automation is set to expand at a 13.62% CAGR through 2031.
- By component, field devices accounted for 48.77% share of the electric power distribution automation systems market size in 2025; the software segment is projected to grow at 13.06% CAGR between 2026-2031.
- By communication technology, wired networks retained 59.82% share of the electric power distribution automation systems market size in 2025, while wireless solutions are forecast to post a 14.11% CAGR to 2031.
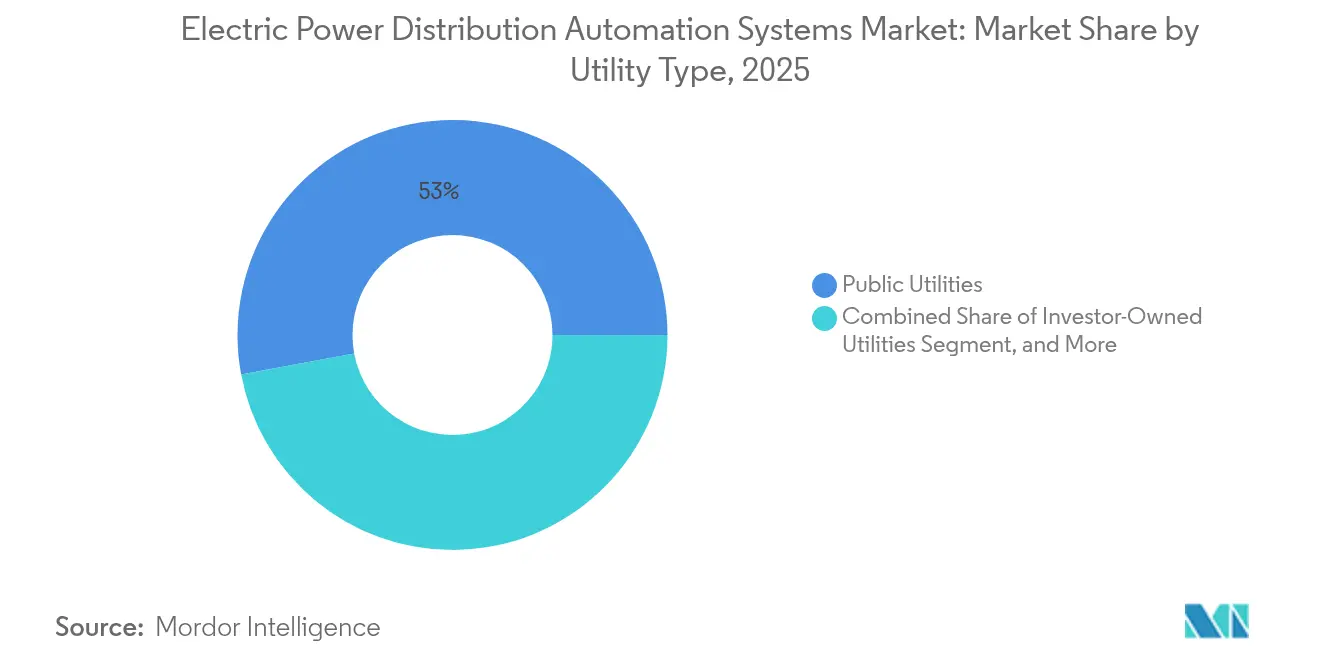
- By utility type, public utilities captured 52.95% revenue share in 2025; investor-owned utilities represent the fastest-growing cohort at 12.41% CAGR.
- By end-user sector, industrial users commanded 40.88% of electric power distribution automation systems market size in 2025; residential deployments will expand at 12.07% CAGR as prosumer models gain traction.
- By geography, Asia-Pacific contributed 46.12% of global revenue in 2025 and is advancing at a 9.78% CAGR to 2031, outpacing all other regions.
Note: Market size and forecast figures in this report are generated using Mordor Intelligence’s proprietary estimation framework, updated with the latest available data and insights as of 2026.
Global Electric Power Distribution Automation Systems Market Trends and Insights
Drivers Impact Analysis*
| Driver | (~) % Impact on CAGR Forecast | Geographic Relevance | Impact Timeline |
|---|---|---|---|
| Accelerating smart-grid investments | +1.8% | Global, with concentration in North America and EU | Medium term (2-4 years) |
| Rising DER and EV grid-integration needs | +2.1% | Global, led by APAC and North America | Long term (≥ 4 years) |
| Aging T&D infrastructure replacement cycle | +1.4% | North America and EU primarily | Medium term (2-4 years) |
| Mass-rollout of edge intelligence (FLISR, VVO) in developing nations | +0.9% | APAC core, spill-over to Latin America | Long term (≥ 4 years) |
| Cyber-secure, IEC-61850-based digital substations gaining regulatory mandates | +0.6% | Global, with early adoption in EU and North America | Medium term (2-4 years) |
| AI-driven predictive asset-management lowering SAIDI/SAIFI | +0.5% | North America and EU, expanding to APAC | Short term (≤ 2 years) |
| Source: Mordor Intelligence | |||
Accelerating Smart-Grid Investments
State regulators approved 78% of utility modernization requests in 2024, unlocking a USD 35 billion capital plan at National Grid and USD 4 billion at DTE Energy that both earmarked substantial portions for automation deployments. The Department of Energy’s GRIP program injected USD 2.2 billion into 8 multi-state projects that alone added an estimated 13 GW of distribution-level capacity, illustrating how coordinated federal and state policies magnify investment flows. Performance-based regulation now links allowable returns to reliability metrics, driving utilities to favor automation that demonstrably trims outage durations. Together these policies fast-tracked substation digitization, feeder recloser rollouts, and consumer-side demand-response platforms across the electric power distribution automation systems market.
Rising DER and EV Grid-Integration Needs
FERC Order 2222 opened wholesale-market participation to aggregated DER fleets, prompting software upgrades that coordinate bi-directional power flows at millisecond latency. Utilities reported that 75% of their feeders saw higher peak demand from data-center construction and accelerating electric-vehicle adoption during 2024, pressuring planners to deploy ADMS modules capable of hosting virtual power plants. DOE’s DER Interconnection Roadmap set milestones for faster application processing by 2030, further lifting demand for predictive analytics engines that automate hosting-capacity calculations. These dynamics raised the addressable pool for consumer-side and feeder-level automation that sits at the heart of the electric power distribution automation systems market.
Aging T&D Infrastructure Replacement Cycle
EIA asset-age data showed 70% of U.S. power transformers and 60% of breakers had surpassed 25 years of service by 2024, causing utilities to bundle advanced sensors and fiber connectivity whenever replacements were scheduled. FirstEnergy’s USD 1.42 billion Long-Term Infrastructure Improvement Plan combined pole replacements with automated reclosers and underground network digitization. Because “smart” replacements capture new data streams, utilities improved asset-utilization factors and secured regulatory endorsement for cost-recovery riders tied to demonstrable outage-reduction benefits. This synchronization of aging-asset swap-outs with digital investment magnifies the growth of the electric power distribution automation systems market.
Mass-Rollout of Edge Intelligence (FLISR, VVO) in Developing Nations
World Bank financing of USD 960 million across 19 countries catalyzed deployments of fault-location isolation service restoration (FLISR) and volt-var optimization (VVO) platforms, cutting technical losses that previously topped 15% in some APAC utilities. Thailand’s state utility completed a province-wide FLISR deployment that restored service to 90% of affected customers within 3 minutes during pilot outages, highlighting leapfrog efficiencies achievable when legacy constraints are limited. Low local labor costs and streamlined permitting processes allowed rollouts to conclude in 12-18 months—half the timeline typical in OECD markets—accelerating the penetration curve for the electric power distribution automation systems market in emerging geographies.
Restraints Impact Analysis*
| Restraint | (~) % Impact on CAGR Forecast | Geographic Relevance | Impact Timeline |
|---|---|---|---|
| High upfront CAPEX and long pay-back periods | -1.2% | Global, particularly affecting smaller utilities | Medium term (2-4 years) |
| Legacy-system interoperability and integration risk | -0.8% | North America and EU with extensive legacy infrastructure | Short term (≤ 2 years) |
| Utility labour-skill shortages for OT-IT convergence | -0.6% | Global, acute in North America and EU | Medium term (2-4 years) |
| Supply-chain volatility in power semiconductors | -0.9% | Global, with severe impact in North America and APAC | Short term (≤ 2 years) |
| Source: Mordor Intelligence | |||
High Upfront CAPEX and Long Pay-Back Periods
Comprehensive distribution-automation roadmaps for mid-sized utilities frequently top USD 100 million, challenging entities with limited rate-base leverage or municipal bond capacity. [2]Convergent Energy & Power, “2025 Predictions for Energy Storage Sector,” convergentep.com Although inflation-reduction incentives benefit storage assets, many automation components remain ineligible, extending payback horizons beyond typical regulatory cycles for smaller cooperatives. NRECA’s USD 4 million CIDER initiative underscored this gap, funneling technical assistance to five pilot co-ops but illustrating the broader financing deficits rural providers face. High capital intensity therefore tempers near-term adoption among the long tail of utilities within the electric power distribution automation systems industry.
Legacy-System Interoperability and Integration Risk
Utilities still running proprietary SCADA protocols incurred integration overruns as high as 100% when transitioning to IEC 61850-based architectures, largely due to parallel-system maintenance during cutovers. Mature utilities reported 18-24-month project delays where OT and IT data models required harmonization ahead of analytics-platform commissioning. Workforce scarcity magnifies the challenge: Google’s pledge to train 100,000 electrical workers only begins to address competency shortages forecast to persist through 2030. These factors elevate perceived risk profiles, potentially deferring some utility investment decisions in the electric power distribution automation systems market.
*Our forecasts treat driver/restraint impacts as directional, not additive. The impact forecasts reflect baseline growth, mix effects, and variable interactions.
Segment Analysis
By Automation Stage: Consumer-Side Automation Drives Growth
Consumer-side automation grew from pilot niches to strategic cornerstone, delivering a 13.62% CAGR that surpassed other stages within the electric power distribution automation systems market. Substation automation nevertheless remained revenue anchor, holding 45.62% of electric power distribution automation systems market share in 2025, because every feeder upgrade ultimately hinges on robust upstream digital substations.
Prosumer adoption accelerated after ABB acquired Lumin, embedding home-energy-management software that orchestrates PV, storage, and EV loads behind the meter. Utilities layered time-of-use incentives atop this technology stack to shave system peaks and defer feeder upgrades. Feeder-level FLISR rollouts advanced steadily, leveraged by proof-of-value studies that documented 30% reductions in outage minutes and fast-tracked regulatory sign-offs. Together these advancements repositioned consumer-side automation as an indispensable complement to substation-centric investment strategies inside the electric power distribution automation systems market.


By Component: Software Solutions Lead Innovation
Field devices—including intelligent electronic devices, reclosers, and sectionalizers—held 48.77% of 2025 revenue, but software became the clear growth engine with a 13.06% CAGR through 2031. The launch of Schneider Electric’s One Digital Grid Platform exemplified a migration toward AI-infused grid-management suites that consolidate SCADA, outage-management, and DERMS functions. As software revenue shifted to subscription models, utilities benefited from predictable operating-expense structures and frequent feature updates delivered over secure channels. By 2028, industry consensus expects half of all new automation-budget line items to be software-dominated, reinforcing the transition to software-defined grids and reshaping supplier economics across the electric power distribution automation systems market.
Services, although often overshadowed, registered rising attach rates. Itron’s IntelliFLEX turnkey package bundled professional services, shortening deployment cycles for mid-tier utilities lacking in-house integration capacity. Growing reliance on managed-service contracts signaled a shift from capex-heavy models toward opex-oriented partnerships, aligning with broader digital-transformation trends across critical-infrastructure verticals.
By Communication Technology: Wireless Solutions Gain Momentum
Wired networks—principally fiber and power-line communication—still commanded 59.82% of electric power distribution automation systems market size in 2025 due to high bandwidth and noise immunity. Yet wireless platforms advanced fastest at 14.11% CAGR, propelled by RF mesh, Wi-SUN, and emerging 5G stand-alone deployments that cut trenching costs and extended reach to rural assets. The Honeywell–Verizon partnership unveiled 5G-enabled smart-meter backhaul that preserves millisecond latency for protection schemes, bringing cellular solutions into domains long dominated by utility private networks.
Utilities increasingly pursued hybrid topologies, combining fiber-backbone redundancy with wireless last-mile flexibility, thereby future-proofing communication stacks for edge-computing rollouts. Standards convergence improved multi-vendor interoperability, diminishing lock-in risks and stimulating supplier innovation across the electric power distribution automation systems market.
By Utility Type: Private Utilities Accelerate Modernization
Public-sector entities represented 52.95% of 2025 revenue, reflecting state ownership prevalence in many regions. Investor-owned utilities, however, posted the highest 12.41% CAGR as capital-market access and performance-based regulation incentivized modernization. Oncor’s USD 36 billion 2025-2029 plan illustrated scale advantages enjoyed by larger IOUs, enabling concurrent substation digitization and feeder automation across wide service territories.
Electric cooperatives remained challenged by small rate bases yet benefited from federal grant schemes and knowledge-sharing consortia. The NRECA-led CIDER pilots tested DER-management suites adaptable to low-density grids, offering potential templates for wider rural deployment. Successful proof points here may unlock new volumes in segments historically underserved within the electric power distribution automation systems industry.
By End-User Sector: Residential Segment Transforms
Industrial customers maintained 40.88% of electric power distribution automation systems market size in 2025, motivated by downtime avoidance and energy-efficiency mandates. Nevertheless, residential deployments are on track for a 12.07% CAGR through 2031 as households install PV, stationary storage, and bidirectional EV chargers. California Energy Commission research reported positive net-present-value outcomes when building-scale solar+storage assets were orchestrated by home-energy-management systems that also furnished utility peak-shaving benefits.
Commercial facilities embraced advanced demand-response enrollments that provide revenue-sharing on flexibility services, aligning occupant comfort with grid needs. Utilities stitched these heterogeneous assets into virtual power plants, creating multi-MW portfolios dispatchable through DERMS platforms—further underscoring the pivotal role of consumer-side intelligence in the electric power distribution automation systems market.
Geography Analysis
Asia-Pacific dominated global revenue with a 46.12% share in 2025, underpinned by successive rounds of state-backed stimulus and multilateral financing. China targeted 24.8 GW/55 GWh of new storage to accompany its ultra-high-voltage corridors, using the buildout as justification for parallel feeder automations that enhance renewable hosting capacity. The region’s 9.78% CAGR reflects complementarities between rapid industrialization, dense urban load centers, and government mandates that reward loss-reduction achievements.
North America exhibited mature yet robust momentum as regulators green-lit multiyear asset-management blueprints. DOE’s USD 5.7 billion GRIP awards funded 65 resilience projects that modeled cyber-secure IEC 62443 frameworks, effectively baking security into procurement specifications. Utilities like FirstEnergy combined state-approved infrastructure riders with federal grants, accelerating asset-digitization timelines that feed demand for substation and feeder automation equipment inside the electric power distribution automation systems market.
Europe pursued harmonized standards and cross-border balancing mechanisms, embedding automation within fit-for-55 decarbonization goals. Germany’s Energiewende pushed distribution operators to accommodate record renewable penetration, necessitating self-healing feeders and real-time volt-var control. Nordic TSOs led digital-substation penetration, citing resilience benefits during severe winter-storm events. Although market-saturation levels are higher, ongoing regulatory pressure to decouple emissions from load growth sustains replacement-cycle spending within the region’s slice of the electric power distribution automation systems market.


Competitive Landscape
The electric power distribution automation systems market displayed moderate consolidation as diversified players snapped up niche innovators. ABB’s USD 7.8 billion absorption of Hitachi Energy broadened its portfolio into residential energy-management, while Schneider Electric’s platform launch showcased a pivot toward cloud-native, AI-enabled solutions. Siemens introduced the SICAM Enhanced Grid Sensor, further tightening integration between field hardware and predictive-analytics software. [4]Siemens AG, “SICAM Enhanced Grid Sensor Launch,” siemens.com
Technology giants increasingly entered via strategic partnerships. Cisco teamed with Hitachi Energy to secure substation communication backbones, and Microsoft aligned with Itron and Schneider to deliver grid-edge intelligence via Azure services. Such alliances blur traditional vendor demarcations, pitting turnkey incumbents against agile software houses. Patent filings around IEC 61850 interoperability and machine-learning-driven fault detection climbed markedly in 2024, indicating sustained R&D intensity.
White-space persists in consumer-side ecosystems, where start-ups leverage low-cost IoT sensors and subscription analytics. Utilities seek vendor-agnostic platforms capable of orchestrating heterogeneous DER fleets, creating openings for smaller suppliers that can certify fast under security frameworks. Nonetheless, entrenched incumbents leverage scale to supply end-to-end suites spanning hardware, communications, and services, preserving material share of the expanding electric power distribution automation systems market.
Electric Power Distribution Automation Systems Industry Leaders
ABB Ltd.
Eaton Corporation Plc
G&W Electric Company
General Electric Company
Hitachi Energy Ltd
- *Disclaimer: Major Players sorted in no particular order

Recent Industry Developments
- March 2025: Schneider Electric launched One Digital Grid Platform, an AI-powered solution that unifies SCADA, DERMS, and ADMS functionality.
- March 2025: Itron introduced IntelliFLEX, a turnkey DER-integration suite bundling software, devices, and services.
- March 2025: Itron, Schneider Electric, and Microsoft formed a strategic collaboration on grid-edge intelligence applications.
- March 2025: Honeywell and Verizon announced 5G smart-meter integration to support ultra-low latency automation.


Global Electric Power Distribution Automation Systems Market Report Scope
Electric Power Distribution Automation Systems refer to advanced technologies and control systems designed to enhance the efficiency, reliability, and safety of electrical power distribution networks.
The electric power distribution automation systems market is segmented by type (substation automation, feeder automation, consumer side automation), by end-user (industrial, commercial, residential), by geography (North America, Europe, Asia-Pacific, Latin America, Middle East and Africa). The market sizes and forecasts are provided in terms of value (USD) for all the above segments.
| Substation Automation |
| Feeder Automation |
| Consumer-Side Automation |
| Field Devices (IEDs, Reclosers, Switchgear) |
| Software (SCADA, ADMS, Analytics) |
| Services (Consulting, Integration, O&M) |
| Wired (Fiber, PLC) |
| Wireless (RF Mesh, Cellular, Wi-SUN) |
| Public Utilities |
| Investor-Owned Utilities |
| Electric Cooperatives and Municipal Utilities |
| Industrial |
| Commercial |
| Residential |
| North America | United States | |
| Canada | ||
| Mexico | ||
| South America | Brazil | |
| Argentina | ||
| Rest of South America | ||
| Europe | Germany | |
| France | ||
| Spain | ||
| Italy | ||
| Russia | ||
| Rest of Europe | ||
| Asia-Pacific | China | |
| India | ||
| Japan | ||
| Australia | ||
| Rest of Asia-Pacific | ||
| Middle East and Africa | Middle East | Saudi Arabia |
| United Arab Emirates | ||
| Turkey | ||
| Africa | South Africa | |
| Nigeria | ||
| Rest of Africa | ||
| By Automation Stage | Substation Automation | ||
| Feeder Automation | |||
| Consumer-Side Automation | |||
| By Component | Field Devices (IEDs, Reclosers, Switchgear) | ||
| Software (SCADA, ADMS, Analytics) | |||
| Services (Consulting, Integration, O&M) | |||
| By Communication Technology | Wired (Fiber, PLC) | ||
| Wireless (RF Mesh, Cellular, Wi-SUN) | |||
| By Utility Type | Public Utilities | ||
| Investor-Owned Utilities | |||
| Electric Cooperatives and Municipal Utilities | |||
| By End-User Sector | Industrial | ||
| Commercial | |||
| Residential | |||
| By Geography | North America | United States | |
| Canada | |||
| Mexico | |||
| South America | Brazil | ||
| Argentina | |||
| Rest of South America | |||
| Europe | Germany | ||
| France | |||
| Spain | |||
| Italy | |||
| Russia | |||
| Rest of Europe | |||
| Asia-Pacific | China | ||
| India | |||
| Japan | |||
| Australia | |||
| Rest of Asia-Pacific | |||
| Middle East and Africa | Middle East | Saudi Arabia | |
| United Arab Emirates | |||
| Turkey | |||
| Africa | South Africa | ||
| Nigeria | |||
| Rest of Africa | |||


Key Questions Answered in the Report
What is the projected value of the electric power distribution automation systems market by 2031?
The market is forecast to reach USD 43.04 billion by 2031, up from USD 28.79 billion in 2026.
Which automation stage is growing fastest?
Consumer-side automation is expected to post a 13.62% CAGR through 2031 as prosumer adoption accelerates.
Why are wireless networks gaining traction in grid automation?
RF mesh, Wi-SUN, and 5G solutions reduce installation costs and provide flexible connectivity, helping wireless communication post the fastest 14.11% CAGR.
How big is Asia-Pacific’s share of global revenue?
Asia-Pacific accounted for 46.12% of worldwide revenue in 2025 and is advancing at a 9.78% CAGR.
What restraint most affects smaller utilities?
High upfront capital expenditure and extended payback periods remain the primary obstacle for cooperatives and municipal utilities.
Page last updated on:


