Industrial Lighting Market Size and Share
Market Overview
| Study Period | 2020 - 2031 |
|---|---|
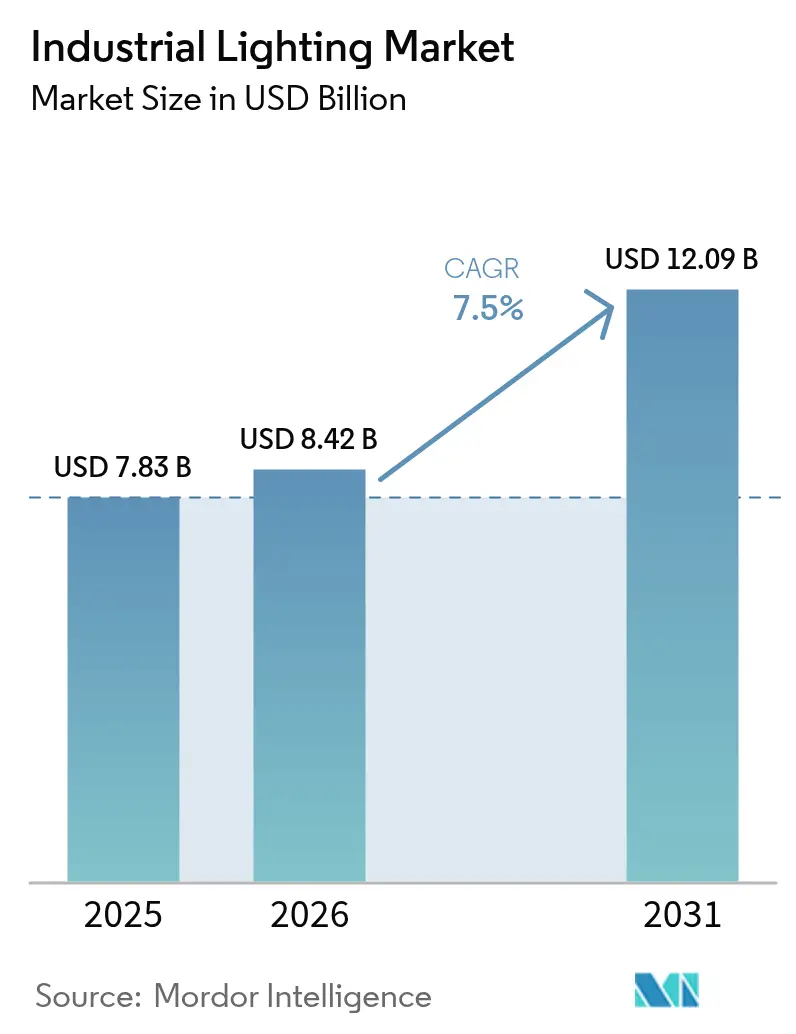
| Market Size (2026) | USD 8.42 Billion |
| Market Size (2031) | USD 12.09 Billion |
| Growth Rate (2026 - 2031) | 7.50% CAGR |
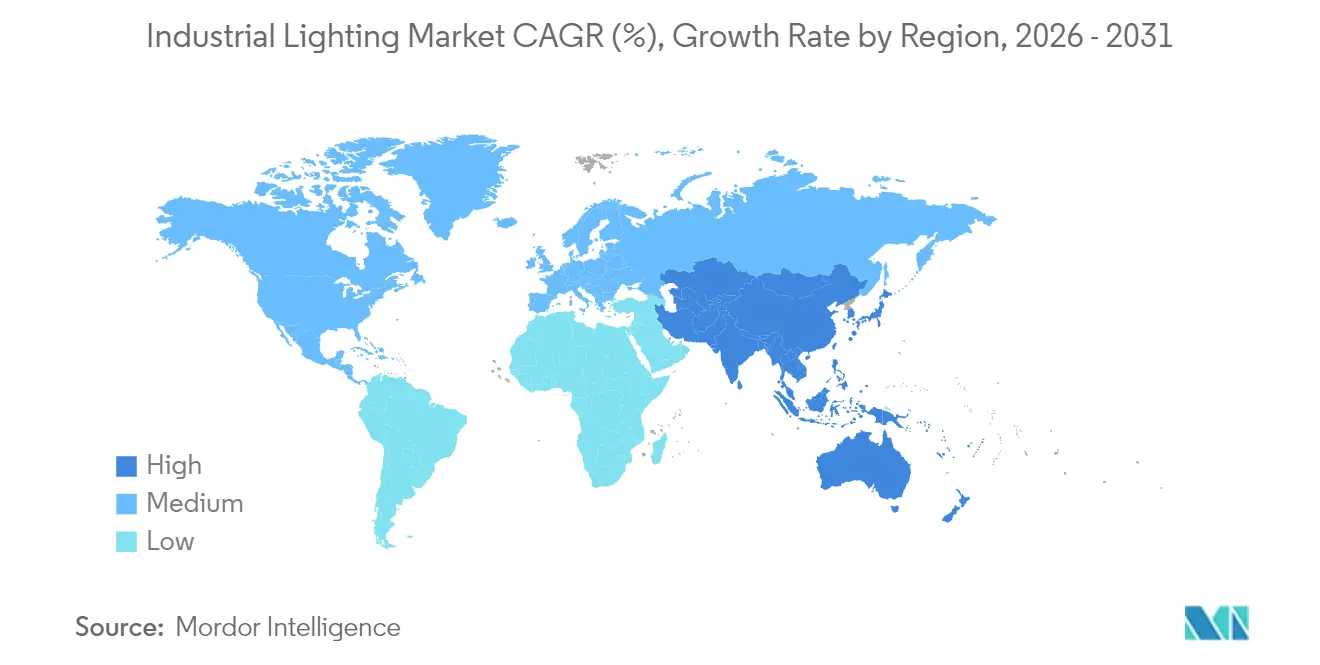
| Fastest Growing Market | Asia Pacific |
| Largest Market | Asia Pacific |
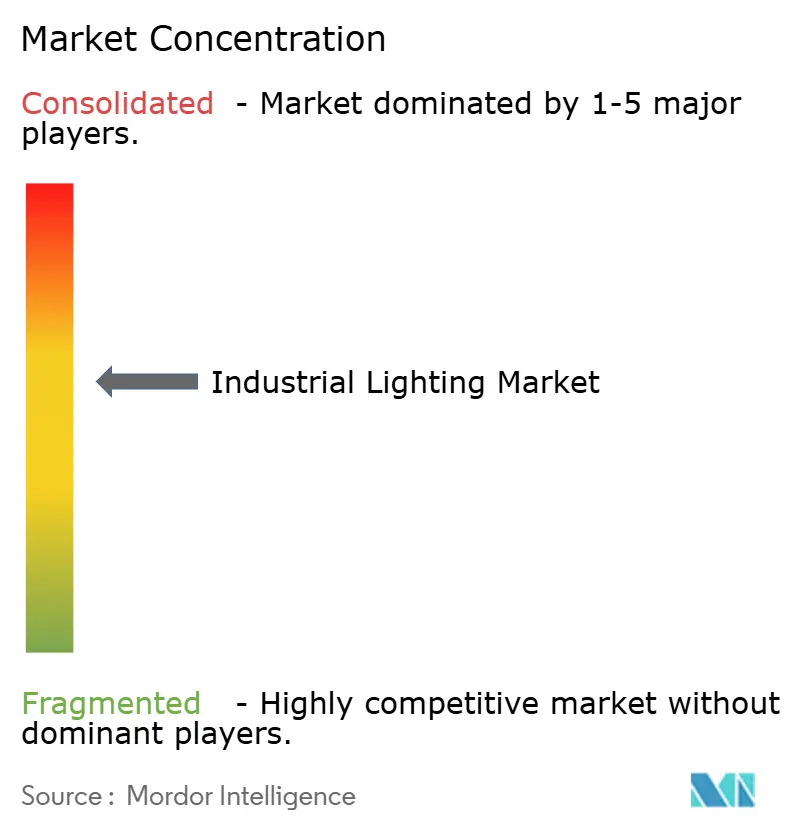
| Market Concentration | Medium |
Major Players *Disclaimer: Major Players sorted in no particular order Image © Mordor Intelligence. Reuse requires attribution under CC BY 4.0. | |
Industrial Lighting Market Analysis by Mordor Intelligence
The industrial lighting market size is expected to grow from USD 7.83 billion in 2025 to USD 8.42 billion in 2026 and is forecast to reach USD 12.09 billion by 2031 at 7.5% CAGR over 2026-2031. Growing retrofit projects in aging factories, rising automation in warehousing, and accelerating smart LED uptake underpin this expansion. Digitally connected luminaires that integrate sensors and edge computing cut maintenance downtime, while steep LED price declines widen the replacement gap with fluorescent and HID fixtures. Factory operators also respond to stricter ANSI/IES safety codes, and Lighting-as-a-Service (LaaS) models help bypass capital constraints by turning upgrades into predictable operating expenses.[1]OSHA, “Workplace Lighting Standards,” osha.gov Asia-Pacific leads revenue generation, yet tariff volatility on LED drivers and cybersecurity fears around connected fixtures temper the overall growth trajectory.
Key Report Takeaways
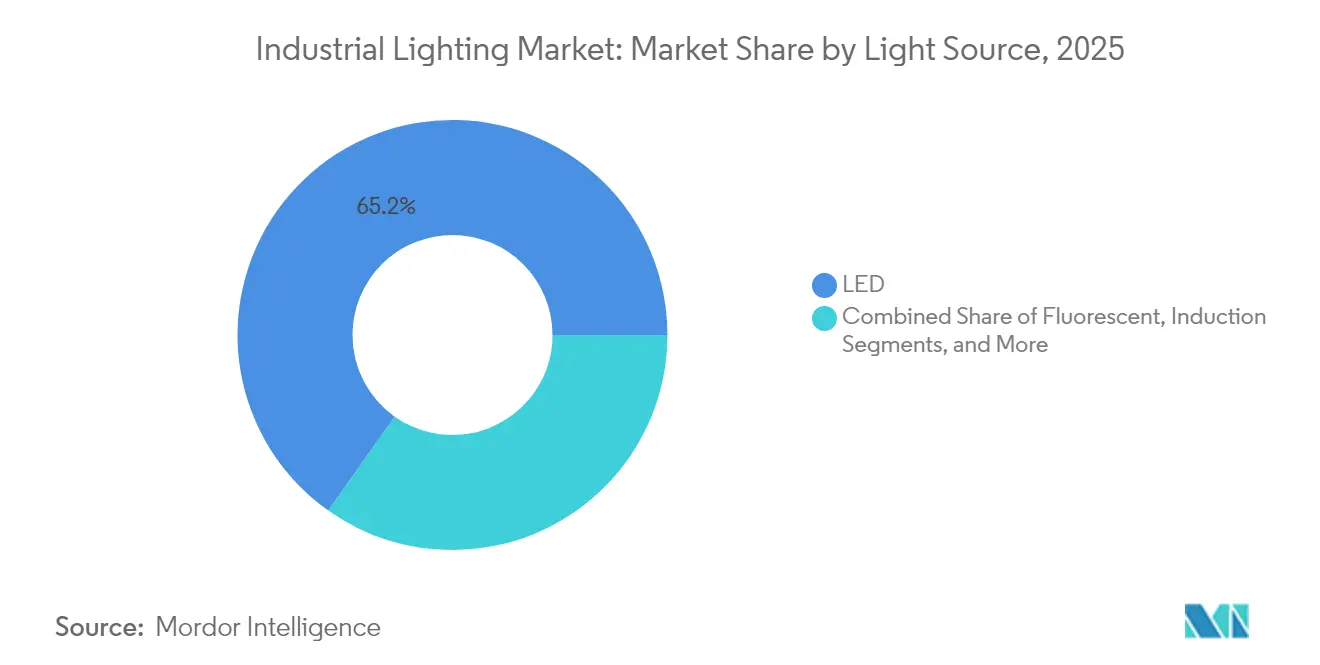
- By light source, LED commanded a 65.20% share of the industrial lighting market in 2025; smart LED variants are expected to expand at a 9.8% CAGR through 2031.
- By installation type, retrofit projects held 44.55% of the industrial lighting market size in 2025 and will progress at a 9.95% CAGR to 2031.
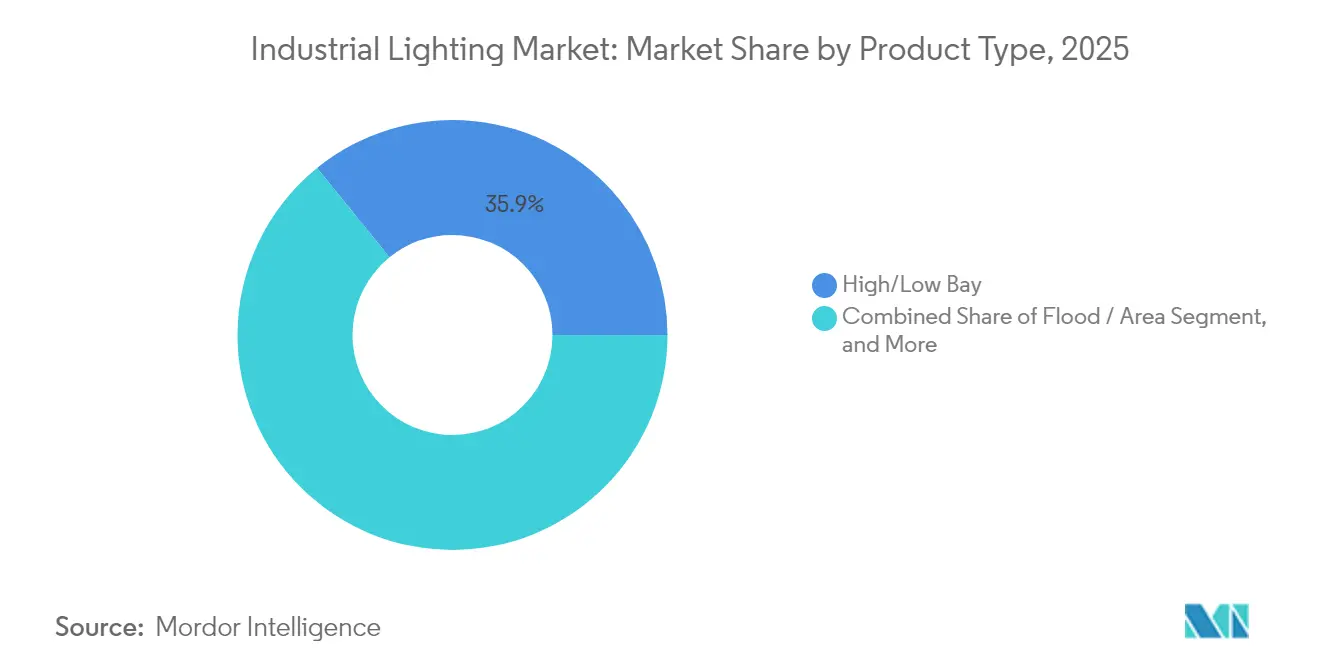
- By product type, high/low-bay luminaires led with 35.85% revenue share of the industrial lighting market in 2025, while explosion-proof fixtures are forecast to climb at a 9.55% CAGR through 2031.
- By end-user application, oil and gas captured 31.20% market share of the industrial lighting market in 2025; warehousing and logistics is projected to register the fastest 8.65% CAGR to 2031.
- By geography, Asia-Pacific accounted for 39.10% of the industrial lighting market's 2025 revenues and is on track for an 8.05% CAGR to 2031.
Note: Market size and forecast figures in this report are generated using Mordor Intelligence’s proprietary estimation framework, updated with the latest available data and insights as of 2026.
Global Industrial Lighting Market Trends and Insights
Drivers Impact Analysis*
| Driver | (~) % Impact on CAGR Forecast | Geographic Relevance | Impact Timeline |
|---|---|---|---|
| Steepening LED price-performance curve | +1.8% | Global, strongest in Asia-Pacific manufacturing hubs | Medium term (2-4 years) |
| Demand for retrofit-ready luminaires | +1.5% | North America and Europe legacy factories | Short term (≤ 2 years) |
| Stricter workplace-safety illumination codes | +1.2% | North America, expanding globally | Medium term (2-4 years) |
| Digital twin-enabled lighting tools | +0.9% | Germany, Japan, South Korea | Long term (≥ 4 years) |
| Warehouse automation task optics | +1.4% | E-commerce hubs in Asia-Pacific and North America | Short term (≤ 2 years) |
| Lighting-as-a-Service contracts | +0.8% | North America and Europe, emerging in Asia-Pacific | Medium term (2-4 years) |
| Source: Mordor Intelligence | |||
Steepening LED price-performance curve
LED efficacy has surpassed 200 lumens per watt and production costs keep falling by 15-20% every year, shortening payback periods in factory retrofits.[2]Acuity Brands, “Industrial Lighting Solutions,” acuitybrands.com Smart luminaires now embed sensors and wireless radios, eliminating separate control infrastructure and enabling predictive maintenance that reduces unplanned downtime.[3]Signify, “Industrial Lighting,” signify.com The combined efficiency and intelligence edge positions LEDs as the default choice for both new builds and upgrades.
Demand for retrofit-ready luminaires
Factories built between 1980 and 2010 approach end-of-life for fluorescent and HID fixtures, yet remain structurally sound. Plug-and-play LED retrofit kits slot into existing wiring and minimize production interruptions, slashing installation labor by up to 40%.[4]Rockwell Automation, “Connected Smart Factory,” rockwellautomation.com Energy savings of 50-70% deliver sub-24-month paybacks, persuading financial controllers to green-light projects even amid economic uncertainty.
Stricter workplace-safety illumination codes
ANSI/IES RP-7-21 now mandates 500 lux for precision assembly tasks and 200 lux for general manufacturing. OSHA has stepped up enforcement, citing poor lighting in accident investigations. Facilities unable to meet thresholds risk penalties and production stoppages, making compliance-focused lighting upgrades a board-level priority.
Digital twin-enabled lighting tools
Plant owners increasingly simulate lighting layouts in digital twin platforms from Siemens and NVIDIA Omniverse before installing fixtures.[5]Siemens AG, “Digital Twin Industrial Solutions,” siemens.com Virtual photometric testing trims design errors and accelerates commissioning. KION Group reported a 40% cut in warehouse lighting deployment time after adopting twin-based workflows.
Restraints Impact Analysis*
| Restraint | (~) % Impact on CAGR Forecast | Geographic Relevance | Impact Timeline |
|---|---|---|---|
| Tariff volatility on LED drivers | −1.1% | Global chains, acute on Mexico–U.S. corridor | Short term (≤ 2 years) |
| Cybersecurity concerns on connected fixtures | −0.7% | Advanced manufacturing economies with high IoT penetration | Medium term (2-4 years) |
| Skills gap for controls commissioning | −0.5% | Global, more severe in developed markets | Long term (≥ 4 years) |
| Lengthy hazardous-location certifications | −0.4% | Oil and gas regions: Middle East, North America, North Sea | Medium term (2-4 years) |
| Source: Mordor Intelligence | |||
Tariff volatility on LED drivers
U.S. duties of up to 25% on drivers imported from Mexico and Canada inflate project costs and complicate procurement schedules. Many manufacturers are rerouting orders to Southeast Asia, but longer shipping times and quality-assurance challenges linger.
Cybersecurity concerns over connected fixtures
Operational technology teams fear that IoT luminaires could serve as gateways for ransomware. Surveys show 78% of factories lack in-house expertise to secure lighting networks. Until standardized cybersecurity frameworks mature, some operators postpone large-scale deployments of connected systems.
*Our forecasts treat driver/restraint impacts as directional, not additive. The impact forecasts reflect baseline growth, mix effects, and variable interactions.
Segment Analysis
By Light Source: LED Growth Sustains Market Leadership
LED held 65.20% of the industrial lighting market share in 2025, and smart variations are growing at a 9.8% CAGR through 2031. Within the industrial lighting market size, high-intensity discharge fixtures retain 20.05% share for extreme-output tasks, while fluorescent slips to 13.65% as energy codes tighten.
Affordability gains and integrated connectivity consolidate LED dominance. Smart LEDs incorporate occupancy sensing and wireless mesh control that bypasses separate wiring. HID persists in steel mills and shipyards demanding >50,000 lumen outputs, yet OEMs now prototype high-power LEDs to disrupt this niche. Organic LED remains a 1.10% sliver, mainly for curved cleanroom surfaces where uniform light prevents contamination.


By Offering: Control Systems Capture Premium Value
Lamps and luminaires supplied 48.80% of 2025 revenue, but control systems and sensors are forecast to post a 9.6% CAGR to 2031, the fastest within the industrial lighting market. Control modules optimize burn hours, slash energy by 25-35%, and feed predictive algorithms that flag component fatigue.
Services contribute 29.05% share, with LaaS contracts growing 32.8% annually as finance teams prefer OpEx over CapEx. Providers bundle hardware, controls, and maintenance in one monthly fee, de-risking technology obsolescence for plant owners.
By Installation Type: Retrofit Projects Accelerate
Retrofit work accounted for 44.55% of 2025 revenue and will rise at a 9.95% CAGR to 2031, marking the largest slice of the industrial lighting market size at the facility level. New-build activity, at 31.85% share, slows to a 6.65% CAGR as post-pandemic capacity additions normalize.
Regulatory pressure drives retrofits: older sites miss ANSI/IES glare limits and EN12464-1 color-rendering rules. Plug-and-play kits minimize downtime, letting maintenance crews swap fixtures during planned line breaks rather than prolonged shutdowns.
By Product Type: Explosion-Proof Fixtures Earn Premium Margins
High/low-bay luminaires dominated with a 35.85% share in 2025, servicing warehouses and machining halls. Yet explosion-proof lighting is the fastest climber at a 9.55% CAGR as petrochemical, mining, and grain-handling plants abide by UL844 and IECEx certification.
Explosion-proof units sell at 3-4 times standard fixture prices, bolstering revenue even though volume lags. Fragmented regional standards, ATEX in Europe, NEC in the U.S., push buyers toward globally certified brands such as R. STAHL and Dialight.
By End-User Application: Warehousing Surges on E-Commerce
Oil and gas retained a 31.20% share thanks to explosion-proof demand. Warehousing and logistics is set to expand at an 8.65% CAGR through 2031, the industrial lighting market’s fastest end-use segment. Autonomous mobile robots and machine-vision sorting require uniform, flicker-free light to minimize navigation errors.
Discrete and process manufacturing hold 24.30% share, underpinned by Industry 4.0 retrofits that link lighting to production data streams. Cleanrooms in pharma and semiconductor lines rely on sealed LED housings that repel particles and chemicals, sustaining an 8.05% growth clip.
Geography Analysis
Asia-Pacific contributed 39.10% of 2025 revenue and is forecast for an 8.05% CAGR to 2031. China’s smart-factory subsidies and India’s industrial corridor build-outs keep fixture demand high, while Japan and South Korea specify digital twins in project tenders. Southeast Asia benefits from supply-chain realignment away from China, boosting greenfield lighting installations.
North America captured 30.65% of turnover in 2025, advancing at a 6.95% CAGR. The industrial lighting market share for retrofit projects is greatest here because plants average 30 years old. ANSI/IES updates compel upgrades, yet tariffs on Mexican drivers inflate BOM costs and spur sourcing shifts to Vietnam and Thailand. Canadian carbon-reduction incentives further accelerate LED uptake across heavy industry.
Europe generated 30.25% of 2025 sales and will post a 6.65% CAGR. Germany leads with Industry 4.0 pilots linking lighting to robotics, while France and the UK target energy savings to meet 2030 climate goals. Eastern Europe, including Poland and Czechia, grows faster at 8.95% on the back of EU structural funds earmarked for manufacturing upgrades.

Competitive Landscape
The five largest suppliers command about 42% of global revenue, signaling a moderately concentrated field. Acuity Brands, Signify, and Eaton leverage broad portfolios and proprietary wireless protocols to bundle luminaires, controls, and services. Recent deals, such as LEDVANCE buying loblicht, illustrate value-chain consolidation aimed at turnkey project competence.
Technology rivalry centers on edge-native analytics that predict lamp failure before it halts production. Siemens’ pending buyout of Altair Engineering adds Toggled’s retrofit controls to its industrial automation stack, fusing lighting with PLC-level data. Meanwhile, disruptors selling modular fixtures online bypass traditional distributors, squeezing margins.
Explosion-proof niches remain competitive thanks to certification barriers. Dialight, R. STAHL, and CESP focus on UL844 and IECEx compliance, commanding premium ASPs. Regional specialists defend their share through tailored solutions for harsh climates or high-ambient-temperature processes.
Industrial Lighting Industry Leaders
Signify Holding N.V.
ams OSRAM AG
Acuity Brands, Inc.
Eaton Corporation plc
Hubbell Incorporated
- *Disclaimer: Major Players sorted in no particular order

Recent Industry Developments
- January 2025: LEDVANCE completed the acquisition of German lighting firm loblicht, expanding premium industrial offerings.
- January 2025: LightMart secured majority recapitalization from Tonka Bay Equity Partners to scale distribution capacity.
- January 2025: Kuzco Lighting bought Insight Lighting, adding U.S. manufacturing and custom optics.
- December 2024: Siemens announced a USD 10.6 billion deal to acquire Altair Engineering, integrating Toggled’s retrofit controls.


Global Industrial Lighting Market Report Scope
Industrial lighting is used in warehouses, factories, heavy and light metal industries, etc., and provides good visibility and a safer workplace. The Industrial Lighting Market is segmented by Light Source (LED, High-intensity Discharge (HID) Lighting, Fluorescent Lighting), Product Type (High/Low Bay Lighting, Flood/Area Lighting), End-user Application (Oil and Gas, Mining, Pharmaceutical, Manufacturing, Warehouse), and Geography (North America, Europe, Asia Pacific, Latin America, MEA). The market sizes and forecasts are provided in terms of value (USD million) for all the above segments.
The study also tracks key market parameters, underlying growth influencers, and major vendors operating in the industry, which supports market estimations and growth rates over the forecast period. The study further analyzes the overall impact of the COVID-19 pandemic on the ecosystem.
| LED |
| High-Intensity Discharge (HID) |
| Fluorescent |
| Induction |
| Organic LED (OLED) |
| Lamps and Luminaires |
| Control Systems and Sensors |
| Services (Design, LaaS, Maintenance) |
| New Build |
| Retrofit |
| Replacement |
| High / Low Bay |
| Flood / Area |
| Task and Spotlight |
| Explosion-proof / Harsh-Environment |
| Oil and Gas |
| Mining and Metals |
| Pharmaceutical and Clean-room |
| Discrete and Process Manufacturing |
| Warehousing and Logistics |
| Food and Beverage |
| Chemical and Petrochemical |
| North America | United States |
| Canada | |
| Mexico | |
| South America | Brazil |
| Argentina | |
| Rest of South America | |
| Europe | Germany |
| United Kingdom | |
| France | |
| Italy | |
| Rest of Europe | |
| Asia-Pacific | China |
| Japan | |
| South Korea | |
| India | |
| Rest of Asia-Pacific | |
| Middle East | Saudi Arabia |
| United Arab Emirates | |
| Rest of Middle East | |
| Africa | South Africa |
| Rest of Africa |
| By Light Source | LED | |
| High-Intensity Discharge (HID) | ||
| Fluorescent | ||
| Induction | ||
| Organic LED (OLED) | ||
| By Offering | Lamps and Luminaires | |
| Control Systems and Sensors | ||
| Services (Design, LaaS, Maintenance) | ||
| By Installation Type | New Build | |
| Retrofit | ||
| Replacement | ||
| By Product Type | High / Low Bay | |
| Flood / Area | ||
| Task and Spotlight | ||
| Explosion-proof / Harsh-Environment | ||
| By End-user Application | Oil and Gas | |
| Mining and Metals | ||
| Pharmaceutical and Clean-room | ||
| Discrete and Process Manufacturing | ||
| Warehousing and Logistics | ||
| Food and Beverage | ||
| Chemical and Petrochemical | ||
| By Geography | North America | United States |
| Canada | ||
| Mexico | ||
| South America | Brazil | |
| Argentina | ||
| Rest of South America | ||
| Europe | Germany | |
| United Kingdom | ||
| France | ||
| Italy | ||
| Rest of Europe | ||
| Asia-Pacific | China | |
| Japan | ||
| South Korea | ||
| India | ||
| Rest of Asia-Pacific | ||
| Middle East | Saudi Arabia | |
| United Arab Emirates | ||
| Rest of Middle East | ||
| Africa | South Africa | |
| Rest of Africa | ||


Key Questions Answered in the Report
What is the projected value of the industrial lighting market by 2031?
The market is expected to reach USD 12.09 billion by 2031, growing at a 7.5% CAGR.
Which region accounts for the largest revenue share in industrial lighting?
Asia-Pacific leads with 39.10% of 2025 global revenue and the fastest 8.05% CAGR to 2031.
Why are retrofit projects growing faster than new installations?
Aging factories must meet updated ANSI/IES safety codes, and plug-and-play LED kits cut downtime while delivering sub-24-month paybacks.
How do smart LEDs benefit industrial facilities?
They integrate sensors and wireless communications that enable predictive maintenance and reduce energy consumption by up to 35%.
What factors restrain adoption of connected lighting in industry?
Tariff volatility inflates component costs, and cybersecurity risks deter deployment in highly automated plants.
Which end-user segment will grow the fastest through 2031?
Warehousing and logistics, driven by e-commerce automation, is projected to post an 8.65% CAGR.
Page last updated on:


