Stainless Steel 400 Series Market Size and Share
Market Overview
| Study Period | 2021 - 2031 |
|---|---|
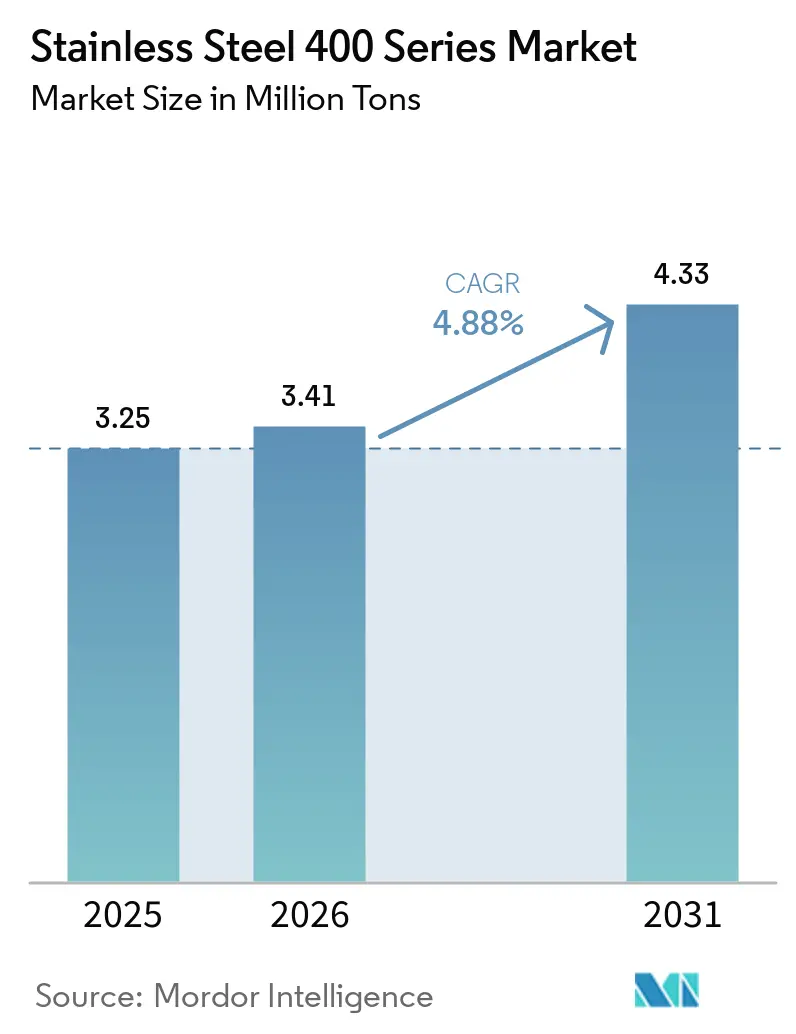
| Market Volume (2026) | 3.41 Million tons |
| Market Volume (2031) | 4.33 Million tons |
| Growth Rate (2026 - 2031) | 4.88% CAGR |
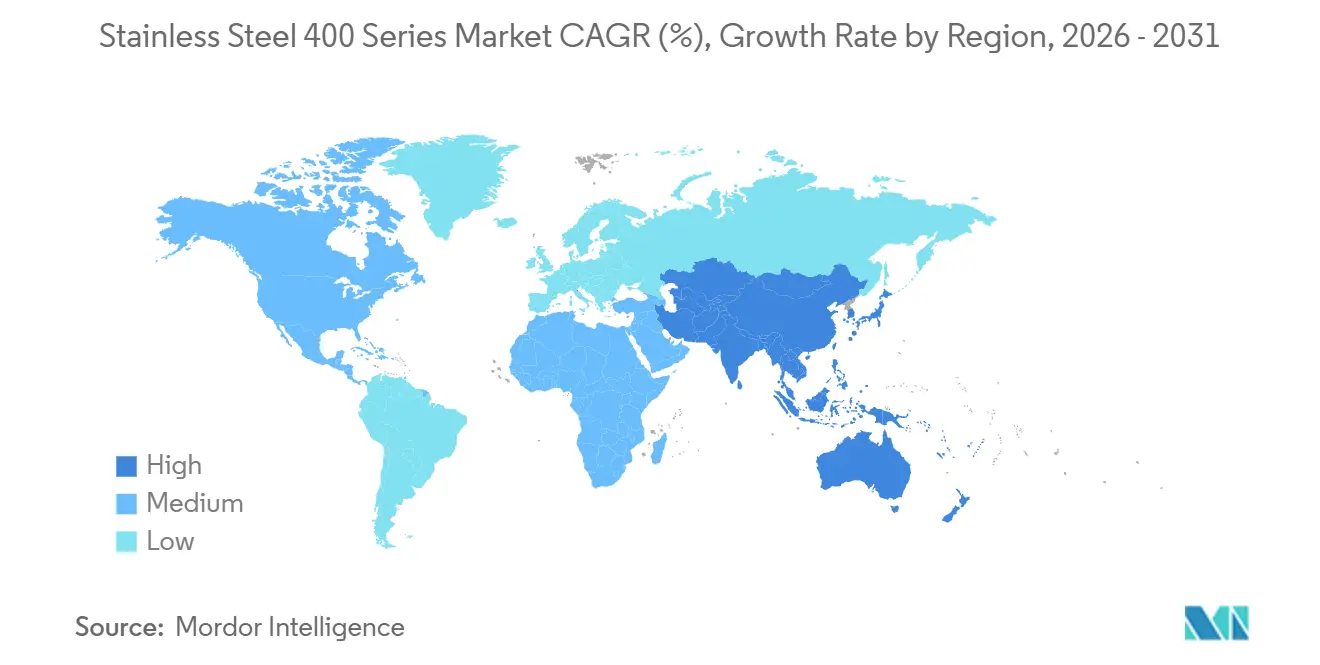
| Fastest Growing Market | Asia-Pacific |
| Largest Market | Asia-Pacific |
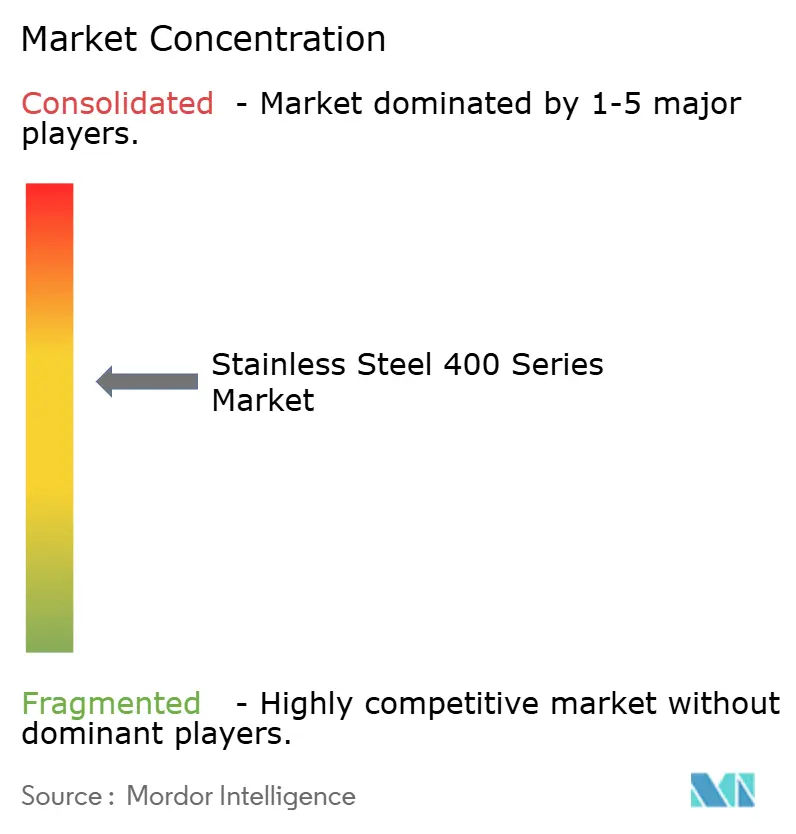
| Market Concentration | Medium |
Major Players
*Disclaimer: Major Players sorted in no particular order Image © Mordor Intelligence. Reuse requires attribution under CC BY 4.0. |
|
Stainless Steel 400 Series Market Analysis by Mordor Intelligence
The Stainless Steel 400 Series Market size is projected to grow from 3.25 million tons in 2025 to 3.41 million tons in 2026 to reach 4.33 million tons by 2031, growing at a CAGR of 4.88% from 2026 to 2031. Cost leadership versus nickel-bearing austenitic grades, the dominance of grade 409 in automotive exhaust lines, and Asia-Pacific infrastructure outlays anchor volume growth. Rapid substitution in catalytic-converter housings, rising demand for ultra-thin ferritic foils in green-hydrogen devices, and policy-driven appliance replacement cycles in China reinforce the material’s value proposition. Capacity rationalization in China and Indonesia’s emergence as a low-cost hub are recalibrating trade flows, while the EU Carbon Border Adjustment Mechanism (CBAM) elevates the premium on low-carbon electric-arc-furnace (EAF) tonnage. Competitive differentiation is shifting toward precision cold-rolling, surface-activation technologies, and vertically integrated ferrochrome supply.
Key Report Takeaways
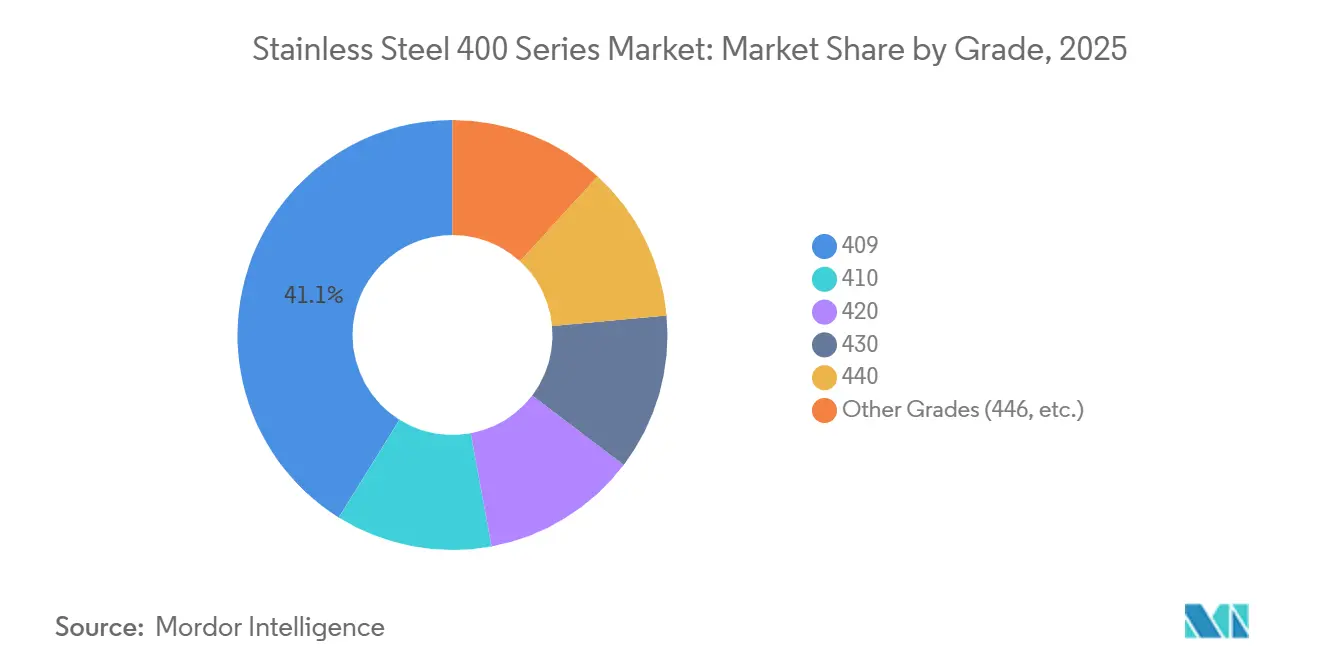
- By grade, 409 captured 41.11% volume share in 2025 while registering the highest 5.45% CAGR through 2031.
- By product type, sheets and plates held 42.32% of the stainless steel 400 series market size in 2025; bars and rods are set to grow at 5.67% CAGR to 2031.
- By application, automotive exhaust systems accounted for 45.56% share of the stainless steel 400 series market in 2025, and energy generation is advancing at a 5.81% CAGR through 2031.
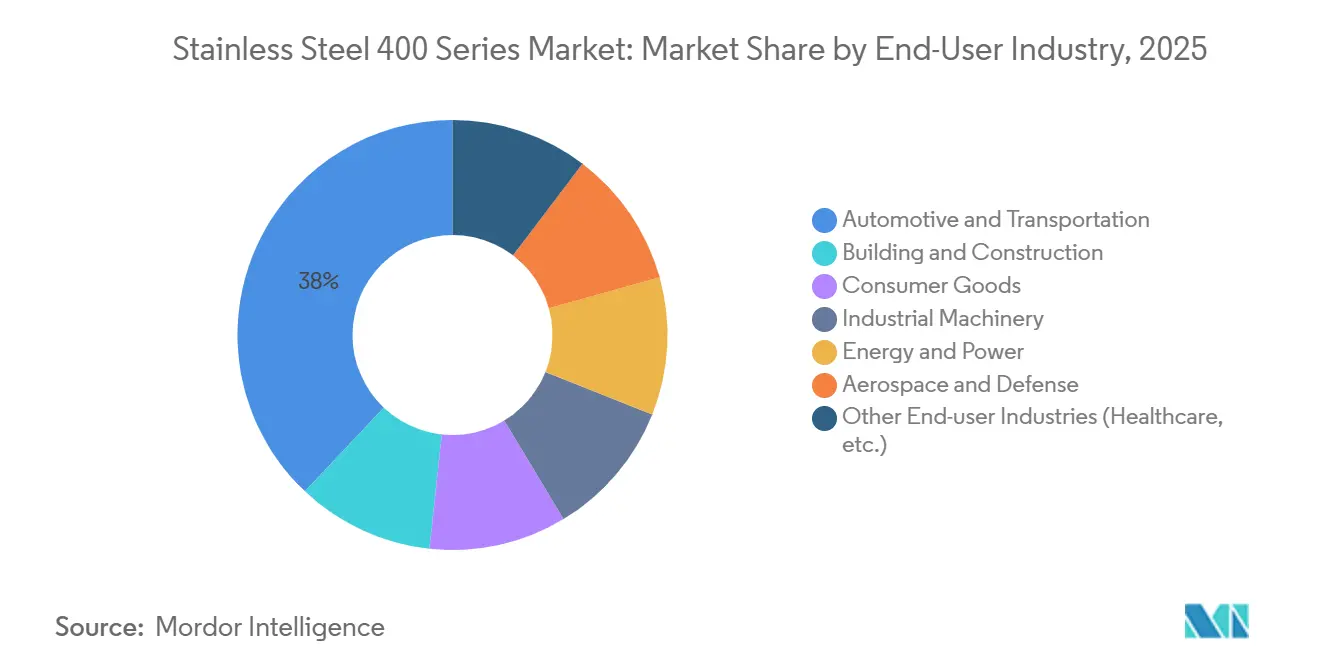
- By end-use industry, automotive and transportation led with 37.96% share in 2025, whereas energy and power are forecast to expand at 5.86% CAGR up to 2031.
- By region, Asia-Pacific commanded 52.34% of the stainless steel 400 series market share in 2025 and is projected to expand at a 5.72% CAGR between 2026 and 2031.
Note: Market size and forecast figures in this report are generated using Mordor Intelligence’s proprietary estimation framework, updated with the latest available data and insights as of January 2026.
Global Stainless Steel 400 Series Market Trends and Insights
Driver Impact Analysis*
| Drivers | (~) % Impact on CAGR Forecast | Geographic Relevance | Impact Timeline |
|---|---|---|---|
| Growth in construction and infrastructure spending | +1.2% | Asia-Pacific, Middle East | Medium term (2-4 years) |
| Cost advantage over austenitic grades amid nickel swings | +1.5% | Global price-sensitive markets | Short term (≤ 2 years) |
| Rising usage in kitchenware and home appliances | +0.9% | China, India, South Korea, North America, Europe | Medium term (2-4 years) |
| Adoption in bipolar plates for green-hydrogen systems | +0.7% | Europe, North America, Japan, South Korea | Long term (≥ 4 years) |
| Demand for ultra-thin foils in solid-oxide fuel cells | +0.5% | Europe, Japan, South Korea, North America | Long term (≥ 4 years) |
| Source: Mordor Intelligence | |||
Growth in Construction and Infrastructure Spending
China’s 2026 central budget sets aside CNY 755 billion (USD 109.22 billion) for municipal works and CNY 800 billion (USD 115.73 billion) in ultra-long treasury bonds that favor stainless structural products, propelling demand for ferritic grades in bridges, water pipelines, and public-transit upgrade. Grade 430, with 16-18% chromium, replaces galvanized steels in bridge decks and agricultural equipment because it balances corrosion resistance and formability. India’s production-linked incentive scheme grants 4-15% on incremental stainless long-product sales, encouraging new ferritic melt shops. Rural water-safety rollouts in China extend stainless piping into previously untreated counties, enlarging the addressable base. Mega-projects in the Gulf and Southeast Asia broaden geographic exposure, though execution still hinges on public-finance cycles and input-price stability.
Cost Advantage Over Austenitic Grades Amid Nickel Volatility
Grade 409 trades at USD 1,800-2,200 per ton versus USD 3,000-3,500 for 304, a gap that widens when nickel surpasses USD 18,000 per ton. Indonesia supplies roughly 70% of global nickel ore, yet stricter 2026 quotas revived pricing after a 40% slide from 2021 peaks[1]Climate Energy Finance. "Raw Power: China locks-in global dominance of critical minerals and metals with $120bn outbound investment surge,”climateenergyfinance.org. Ferritic grades, containing little to no nickel, insulate OEM budgets and trigger substitution in exhausts, appliance panels, and re-rollers’ feedstock. When nickel retreats, austenitic grades claw back share where higher corrosion thresholds are essential, underscoring a price-elastic see-saw across end markets.
Rising Usage in Kitchenware and Home Appliances
Beijing’s CNY 250 billion (USD 36.16 billion) appliance-trade-in scheme accelerates refrigerator, dishwasher, and cookware replacements that favor 200 and 400 series cold-rolled sheet. Grade 430’s magnetic response supports induction cookware, and its thermal conductivity beats austenitic benchmarks, sharpening cook-surface performance. India’s middle-class expansion lifted national stainless steel consumption 8% year-on-year to 4.85 million tons in FY 2025, boosting demand for deep-drawn sinks and premium BA finishes. Martensitic 420 and 440 grades, heat-treatable above Hardness Rockwell C-scale 55, dominate high-end cutlery and surgical instruments that require polishability and edge retention. Surface-finish premiums of 10-30% underscore the value of tight process control in Asian and European mills.
Adoption in Bipolar Plates for Green-Hydrogen Electrolyzers
Dana Incorporated stamps 0.1 mm metallic bipolar plates on ferritic substrates and applies conductive coatings to reduce resistance and lower the cost per kilowatt compared to graphite plates[2]FuelCellChina, “Dana Metallic Bipolar Plate Accelerates Cost-Efficient Green Hydrogen,” fuelcellchina.com. Feintool and SITEC are scaling similar plates to dimensions of 800 × 600 mm, incorporating physical vapor deposition (PVD) corrosion barriers for proton exchange membrane (PEM) and solid oxide fuel cell (SOFC) stacks. The European Union (EU) has identified hydrogen as a key component of its 2030 climate plan, encouraging electrolyzer buyers to adopt stainless solutions that comply with the Carbon Border Adjustment Mechanism (CBAM). Ferritic grades require post-processing to achieve sub-10 milliohm square centimeter (mΩ cm²) contact resistance; however, their formability and cost efficiency position them as viable options as policy subsidies decrease. The commercial scalability of these solutions depends on reducing electrolyzer system costs to below USD 500 per kilowatt (kW).
Restraint Impact Analysis*
| Restraints | (~) % Impact on CAGR Forecast | Geographic Relevance | Impact Timeline |
|---|---|---|---|
| Chromium and ferrochrome price volatility | -0.8% | Global integrated mills | Short term (≤ 2 years) |
| Additive-manufacturing cracking and printability issues | -0.3% | High-tech markets worldwide | Medium term (2-4 years) |
| Carbon-border-adjustment and lifecycle-CO₂ compliance | -0.6% | Europe, global exporters to EU | Medium term (2-4 years) |
| Source: Mordor Intelligence | |||
Chromium and Ferrochrome Price Volatility
In early 2026, India's ferrochrome prices reached INR 74,000-75,000 (USD 784.17-794.77) per ton. Meanwhile, Chinese import offers were around USD 0.84 per pound, reflecting supply constraints due to production curtailments in South Africa. The Carbon Border Adjustment Mechanism (CBAM) applies default carbon dioxide (CO₂) factors of 3.5-4.0 tons to unverified imports, resulting in taxes on blast-furnace stainless steel and higher Electric Arc Furnace (EAF) premiums. To address potential price fluctuations, China's state-owned mining companies secured over 500 million tons of chromite from international sources. Mills without captive ore resources face margin pressures during ferrochrome price increases, driving consolidation among vertically integrated producers.
Additive-Manufacturing Cracking and Printability Issues
Laser powder-bed fusion (LPBF) achieves a tensile strength of 1,162 MPa for 410 martensitic stainless steel. However, it faces porosity levels exceeding 1.5% at low energy densities, along with delta-ferrite fractions of up to 59%, which impact ductility. Directed-energy deposition (DED) of 430 on 410 achieves 560 MPa at 500°C, but post-heat treatment carbides result in intergranular corrosion. Wire-arc directed-energy deposition (WA-DED) increases deposition rates by eight times but produces a 0.5 mm surface roughness, requiring additional machining. Qualification pathways for these processes are less developed compared to austenitic grades, limiting their application in aerospace and medical devices.
*Our forecasts treat driver/restraint impacts as directional, not additive. The impact forecasts reflect baseline growth, mix effects, and variable interactions.
Segment Analysis
By Grade: 409 Dominates Exhaust Lines While Martensitic Grades Target Tooling
Grade 409 accounted for 41.11% of the stainless steel 400 series market share in 2025 and is projected to expand at 5.45% CAGR to 2031. The stainless steel 400 series market size for automotive exhaust lines benefits from grade 409’s 10.5-11.75% chromium chemistry that withstands 600°C gases at half the cost of 304. Grade 430 capitalizes on appliance and architectural panels, buoyed by China’s appliance-trade-in bounty. Martensitic 410, 420, and 440 grades deliver greater than or equal to 55 HRC hardness, fueling surgical-instrument and industrial-knife demand. Niche grade 446 services furnace linings and heat exchangers thanks to 23-27% chromium, but trades at a higher alloy surcharge.
Emerging ferritic variants such as T4003 and SOLEIL 4003 marry smaller than or equal to 13% chromium with titanium stabilizers, improving weldability and ductility for train shells and bridge decks. Patented surface activation by Nippon Steel enhances oxide-film stability, shrinking oxidation weight gain to 0.3 mg/cm² at 600°C and extending service life in humid heat exchangers. Producers increasingly differentiate through coating and pickling know-how rather than raw metallurgy alone.


By Product Type: Sheets Retain Lead, Bars Race Ahead
In 2025, sheets and plates accounted for 42.32% of the volume, reflecting their application in appliance skins, cladding, and body panels that require smooth surfaces and precise gauges. Bars and rods are projected to achieve the highest compound annual growth rate (CAGR) of 5.67%, driven by demand for precision-machined valves, gears, and the free-cutting 416 variant containing 0.15-0.30% sulfur. Coils address the needs of service centers and re-rollers, focusing on consistent chemistry across multi-ton lots. Pipes and tubes cater to the construction and energy sectors, while foils thinner than 0.1 mm support solid oxide fuel cell (SOFC) and electrolyzer stacks, creating a high-margin segment within the stainless steel 400 series market.
China's mills are advancing industry benchmarks: Fushun's big-data controls have improved plate precision by 65%, Liyang Delong operates the world's widest 2,680 mm hot mill, and Shanxi Fujian has implemented a 1,550 mm 20-roll cold mill, achieving micron-level tolerances. Surface finishes ranging from 2B to 8K command premiums of 10-30%, driving investments in polishing processes. While wire-arc directed energy deposition (DED) technology reduces raw material usage by 78% during large repairs, it remains less efficient in sheet throughput compared to conventional rolling, which continues to dominate.
By Application: Exhaust Systems Still Rule as Energy Segment Surges
Automotive exhaust systems absorbed 45.56% of 2025 tonnage, cementing grade 409’s leadership given its USD 1,800-2,200 per ton price versus USD 3,000–3,500 for 304. The stainless steel 400 series market size tied to energy generation will log a 5.81% CAGR to 2031 as electrolyzer bipolar plates and SOFC foils outpace legacy power applications. Kitchenware rides grade 430’s deep-draw qualities and magnetic response for induction cooking. Industrial equipment counts on 410 and 416 for pump shafts and free-machining fittings.
Construction adopts SOLEIL 4003 in bridge trusses and conveyor frames, replacing galvanized carbon steel in corrosive climates. Appliance shells and liners leverage tight-tolerance cold-rolled coils, benefiting from Chinese and Indian urban upgrades. Metallic bipolar plates from Dana and Feintool cut electrolyzer costs, accelerating pilot-to-commercial transitions in Europe and North America.
By End-User Industry: Automotive Still Largest, but Energy Is Fastest
In 2025, exhaust systems accounted for 37.96% of the total volume in the automotive and transportation sector. Although electric vehicles eliminate traditional tailpipes, the increasing sales of hybrid vehicles and exports of internal combustion vehicles are sustaining demand. The energy and power sector is projected to grow at a 5.86% CAGR, driven by the deployment of hydrogen and Solid Oxide Fuel Cells (SOFC). The building and construction sector is supported by government investments in China and the Gulf, utilizing ferritic grades in applications such as water pipes and bridge decks.
Consumer goods flourish on appliance upgrades, while industrial machinery relies on martensitic bar stock for high-wear components. Aerospace and defense use premium 440 for bearings and valves, but remain low-volume. Healthcare instruments employ 420 and 440, with additive manufacturing enabling patient-specific geometries once the hurdles are solved.
Geography Analysis
Asia-Pacific commanded 52.34% of 2025 volume and is advancing at a 5.72% CAGR to 2031, underscored by China’s CNY 755 billion (USD 109.22 billion) infrastructure budget and CNY 250 billion (USD 36.16 billion) appliance-trade-in plan. China’s top three mills captured 67.30% of 2024 stainless output, consolidating supply and raising bargaining power. India’s utilization hovers near 60% against 7.5 million t capacity, giving headroom for ferritic ramp-ups; Jindal’s 1.2 million ton Indonesian melt shop reinforces regional self-sufficiency. Indonesia’s POSCO-Tsingshan venture adds 2 million t of captive-ore-fed capacity, positioning the archipelago as a low-cost hub.
U.S. automotive still pulls grade 409, but EV diffusion trims per-vehicle stainless loadings. Tariff layers across the U.S., Canada, and Mexico entangle trade, steering buyers toward regional mills.
Europe confronts CBAM, allocating default CO₂ factors that inflate landed costs for high-emission imports. Outokumpu’s EUR 200 million (USD 229.65 million) Tornio upgrade pivots to duplex and precipitation-hardened grades, while Acerinox and Aperam sink EUR 160 million (USD 183.72 million) to curb energy use amid soft demand. Germany and the Nordics spearhead electrolyzer rollouts, favoring metallic bipolar plates. South America and MEA remain smaller slices but gain from localized appliance and construction needs despite currency risk.

Competitive Landscape
The Stainless Steel 400 Series market is moderately concentrated. Vertical integration reduces exposure to ferrochrome price fluctuations. Outokumpu has exited commodity ferritic production at Krefeld and invested EUR 200 million in specialty production at Tornio, focusing on duplex niches. Acerinox and Aperam are improving cold-rolling processes and energy efficiency, but face European margin pressures.
Stainless Steel 400 Series Industry Leaders
-
Jindal Steel
-
Outokumpu
-
POSCO
-
China Baowu Steel Group
-
TSINGSHAN HOLDING GROUP
- *Disclaimer: Major Players sorted in no particular order

Recent Industry Developments
- March 2026: Jindal Stainless commissioned a 1.2 million ton SMS melt shop in Indonesia and announced an investment in downstream cold-rolling. The expansion utilized captive nickel-ore and ferrochrome supplies to provide grades 409 and 430 at competitive prices for automotive and appliance applications.
- October 2025: The POSCO-Tsingshan joint venture commenced construction of a 2 million ton integrated stainless facility in Indonesia with an investment of USD 708.3 million. The facility targeted ferritic-grade stainless steel production for automotive and appliance applications. It utilized captive nickel-ore and ferrochrome supply to produce cost-competitive grades 409 and 430.


Global Stainless Steel 400 Series Market Report Scope
Stainless Steel 400 Series, a group of high-strength, magnetic chromium alloys (typically 11-18% Cr), contains minimal to no nickel. This composition provides wear resistance and cost efficiency compared to the lower series steels. Comprising ferritic and martensitic types, 400 series stainless steels are used in automotive exhaust systems (409), cutlery (420/440), and industrial components.
The Stainless Steel 400 Series market is segmented by grade, product type, application, end-use industry, and geography. By grade, the market is segmented into 409, 410, 420, 430, 440, and Other Grades (446, etc.). By product type, the market is segmented into sheets and plates, coils, bars and rods, pipes and tubes, and other product types (ultra-thin foil, etc.). By application, the market is segmented into automotive exhaust systems, kitchenware and cookware, industrial equipment, construction and architecture, electrical appliances, energy generation, and other applications (hydrogen electrolyzer plates, etc.). By end-use industry, the market is segmented into automotive and transportation, building and construction, consumer goods, industrial machinery, energy and power, aerospace and defense, and other end-user industries (healthcare, etc.). The report also covers the market size and forecasts for stainless steel 400 series in 17 countries across major regions. The market sizes and forecasts are provided in trems of volume (tons).
| 409 |
| 410 |
| 420 |
| 430 |
| 440 |
| Other Grades (446, etc.) |
| Sheets and Plates |
| Coils |
| Bars and Rods |
| Pipes and Tubes |
| Other Product Types (Ultra-thin foil, etc.) |
| Automotive Exhaust Systems |
| Kitchenware and Cookware |
| Industrial Equipment |
| Construction and Architecture |
| Electrical Appliances |
| Energy Generation |
| Other Applications (Hydrogen Electrolyzer Plates, etc.) |
| Automotive and Transportation |
| Building and Construction |
| Consumer Goods |
| Industrial Machinery |
| Energy and Power |
| Aerospace and Defense |
| Other End-user Industries (Healthcare, etc.) |
| Asia-Pacific | China |
| Japan | |
| India | |
| South Korea | |
| ASEAN Countries | |
| Rest of Asia-Pacific | |
| North America | United States |
| Canada | |
| Mexico | |
| Europe | Germany |
| United Kingdom | |
| France | |
| Italy | |
| Spain | |
| Russia | |
| NORDIC Countries | |
| Rest of Europe | |
| South America | Brazil |
| Argentina | |
| Rest of South America | |
| Middle-East and Africa | Saudi Arabia |
| South Africa | |
| Rest of Middle-East and Africa |
| By Grade | 409 | |
| 410 | ||
| 420 | ||
| 430 | ||
| 440 | ||
| Other Grades (446, etc.) | ||
| By Product Type | Sheets and Plates | |
| Coils | ||
| Bars and Rods | ||
| Pipes and Tubes | ||
| Other Product Types (Ultra-thin foil, etc.) | ||
| By Application | Automotive Exhaust Systems | |
| Kitchenware and Cookware | ||
| Industrial Equipment | ||
| Construction and Architecture | ||
| Electrical Appliances | ||
| Energy Generation | ||
| Other Applications (Hydrogen Electrolyzer Plates, etc.) | ||
| By End-User Industry | Automotive and Transportation | |
| Building and Construction | ||
| Consumer Goods | ||
| Industrial Machinery | ||
| Energy and Power | ||
| Aerospace and Defense | ||
| Other End-user Industries (Healthcare, etc.) | ||
| By Geography | Asia-Pacific | China |
| Japan | ||
| India | ||
| South Korea | ||
| ASEAN Countries | ||
| Rest of Asia-Pacific | ||
| North America | United States | |
| Canada | ||
| Mexico | ||
| Europe | Germany | |
| United Kingdom | ||
| France | ||
| Italy | ||
| Spain | ||
| Russia | ||
| NORDIC Countries | ||
| Rest of Europe | ||
| South America | Brazil | |
| Argentina | ||
| Rest of South America | ||
| Middle-East and Africa | Saudi Arabia | |
| South Africa | ||
| Rest of Middle-East and Africa | ||


Key Questions Answered in the Report
What is the projected global volume of stainless steel 400 series in 2031?
Volume is forecast to rise to 4.33 million tons by 2031 on a 4.88% CAGR trajectory.
Which grade currently dominates ferritic stainless demand in automotive exhausts?
Grade 409 leads, holding 41.11% share in 2025 thanks to its low-nickel, cost-efficient chemistry.
How fast is Asia-Pacific consumption of 400-series stainless expanding?
Regional tonnage is advancing at a 5.72% CAGR through 2031, supported by Chinese infrastructure and appliance-replacement programs.
What segment should post the quickest growth through 2031?
Energy generation applications, chiefly green-hydrogen electrolyzer plates and solid-oxide fuel-cell foils, are projected to expand at a 5.81% CAGR.
Page last updated on:


