Crude Steel Market Size and Share
Market Overview
| Study Period | 2020 - 2031 |
|---|---|
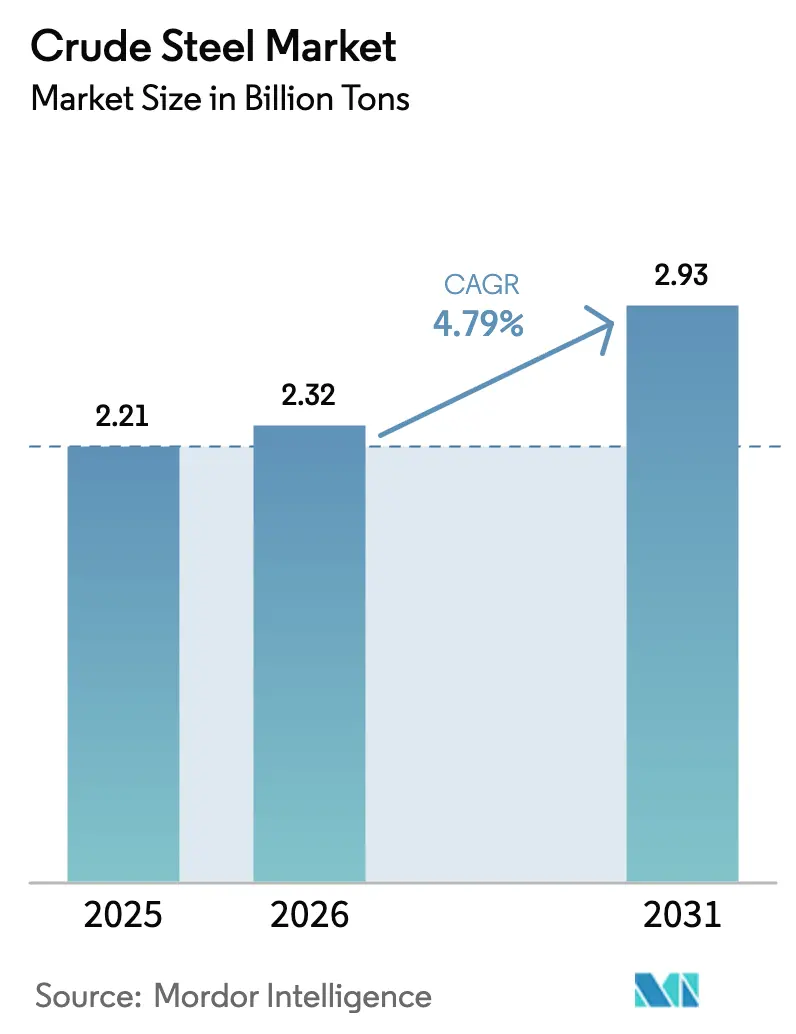
| Market Volume (2026) | 2.32 Billion tons |
| Market Volume (2031) | 2.93 Billion tons |
| Growth Rate (2026 - 2031) | 4.79% CAGR |
| Fastest Growing Market | Asia-Pacific |
| Largest Market | Asia-Pacific |
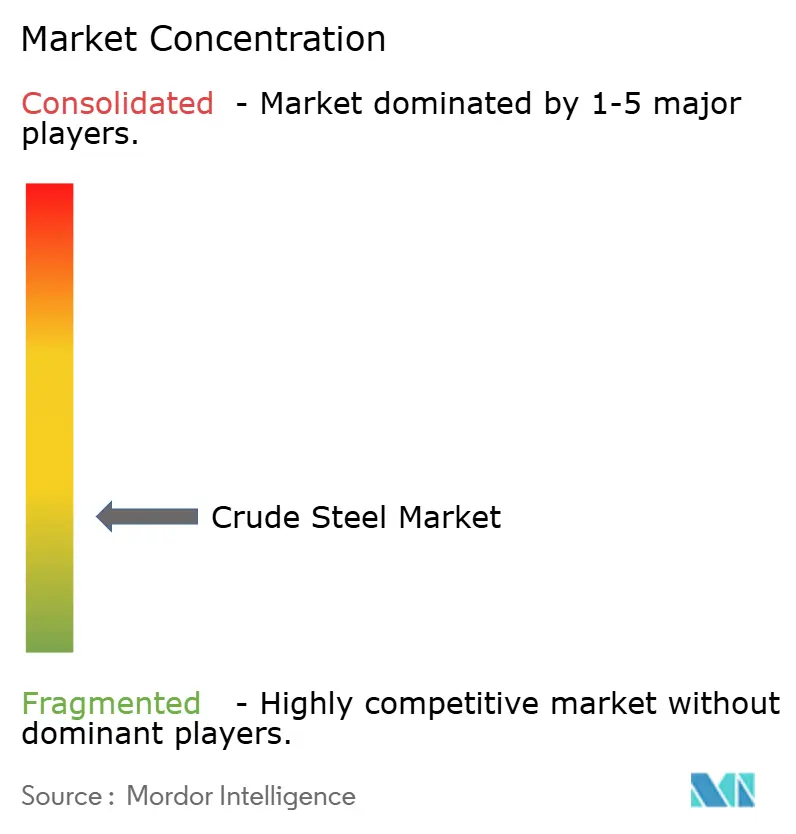
| Market Concentration | Low |
Major Players *Disclaimer: Major Players sorted in no particular order Image © Mordor Intelligence. Reuse requires attribution under CC BY 4.0. | |
Crude Steel Market Analysis by Mordor Intelligence
Crude Steel market size in 2026 is estimated at 2.32 billion tons, growing from 2025 value of 2.21 billion tons with 2031 projections showing 2.93 billion tons, growing at 4.79% CAGR over 2026-2031. Electric-arc-furnace (EAF) technology is steadily displacing blast-furnace/basic-oxygen-furnace (BOF) routes as decarbonization targets tighten, scrap collection systems mature, and renewable electricity becomes more affordable. Asia-Pacific commands the bulk of demand through large-scale urban infrastructure programs, while India’s capacity expansion and ASEAN mega-projects increasingly counterbalance China’s easing property cycle. End-user trends show public infrastructure and housing absorbing more than half of annual volume, with transportation electrification, machinery upgrades, and renewable-energy build-outs adding incremental tonnage. Competitive dynamics are shaped by a wave of EAF investments, hydrogen-based direct-reduction pilots, and headline acquisitions that aim to secure low-carbon production footprints in anticipation of carbon-border levies and buyer decarbonization mandates. Integrated producers therefore channel record capital into furnace conversions, electrical-steel lines, and process-heat solutions to hedge against future asset stranding and green-premium uncertainty.
Key Report Takeaways
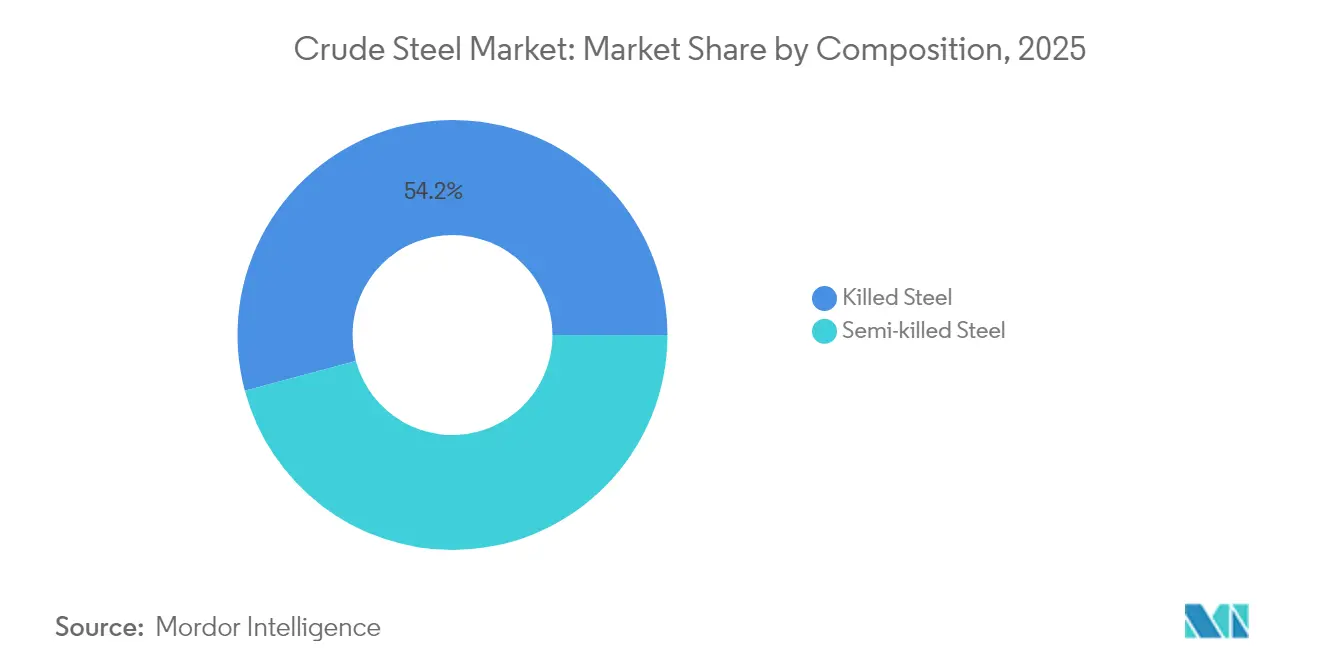
- By composition, killed steel held 54.18% of the crude steel market share in 2025; semi-killed grades are forecast to expand at a 4.9% CAGR to 2031.
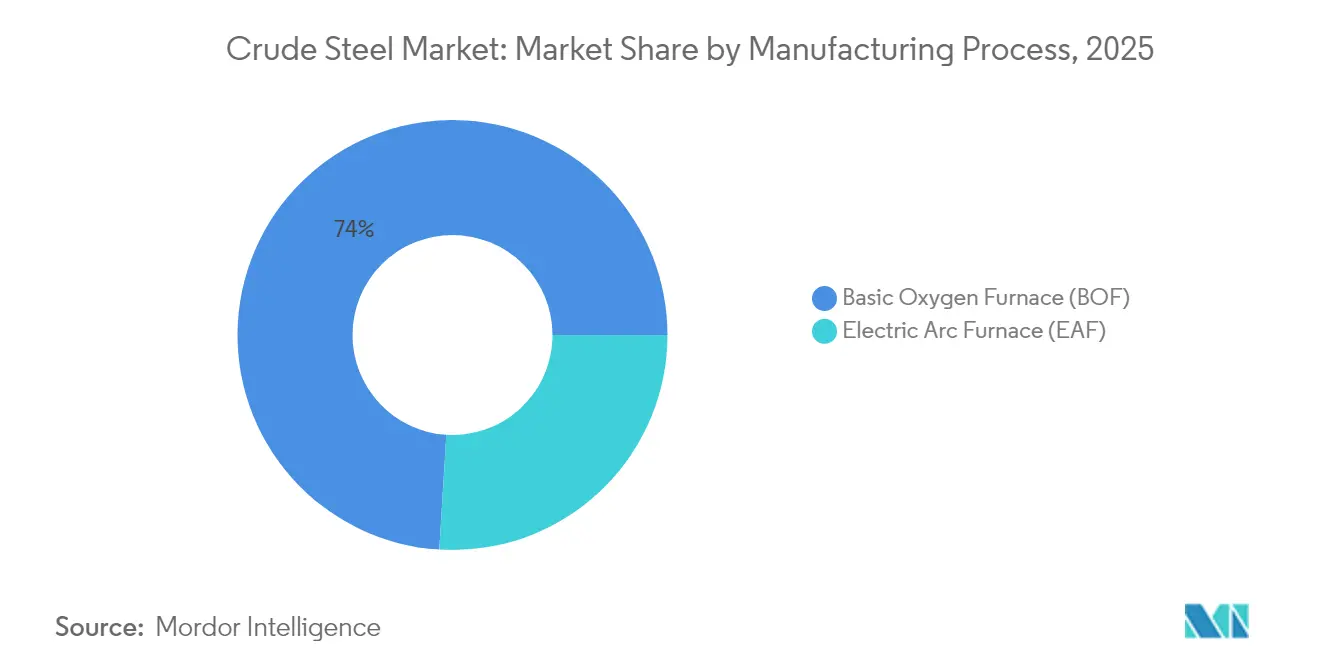
- By manufacturing process, the Basic Oxygen Furnace (BOF) segment retained 74.02% revenue share in 2025, while Electric Arc Furnace (EAF) is projected to grow at a 5.03% CAGR through 2031.
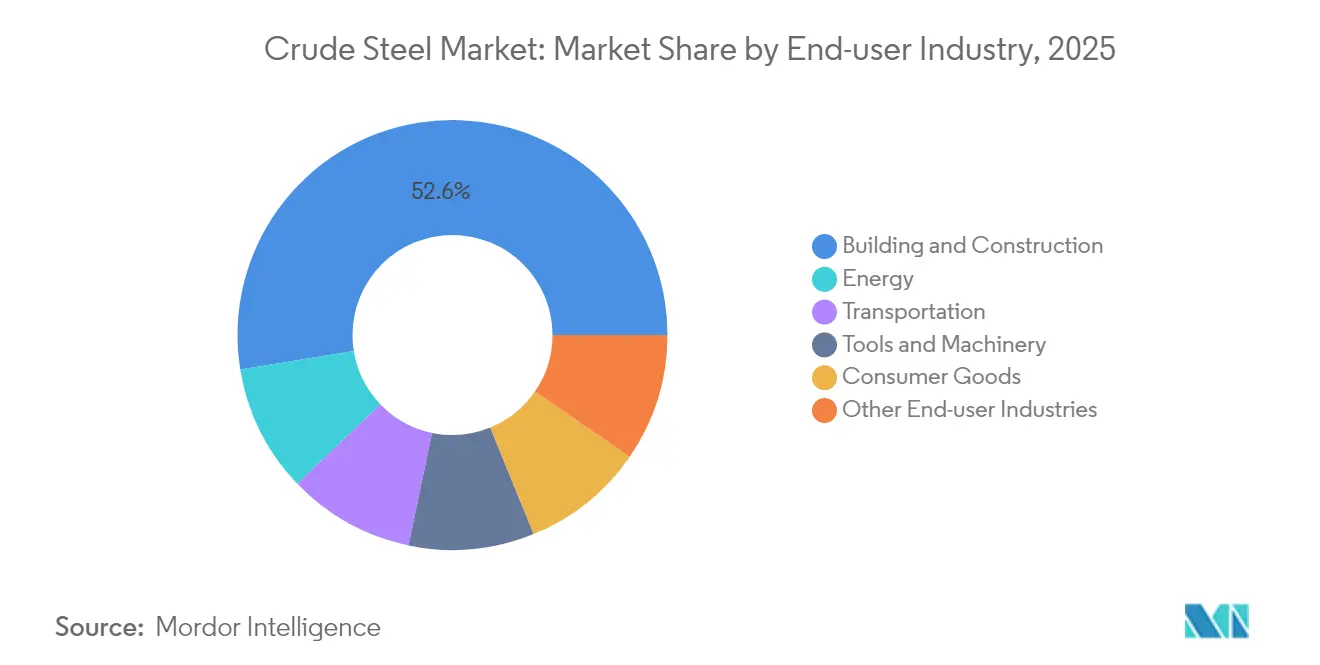
- By end-user industry, building and construction accounted for 52.56% of the crude steel market size in 2025 and is poised to rise at a 4.95% CAGR between 2026-2031.
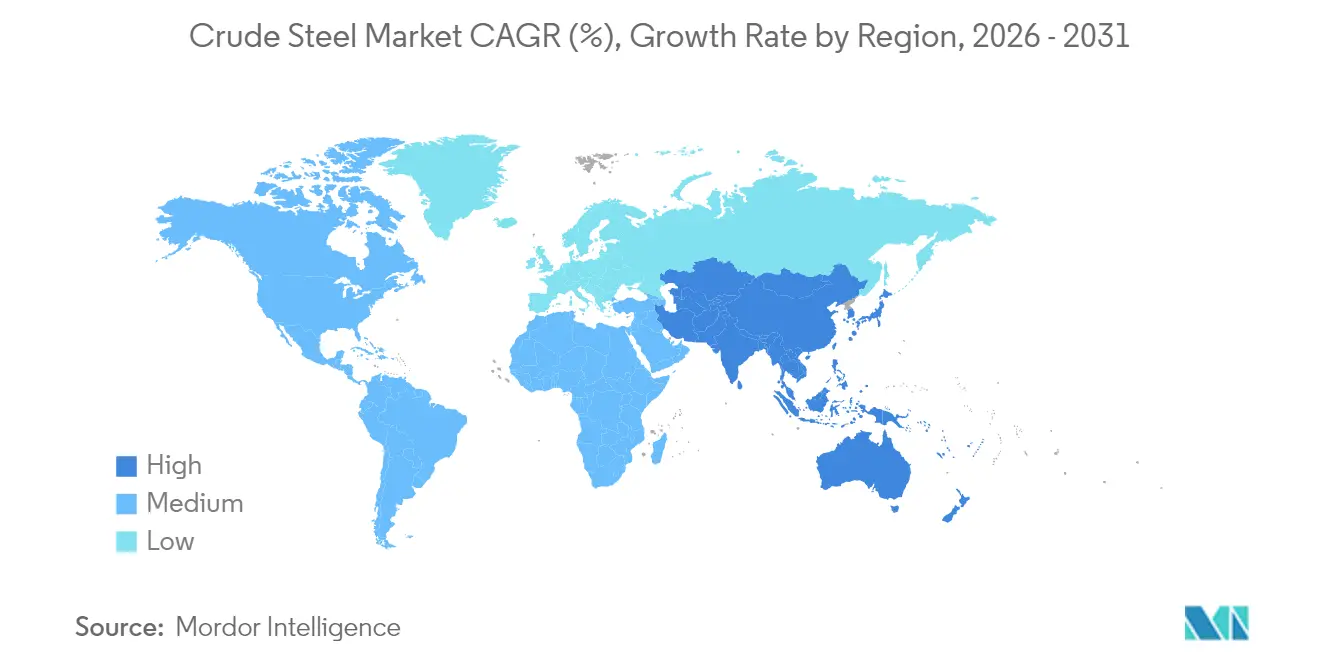
- By geography, Asia-Pacific captured 73.52% volume share in 2025; the region advancing at a 4.86% CAGR through 2031.
Note: Market size and forecast figures in this report are generated using Mordor Intelligence’s proprietary estimation framework, updated with the latest available data and insights as of 2026.
Global Crude Steel Market Trends and Insights
Drivers Impact Analysis*
| Driver | (~) % Impact on CAGR Forecast | Geographic Relevance | Impact Timeline |
|---|---|---|---|
| Decarbonisation-Linked Capex Race Among Top 20 Steelmakers | +1.7% | Global, with EU and Japan leading | Long term (≥ 4 years) |
| Construction Super-Cycle in India and ASEAN Through 2030 | +0.8% | APAC core, spill-over to MEA | Medium term (2-4 years) |
| Automotive Lightweighting Push Reviving Value-Added Flat Steel | +0.6% | Global, concentrated in automotive hubs | Medium term (2-4 years) |
| Green-Hydrogen Project Pipelines Lowering Long-Run Power Cost | +0.4% | EU, Japan, Australia, select US regions | Long term (≥ 4 years) |
| Rapid Build-Out of Small Modular Reactors for Process Heat | +0.3% | North America, select European markets | Long term (≥ 4 years) |
| Source: Mordor Intelligence | |||
Decarbonization-Linked Capex Race Among Top 20 Steelmakers
More than USD 200 billion has been earmarked for low-carbon furnace conversions, hydrogen-based direct-reduction units, and electrical-steel lines scheduled for completion before 2030[1]ArcelorMittal, “ArcelorMittal to Build Electrical Steel Plant in Alabama,” arcelormittal.com . ArcelorMittal’s USD 1.2 billion electrical-steel plant in Alabama and thyssenkrupp’s tkH2Steel program targeting a 30% CO₂ cut by 2030 highlight the first-mover premium. Pilot operations scheduled for early 2026 are expected to validate cost parity with conventional routes once renewable electricity prices converge with fossil alternatives. Early adopters gain price-negotiation leverage with automotive and appliance buyers eager to shrink Scope 3 emissions, while late movers risk stranded blast-furnace assets under tightening carbon-border taxes.
Construction Super-Cycle in India and ASEAN Through 2030
India’s target of boosting installed crude-steel capacity to 500 million tons by 2047 anchors a regional boom in long and structural steel, underpinned by domestic iron-ore output that rose to 318 million tons in 2025. Parallel ASEAN megaprojects—such as Indonesia’s Nusantara capital and Thailand’s Eastern Economic Corridor—collectively require more than 50 million tons in the current decade. Regional investors led by SteelAsia are deploying PHP 65 billion across multiple EAF lines to shorten supply chains and capture value-added fabrication. Sustained growth rests on continued fiscal spending and foreign-direct-investment inflows, although interest-rate cycles and raw-material price swings pose downside risk.
Automotive Lightweighting Push Reviving Value-Added Flat Steel
Electric-vehicle penetration is reshaping sheet demand toward electrical-steel grades used in traction motors while reinforcing the need for advanced high-strength steels in crash structures. ArcelorMittal’s 150,000-ton annual capacity in Alabama directly targets U.S. automakers aiming to localize supply of non-grain-oriented electrical steel. Premiums of 20-30% over commodity hot-rolled coil enhance mill margins but require tight control of silicon and aluminum additions. Ultra-high-strength steels also allow designers to replace thicker conventional gauges, paradoxically increasing steel intensity per vehicle by merging weight savings with safety regulations.
Green-Hydrogen Project Pipelines Lowering Long-Run Power Cost
IEA modeling shows delivered green-hydrogen prices falling to USD 1.3–3.5/kg by 2030, at which point hydrogen-based sponge iron competes with coking-coal routes in jurisdictions exposing steel to carbon costs above USD 90/tCO₂. Steelmakers securing long-term power-purchase agreements for on-site electrolysis gain protection from future grid volatility and lock in a decarbonization narrative valued by capital markets. Renewable-rich locations such as Australia’s Pilbara or Spain’s Andalusia therefore attract integrated hydrogen-steel clusters, giving nearby mills a structural cost edge.
Restraints Impact Analysis*
| Restraint | (~) % Impact on CAGR Forecast | Geographic Relevance | Impact Timeline |
|---|---|---|---|
| Slower-Than-Expected Chinese Real-Estate Recovery | -0.9% | Global, with strongest impact in APAC | Short term (≤ 2 years) |
| Trade-Remedy Proliferation Hampering Cross-Border Flows | -0.5% | Global, particularly US-China-EU corridors | Medium term (2-4 years) |
| Green-Premia Uncertainty Delaying Offtake Agreements | -0.4% | EU, North America, developed markets | Medium term (2-4 years) |
| Source: Mordor Intelligence | |||
Slower-Than-Expected Chinese Real-Estate Recovery
Monthly new-home sales in China fell 37.7% year-on-year in September 2024, trimming residential-steel demand that had already halved from its 2019 peak of 296 million tons. The resulting export push by Chinese mills depresses regional prices and sparks trade friction, particularly in Southeast Asia. Long-term demand destruction is tied to demographic plateauing and higher vacancy rates, pointing to a structural rather than cyclical adjustment.
Trade-Remedy Proliferation Hampering Cross-Border Flows
The United States reinstated a 25% Section 232 tariff on steel in March 2025, and the EU expanded safeguard quotas to curb inflows by 15% starting April 2025. China, for its part, tightened export-tax rebate rules in April 2025, raising compliance costs for foreign buyers. These actions fragment a once-borderless commodity market, forcing downstream users to regionalize sourcing and eroding economies of scale in specialized long and flat products.
*Our forecasts treat driver/restraint impacts as directional, not additive. The impact forecasts reflect baseline growth, mix effects, and variable interactions.
Segment Analysis
By Composition: Killed Steel Dominates Continuous Casting Applications
Killed steel captured 54.18% of the crude steel market share in 2025, reflecting its indispensability to continuous casting lines that account for nearly all modern slab production. Aluminum and silicon deoxidizers suppress gas evolution, which minimizes surface voids and improves yield. Semi-killed grades are expected to outpace overall growth at a 4.9% CAGR through 2031 as automakers seek controlled chemical segregation for lightweight chassis components. Rimmed and capped steels continue to serve niche sheet and strip use cases but remain in structural decline as integrated mills prioritize yield and cleanliness.
EAF operators increasingly specify killed grades to maximize alloy recovery and reduce rework, reinforcing the segment’s predominance. Meanwhile, semi-killed steel’s rising profile aligns with automakers’ transition to advanced high-strength steels requiring precise micro-alloying. Regulatory factors exert minimal direct influence on composition choice, though energy-intensity considerations encourage mills to streamline deoxidation practices and recover aluminum additions for economic gain.


By Manufacturing Process: EAF Growth Challenges BOF Dominance
BOF routes held a commanding 74.02% of 2025 output but face relentless share erosion as EAF installations log a 5.03% CAGR to 2031. JFE Steel’s USD 2.26 billion large-EAF project and Hyundai Steel’s USD 5.8 billion Louisiana mill illustrate the capital reallocation toward scrap-based, lower-carbon production. Carbon-adjusted cost models show EAF emitting roughly 75% less CO₂ per ton versus BOF, a gap that widens under carbon-border levies.
EAF’s modularity also lets producers add capacity in 500,000-ton increments, aligning supply with regional demand without multibillion-dollar blast-furnace overbuilds. BOF retains a foothold in ultra-low-residual grades for cans, transformers, and pipeline steel, yet hydrogen-based direct-reduction furnaces coupled with EAF melting threaten even that last redoubt. Over the forecast horizon, hybrid operations blending EAF melt shops with BOS converters may emerge as a transitional architecture before full blast-furnace retirements.
By End-User Industry: Construction Drives Volume Growth
Building and construction applications absorbed 52.56% of global tonnage in 2025 and are forecast to grow at 4.95% annually through 2031, underpinning the crude steel market size expansion. India’s highway, metro, and green-energy corridors account for a large proportion of the incremental demand, while ASEAN governments bankroll urban-transit and logistics-hub agendas. Transportation ranks second, fueled by vehicle electrification and rail-network upgrades that prefer high-tensile flat and long products.
Machinery and equipment segments benefit from factory automation and renewable-energy component orders, whereas consumer goods remain steady in white-goods and electronics casings. Energy applications accelerate via wind-tower fabrication and grid-expansion steels, especially in offshore installations requiring heavy plate. As economies mature, the demand mix is projected to lean toward transportation and high-value energy infrastructure, though base construction volumes will still anchor order books for most regional producers.
Geography Analysis
Asia-Pacific accounted for 73.52% of 2025 shipments and is projected to grow at 4.86% CAGR to 2031, supported by India’s planned scale-up to 500 million tons of annual capacity and ASEAN construction pipelines. China’s housing-driven soft patch generates a surplus that increasingly targets export markets, prompting anti-dumping actions across South Asia and Latin America. Japan and South Korea shift focus to electrical-steel specialisms and hydrogen-ready furnaces backed by strong governmental subsidies.
North America’s demand outlook brightens under the Bipartisan Infrastructure Law and the Inflation Reduction Act, though the region’s supply side is consolidating around headline deals such as Nippon Steel’s USD 14.9 billion take-over of U.S. Steel. Abundant scrap and renewable electricity create fertile ground for EAF capacity, with Canada leveraging hydro-powered grids and Mexico capturing reshoring-induced auto-steel orders.
Europe combats energy-price headwinds via efficiency upgrades, EU steel fund grants, and carbon-border tariffs aimed at leveling imports. South America and Middle East-Africa present mid-single-digit growth rooted in infrastructure and resource-processing plants, though financing constraints limit project pipelines. Regionalization of supply chains, triggered by freight-cost inflation and Scope 3 accounting, is a unifying theme influencing mill location and product-mix decisions worldwide.

Competitive Landscape
Global supply is moderately fragmented: the ten largest groups hold roughly 49% of output, giving the rest of the crude steel market room for regional specialists and pure-play EAF operators to thrive. Integrated giants such as China Baowu, ArcelorMittal, and Nippon Steel retain upstream iron-ore or metallurgical-coal assets that shelter them from raw-material shocks. However, rising carbon costs erode the advantage of blast-furnace scale, allowing nimble scrap-based producers to capture automotive and appliance contracts demanding low-carbon footprints.
Strategic maneuvers include Nippon Steel’s acquisition of U.S. Steel, Cleveland-Cliffs’ bid for NLMK USA, and Tata Steel’s expansion at Kalinganagar—all designed to anchor local downstream clients and upgrade product portfolios. Technology differentiation intensifies as mills unveil hydrogen DRI pilots, digital twin rollouts, and carbon-capture retrofits aimed at meeting corporate climate pledges. Electrical-steel capacity is a new battleground, with ArcelorMittal’s Alabama plant and POSCO’s expansions in Korea targeting EV motor laminations as a high-margin niche.
Supply visibility and circular-economy credentials increasingly influence contract awards, pushing mills to integrate scrap-collection networks and traceability platforms. As automakers and appliance brands sign multi-year off-take agreements for green steel, producers that can certify emissions below 0.6 tCO₂/t hot-rolled coil command 15-20% mark-ups. Competitive advantage therefore migrates from sheer tonnage to sustainability performance, technology readiness, and regional proximity to demand centers.
Crude Steel Industry Leaders
ArcelorMittal
China BaoWu Steel Group Corporation Limited
China Ansteel Group Corporation Limited
Nippon Steel Corporation
Jiangsu Shagang Group
- *Disclaimer: Major Players sorted in no particular order

Recent Industry Developments
- April 2025: JFE Steel Corporation invested USD 2.26 billion in a new electric arc furnace at its Kurashiki plant in Japan, aiming for a 2 million-ton capacity with operations starting mid-2028. The project, supported by a government green transformation fund, marks JFE Steel's transition toward lower-carbon production through electricity and scrap steel utilization, positioning it as the first mass producer of high-quality steel globally.
- March 2025: Hyundai Steel announced a USD 5.8 billion investment for an electric arc furnace-based integrated steel mill in Donaldsonville, Louisiana, with commercial production scheduled to begin in 2029. The facility will have an annual steel production capacity of 2.7 million metric tons, incorporating advanced technologies for efficient steel manufacturing.


Global Crude Steel Market Report Scope
Crude steel is the initial, untreated form of steel derived from the reduction of iron ore in a blast furnace. During this process, iron ore undergoes smelting to extract elemental iron, which is then alloyed with small amounts of carbon and other elements. The resulting crude steel may contain impurities and alloying elements that need further refinement and processing to achieve desired properties before it can be used in various industrial applications.
The crude steel market is segmented by composition, manufacturing process, end-user industry, and geography. By composition, the market is segmented into killed steel and semi-killed steel. By manufacturing process, the market is segmented into basic oxygen furnaces (BOF) and electric arc furnaces (EAF). By end-user industry, the market is segmented into building and construction, transportation, tools and machinery, energy, consumer goods, and other end-user industries (railways, defense, and others). The report also covers the market sizes and forecasts for the crude steel market in 27 countries across the central regions. The market sizes and forecasts for each segment are provided in terms of volume (million tons) and revenue (USD).
| Killed Steel |
| Semi-killed Steel |
| Basic Oxygen Furnace (BOF) |
| Electric Arc Furnace (EAF) |
| Building and Construction |
| Transportation |
| Tools and Machinery |
| Energy |
| Consumer Goods |
| Other End-user Industries |
| Asia-Pacific | China |
| India | |
| Japan | |
| South Korea | |
| ASEAN Countries | |
| Rest of Asia-Pacific | |
| North America | United States |
| Canada | |
| Mexico | |
| Europe | Germany |
| United Kingdom | |
| France | |
| Italy | |
| Russia | |
| NORDIC Countries | |
| Rest of Europe | |
| South America | Brazil |
| Argentina | |
| Rest of South America | |
| Middle East and Africa | Saudi Arabia |
| South Africa | |
| Rest of Middle East and Africa |
| By Composition | Killed Steel | |
| Semi-killed Steel | ||
| By Manufacturing Process | Basic Oxygen Furnace (BOF) | |
| Electric Arc Furnace (EAF) | ||
| By End-user Industry | Building and Construction | |
| Transportation | ||
| Tools and Machinery | ||
| Energy | ||
| Consumer Goods | ||
| Other End-user Industries | ||
| By Geography | Asia-Pacific | China |
| India | ||
| Japan | ||
| South Korea | ||
| ASEAN Countries | ||
| Rest of Asia-Pacific | ||
| North America | United States | |
| Canada | ||
| Mexico | ||
| Europe | Germany | |
| United Kingdom | ||
| France | ||
| Italy | ||
| Russia | ||
| NORDIC Countries | ||
| Rest of Europe | ||
| South America | Brazil | |
| Argentina | ||
| Rest of South America | ||
| Middle East and Africa | Saudi Arabia | |
| South Africa | ||
| Rest of Middle East and Africa | ||


Key Questions Answered in the Report
What is the projected global crude steel market size by 2031?
It is expected to reach 2.93 billion tons by 2031, growing at a 4.79% CAGR from 2026 levels.
Which segment holds the largest share of crude steel demand?
Building and construction applications accounted for 52.56% of 2025 volume and remain the primary demand driver through 2031.
Why is EAF capacity growing faster than BOF capacity?
EAF plants emit about 75% less CO₂, rely on abundant scrap, and qualify for green-steel premiums, leading to a 5.03% CAGR to 2031.
How are trade remedies affecting global steel flows?
Tariffs and safeguard measures in the U.S. and EU are regionalizing supply chains and compelling buyers to source locally.
Page last updated on:


