Spirometers Market Size and Share
Market Overview
| Study Period | 2020 - 2031 |
|---|---|
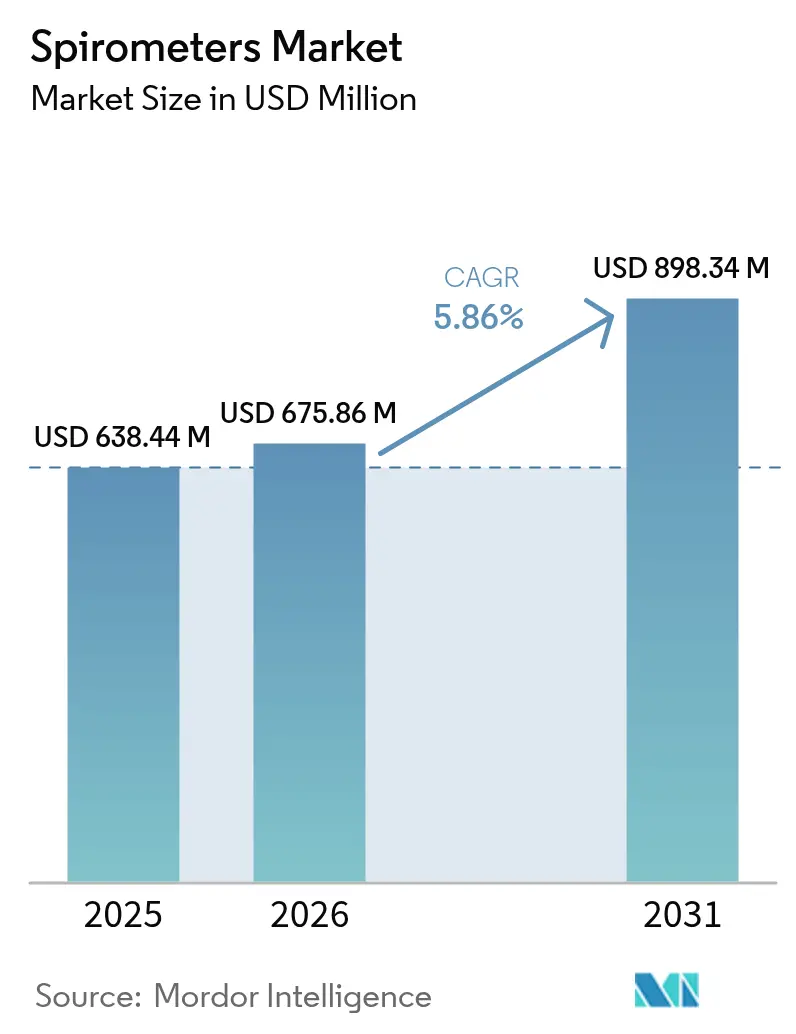
| Market Size (2026) | USD 675.86 Million |
| Market Size (2031) | USD 898.34 Million |
| Growth Rate (2026 - 2031) | 5.86% CAGR |
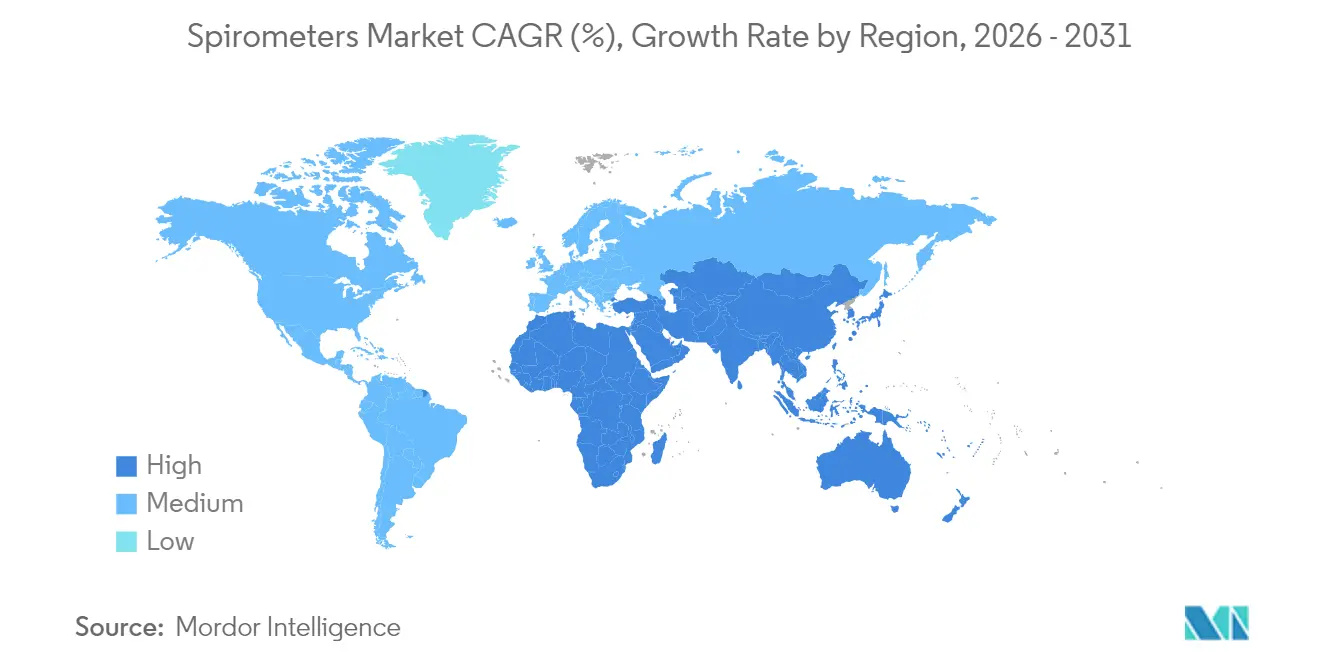
| Fastest Growing Market | Asia-Pacific |
| Largest Market | North America |
| Market Concentration | Medium |
Major Players *Disclaimer: Major Players sorted in no particular order Image © Mordor Intelligence. Reuse requires attribution under CC BY 4.0. | |
Spirometers Market Analysis by Mordor Intelligence
Spirometers Market size in 2026 is estimated at USD 675.86 million, growing from 2025 value of USD 638.44 million with 2031 projections showing USD 898.34 million, growing at 5.86% CAGR over 2026-2031.
The expansion reflects growing respiratory disease prevalence, tighter environmental regulation, and rapid technology adoption in point-of-care and remote settings. COPD’s heavy global burden, tighter PM2.5 limits, and employers’ wellness programs continue to stimulate testing demand. Parallel advances in smartphone-linked micro-spirometers, AI-based analytics, and ultrasonic sensors strengthen clinical confidence while broadening use beyond tertiary hospitals. Strategic acquisitions among established vendors, coupled with new entrants focused on digital health, suggest sustained innovation and orderly competitive maturation.
Key Report Takeaways
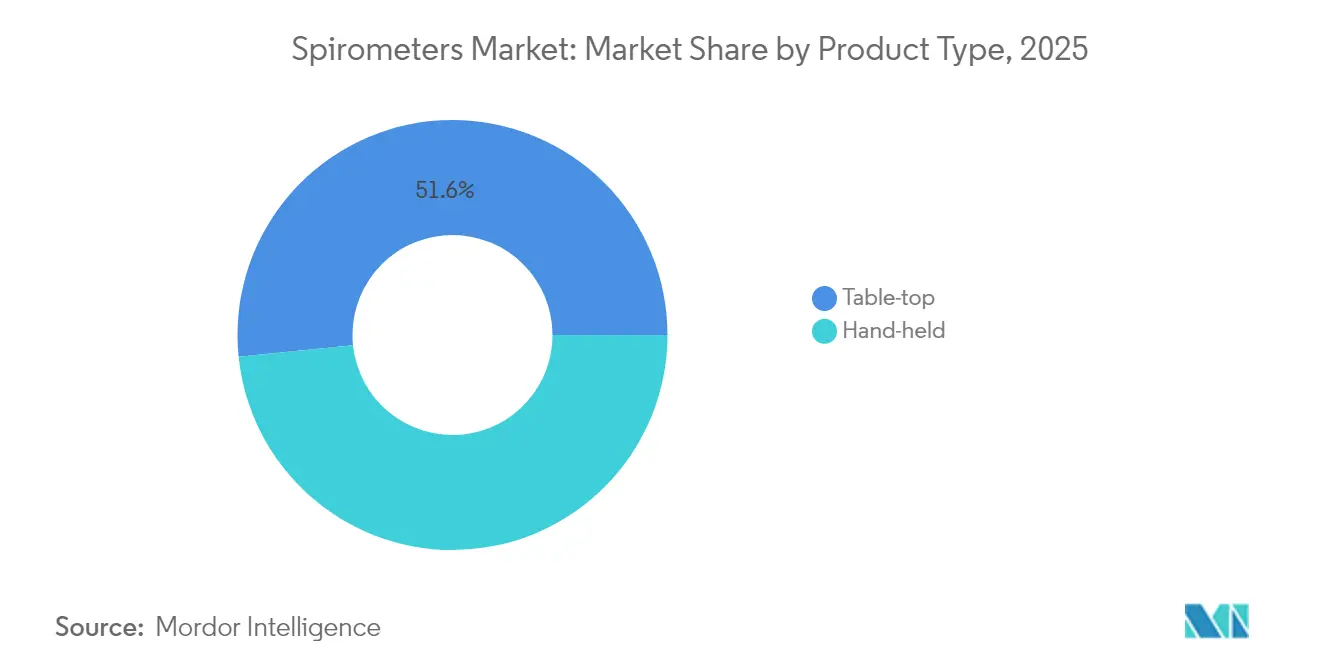
- By product type, table-top systems led with 51.62% revenue share in 2025; hand-held devices are projected to post the fastest 7.71% CAGR through 2031.
- By technology, flow measurement dominated with 53.12% of the spirometers market share in 2025, whereas volume measurement is on track for the highest 10.98% CAGR to 2031.
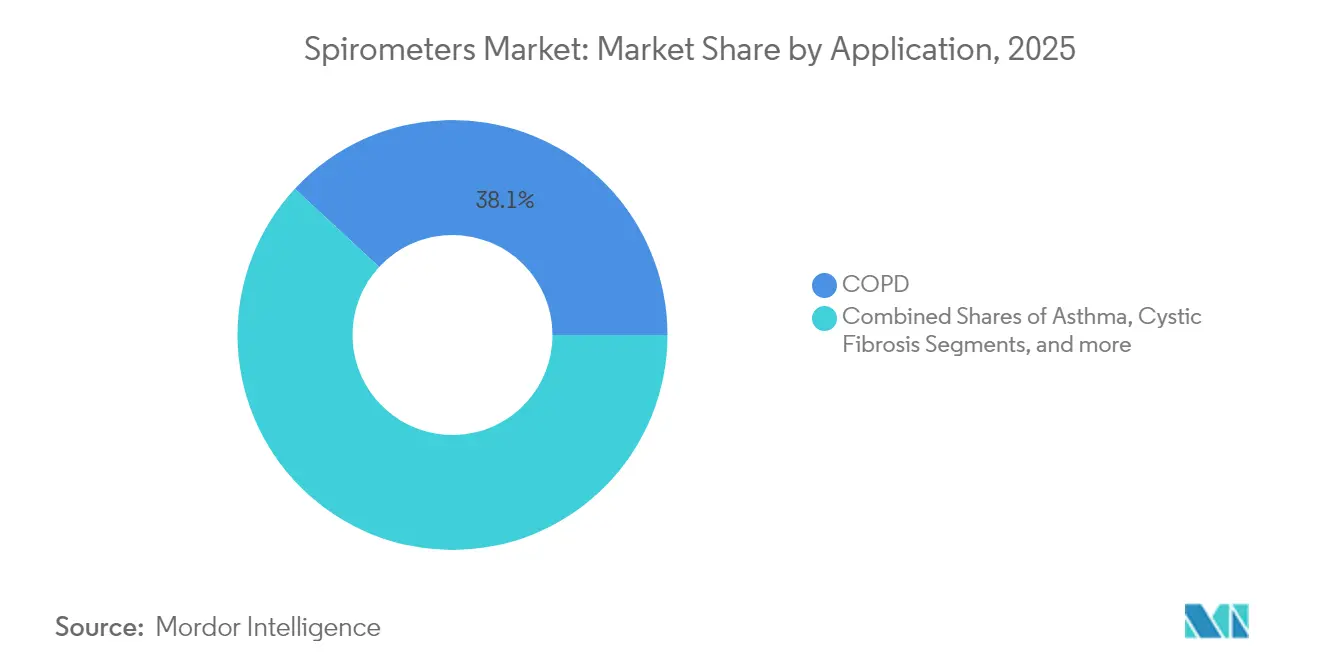
- By application, COPD retained 38.10% share of the spirometers market size in 2025, while asthma monitoring is poised for a 9.31% CAGR through 2031.
- By end-user, hospitals and clinics accounted for 50.62% share in 2025, yet home healthcare will expand at an 7.94% CAGR to 2031.
- By geography, North America commanded 37.05% revenue in 2025; Asia-Pacific is forecast to record the quickest 10.89% CAGR between 2026 and 2031.
Note: Market size and forecast figures in this report are generated using Mordor Intelligence’s proprietary estimation framework, updated with the latest available data and insights as of 2026.
Global Spirometers Market Trends and Insights
Drivers Impact Analysis*
| Driver | (~) % Impact on CAGR Forecast | Geographic Relevance | Impact Timeline |
|---|---|---|---|
| COPD prevalence surge in low- & middle-income countries | +1.8% | Global, concentrated in APAC & LAMEA | Long term (≥ 4 years) |
| Ambient-air quality regulation tightening | +1.2% | North America & EU, expanding globally | Medium term (2-4 years) |
| Smartphone-linked micro-spirometers gain clinical acceptance | +1.5% | Global, led by North America & Europe | Short term (≤ 2 years) |
| Employer-funded wellness screening programs | +0.8% | North America & developed APAC markets | Medium term (2-4 years) |
| AI algorithms for remote FEV₁ trending & adherence alerts | +1.3% | Global, technology-forward markets | Short term (≤ 2 years) |
| ESG-driven hospital decarbonisation budgets | +0.7% | Europe & North America, expanding to APAC | Long term (≥ 4 years) |
| Source: Mordor Intelligence | |||
COPD prevalence surge drives diagnostic infrastructure expansion
The global COPD patient pool ranges between 213 million and 454 million, with prevalence peaking at 13.1% among adults over 40 in developing economies compared with 8.5% in developed markets. Intensifying exposure to biomass combustion and industrial pollutants magnifies disease incidence and encourages governments to deploy outreach screening. India’s SAVE program screened 15,602 residents and confirmed 1,154 chronic respiratory diagnoses using portable “PFT in a Box” devices, proving the feasibility of large-scale community testing and underscoring latent demand for cost-effective solutions.
Smartphone integration accelerates clinical adoption
FDA clearance of NuvoAir’s Bluetooth-enabled home spirometer in January 2024 validated remote testing workflows. Peer-reviewed trials reported correlation coefficients above 0.994 for FEV1 and 0.993 for FVC versus laboratory reference systems. Real-time data transfer into electronic records shortens decision cycles, and 95% of cystic-fibrosis centers now prescribe home spirometers, with 88% citing quality-of-care gains.
AI-powered analytics transform respiratory care
Machine-learning platforms such as COPDPredict offer automated exacerbation alerts with high sensitivity, supporting preventive intervention.[1]BMJ Publishing Group, “COPDPredict validation study,” bmj.com Respira Labs’ wearable Sylvee device secured Medicare reimbursement for continuous COPD monitoring, pairing acoustic resonance with cloud analytics. These advances re-cast spirometers from diagnostic tools into longitudinal health-management nodes, especially in telehealth ecosystems.
Ambient air quality regulations drive workplace screening
The US EPA trimmed the annual PM2.5 limit to 9.0 µg/m³ in 2024, compelling employers to intensify respiratory surveillance.[2]Federal Register, “National Ambient Air Quality Standards for Particulate Matter; Final Rule,” federalregister.gov OSHA mandates spirometry for workers exposed to 14 hazardous agents, anchoring recurring demand in construction, mining, and chemical industries. Academic evidence linking benzene exposure with impaired lung function strengthens the case for proactive occupational screening.
Restraints Impact Analysis*
| Restraint | (~) % Impact on CAGR Forecast | Geographic Relevance | Impact Timeline |
|---|---|---|---|
| Device inaccuracy due to poor calibration compliance | -1.1% | Global, particularly emerging markets | Short term (≤ 2 years) |
| Reimbursement gaps outside OECD | -0.9% | LAMEA & developing APAC | Long term (≥ 4 years) |
| Shortage of trained respiratory technologists | -0.7% | Global, acute in rural areas | Medium term (2-4 years) |
| Data-privacy concerns around cloud PFT platforms | -0.5% | Europe & North America | Medium term (2-4 years) |
| Source: Mordor Intelligence | |||
Device calibration challenges undermine clinical confidence
Variability among low-cost turbines erodes diagnostic reliability; some portables drift outside acceptable limits within six months. Ultrasonic sensors remove moving parts and lessen maintenance, but higher price points and regulatory lag defer mass uptake.
Reimbursement disparities limit global market penetration
OECD nations reimburse spirometry under standardized CPT codes, whereas many emerging markets lack structured funding, forcing patients to pay out of pocket.[3]Center for Medicare & Medicaid Services, “Pulmonary Function Testing Codes,” cms.gov The gap dampens uptake where respiratory disease is most prevalent, spurring philanthropic pilots yet underscoring the need for systemic finance reform.
*Our forecasts treat driver/restraint impacts as directional, not additive. The impact forecasts reflect baseline growth, mix effects, and variable interactions.
Segment Analysis
By Product Type: Portability Re-shapes Care Delivery
Table-top equipment retained 51.62% revenue in 2025, supported by multi-parameter testing and integration with hospital information systems. Their deep protocol catalog—bronchial challenge, respiratory muscle strength, and diffusing capacity—keeps them essential for pulmonology labs. Nonetheless, hand-held models are set to grow at a 7.71% CAGR, propelled by employer screenings, emergency triage, and home monitoring programs. The performance gap is narrowing; devices like HooHoo posted intraclass correlation scores above 0.887 versus lab reference instruments, satisfying ATS/ERS thresholds. Desktop-PC-attached units serve midsized clinics, marrying analytic software with modest portability.
Demand tilts toward lightweight solutions as reimbursement frameworks embrace remote care, and as clinicians favor quicker throughput. Battery life exceeding 30 hours, Bluetooth 5.0, and disposable mouthpieces align with infection-control mandates. Manufacturers answer with hybrid designs featuring detachable turbine heads, cloud dashboards, and automated acceptability grading. The shift indicates continued migration toward mobility without sacrificing accuracy, steering the spirometers market toward decentralized models.


By Technology: Ultrasonic Volume Sensors Gain Traction
Flow-based systems captured 53.12% of 2025 revenue, favored for real-time loop plotting and affordability. Turbine and Fleisch pneumotach designs dominate primary-care deployments, generating immediate flow-volume curves that underpin guideline-driven interpretation. Yet volume-measurement platforms led by ultrasonic arrays are climbing at an 10.98% CAGR. Their contactless architecture sidesteps condensation and microbial buildup, consequently cutting recalibration needs and boosting longevity.
The spirometers market size for ultrasonic technology is projected to expand as hospitals standardize on low-maintenance capital assets amid staffing constraints. Hybrid devices now combine differential pressure for low-flow accuracy with ultrasonic transit-time at higher ranges, improving linearity. Peak-flow meters keep a niche for pediatric asthma action plans due to simplicity and rock-bottom price. Over the forecast window, sensor miniaturization and AI-embedded firmware will reposition volume measurement as the premium standard, especially in infection-sensitive environments.
By Application: Digital Asthma Management Outpaces COPD
COPD sustained 38.10% share in 2025, cemented by GOLD guidelines that place spirometry at the diagnostic core and by payer policies conditioning inhaler coverage on lung-function confirmation. Employers now integrate spirometry into fit-for-duty exams for high-dust occupations, reinforcing repeat testing volumes. Nevertheless, the asthma segment is slated for a 9.31% CAGR, catalyzed by mobile health apps that gamify adherence and deliver personalized feedback. Randomized trials show home spirometry reduces emergency visits among moderate-to-severe asthmatics, while Bluetooth peak-flow trackers feed action-plan triggers straight to caregivers.
Cystic fibrosis programs leverage early childhood lung-volume indices to adjust antibiotic regimens, and 95% of US CF centers supplied tele-spirometers during the pandemic. Occupational lung disease screening, though smaller, is scaling in mining and ship-building hubs as silica and asbestos standards tighten. As AI combines spirometry with symptom diaries and air-quality feeds, application diversification will reinforce adoption across preventive to chronic-care settings.
By End-User: Home Healthcare Commands Growth Spotlight
Hospitals and clinics generated 50.62% of 2025 revenue thanks to comprehensive pulmonary laboratories and reimbursement alignment. Their dominance persists because complex testing—bronchodilator reversibility, methacholine challenge, and full lung volumes—demands controlled environments and licensed technologists. Yet home-care providers will chart the fastest 7.94% CAGR, buoyed by payers’ remote-patient-monitoring codes and post-discharge care bundles.
Study cohorts show 77% of COPD patients transmit FEV₁ readings on at least 70% of monitored days, enabling algorithmic alerts that reduce rehospitalizations. Diagnostic laboratories remain vital for clinical trials and pre-employment screenings, while ambulatory surgery centers increasingly purchase desktop spirometers for pre-operative risk stratification. The shifting mix underscores broader healthcare decentralization, with spirometers market participants tailoring device connectivity and user interfaces to non-specialist operators.
Geography Analysis
North America commanded 37.05% of 2025 sales, underpinned by Medicare coverage, employer wellness mandates, and early uptake of digital platforms. The U.S. OSHA framework obliges spirometry across 14 hazardous-substance standards, guaranteeing recurrent demand. Canada’s universal health plans reimburse baseline lung tests for smokers over 40, embedding spirometry in primary care. Advanced analytics vendors cluster around Boston and Silicon Valley, accelerating AI tool validation.
Europe follows with sustained investment driven by stringent ambient-air directives and ESG imperatives. The EU’s “Zero Pollution” roadmap and member-state carbon-neutral hospital targets fuel procurement of low-maintenance ultrasonic units. Germany’s DRG system reimburses pre-operative spirometry, while the UK’s NHS Long Term Plan funds remote monitoring pilots for severe asthma. Regional focus on privacy elevates demand for on-premise data-hosting options and GDPR-compliant encryption.
Asia-Pacific represents the growth engine, projected to notch an 10.89% CAGR. India’s SAVE initiative showcased scalable district-level deployments, while China’s Healthy China 2030 blueprint earmarks respiratory disease screening expansion across 3,300 county hospitals. Japan’s aging demographic drives per-capita testing volumes, complemented by government subsidies for home-monitoring kits. Southeast Asian economies experience rising occupational exposure amid construction booms, prompting corporate wellness investments.
Latin America and the Middle East & Africa together form an emerging opportunity frontier. Brazil’s Clean Air Act spawned industrial health audits requiring pulmonary testing, whereas Saudi Arabia’s Vision 2030 mandates employee health screenings in petrochemical corridors. However, fragmented reimbursement and shortages of trained technologists curb near-term penetration. Development banks and NGOs sponsor pilot projects using paper-based or smartphone-assisted devices to bridge accessibility gaps, laying groundwork for future scale-up.

Competitive Landscape
The competitive field remains moderately concentrated with a blend of century-old respiratory brands and agile digital specialists. Vitalograph, NDD Medical Technologies, and Vyaire Medical collectively dominate premium clinical markets through validated hardware, global distribution, and deep relationships with pulmonology societies. Vitalograph deepened its software analytics bench by acquiring Morgan Scientific in September 2024, adding enterprise PFT workflow tools. NDD’s EasyOne Air leverages ultrasonic technology to position itself as a low-maintenance alternative in outpatient clinics, while Vyaire continues to refresh its Vyntus platform with cloud dashboards.
Digital disruptors inject competitive dynamism. NuvoAir won FDA clearance for home test kits and partners with payers for COPD remote-care packages. Respira Labs secured Medicare reimbursement for its Sylvee acoustic patch, signaling regulatory appetite for wearable spirometry. Doktorconnect’s May 2025 acquisition of VitalFlo added AI-powered trend analytics and CE-marked IoT hardware, broadening its virtual-care suite. MGC Diagnostics’ Ascent software, cleared by FDA in October 2024, embeds automated ATS/ERS grading and respiratory-exchange ratio analytics, smoothing workflow for pulmonary exercise labs.
Regional specialists remain influential. Shenzhen-based Huirui Medical floods price-sensitive markets with turbine portables, while Japan’s Fukuda Denshi bundles spirometry in integrated cardiopulmonary stations. German startup AioCare taps reimbursement in Poland and Scandinavia for smartphone-linked spirometers. Competition increasingly hinges on software ecosystems, cybersecurity certification, and API openness rather than pure hardware precision, nudging incumbents toward cloud partnerships and subscription business models.
Spirometers Industry Leaders
MGC Diagnostics Corporation
NDD Medical Technologies
KoKo PFT
Koninklijke Philips N.V.
ICU Medical
- *Disclaimer: Major Players sorted in no particular order

Recent Industry Developments
- May 2025: Doktorconnect acquired VitalFlo, a respiratory-care platform that integrates in-office spirometry with remote monitoring and decision support tools, expanding Doktorconnect’s digital health presence.
- January 2025: Air Liquide signed contracts with 20 hospitals across Europe and Brazil for ECO ORIGIN low-carbon medical gases, cutting the facilities’ medical-gas carbon footprints by more than 70%.
- October 2024: MGC Diagnostics received FDA 510(k) clearance for Ascent cardiorespiratory diagnostic software featuring automated PFT interpretation and ATS/ERS grading.
- September 2024: Vitalograph acquired Morgan Scientific, fortifying its pulmonary-function portfolio with advanced laboratory systems.


Research Methodology Framework and Report Scope
Market Definitions and Key Coverage
Our study defines the global spirometers market as all newly-manufactured handheld, tabletop, and PC-based devices that measure lung volumes or flow rates (FVC, FEV1, PEF, among others) for diagnostic or monitoring use across hospitals, physician offices, occupational health units, and home-care programs. According to Mordor Intelligence, the market was valued at USD 638 million in 2025 and is projected to reach about USD 852 million by 2030.
Scope exclusion: disposables, aftermarket software upgrades, and broader respiratory devices such as peak-flow meters or full pulmonary-function test stations sit outside this definition.
Segmentation Overview
- By Product Type
- Hand-held
- Table-top
- By Technology
- Volume Measurement
- Flow Measurement
- Peak-flow Meter
- By Application
- Asthma
- COPD
- Cystic Fibrosis
- Occupational Lung Disease
- Other Applications
- By End-User
- Hospitals & Clinics
- Diagnostic Laboratories
- Home Healthcare
- Ambulatory Surgical Centers
- By Geography
- North America
- United States
- Canada
- Mexico
- Europe
- Germany
- United Kingdom
- France
- Italy
- Spain
- Rest of Europe
- APAC
- China
- Japan
- India
- Australia
- South Korea
- Rest of APAC
- Middle East & Africa
- GCC
- South Africa
- Rest of MEA
- South America
- Brazil
- Argentina
- Rest of South America
- North America
Detailed Research Methodology and Data Validation
Primary Research
Mordor analysts interviewed respiratory therapists, biomedical engineers, and procurement managers across North America, Europe, and Asia-Pacific. Conversations clarified actual replacement cycles, average selling prices for Bluetooth-enabled models, and country-level reimbursement thresholds, which were then cross-checked through brief surveys with home-care providers.
Desk Research
We began with public health datasets and registries, such as the WHO Global Health Observatory, the CDC's National Center for Health Statistics, Eurostat, and the OECD Health Data portal, to establish diagnosed COPD and asthma pools that trigger spirometry demand. Trade statistics from UN Comtrade, import logs on Volza, and device approval lists published by the US FDA and the EU's EUDAMED informed shipment volumes and launch timelines. Annual reports and 10-Ks of leading device makers, together with peer-reviewed articles in journals like Chest and Respiratory Medicine, provided pricing cues and technology migration rates. These sources illustrate, not exhaust, the range consulted.
Market-Sizing & Forecasting
A top-down prevalence-to-treated-cohort build-up linked COPD and asthma case counts to spirometry test intensity. Results were corroborated with selective bottom-up supplier roll-ups of unit shipments and ASPs to fine-tune totals. Key variables, like disease prevalence trends, device ASP erosion, average tests per diagnosed patient, regulatory approvals, and home-monitoring adoption rates, feed a multivariate regression that drives the 2025-2030 forecast. Data gaps in smaller geographies were bridged by regional analogs validated through expert calls.
Data Validation & Update Cycle
Outputs undergo variance checks against historical sales, analyst peer review, and anomaly flagging before sign-off. We refresh every twelve months, with interim updates triggered by material events such as major reimbursement changes or landmark product launches.
Why Mordor's Spirometers Market Baseline Remains Decisively Reliable
Published estimates often diverge because firms apply different device scopes, apply contrasting ASP trajectories, or update models on uneven cadences.
Key gap drivers include: some studies fold in consumables revenue or allied respiratory monitors, others extrapolate global totals from limited import data, while a few assume aggressive price inflation that our primary interviews rejected. Mordor's disciplined scope, prevalence-anchored demand pool, annual refresh, and dual-check on ASPs deliver a balanced baseline.
Benchmark comparison
| Market Size | Anonymized source | Primary gap driver | |
|---|---|---|---|
| USD 638 M (2025) | Mordor Intelligence | - | |
| USD 680 M (2025) | Global Consultancy A | Includes accessories revenue; limited primary validation | |
| USD 1.30 B (2025) | Industry Association B | Uses 2020 ASPs inflated uniformly; scope blends peak-flow meters |
In short, while other publishers offer useful perspectives, Mordor's transparent variable selection, regular expert validation, and consistent refresh cadence give decision-makers a dependable starting point.


Key Questions Answered in the Report
How big is the Spirometers Market?
The Spirometers Market size is expected to reach USD 675.86 million in 2026 and grow at a CAGR of 5.86% to reach USD 898.34 million by 2031.
Which segment is growing the fastest in the spirometers market?
Hand-held devices show the highest growth with a 7.71% CAGR thanks to their portability and suitability for remote care.
Why is Asia-Pacific considered the growth engine for spirometers?
Expanding healthcare infrastructure, high COPD burden, and large-scale screening programs are driving an 10.89% regional CAGR.
How are smartphone-linked spirometers changing clinical practice?
FDA-cleared portable units transmit real-time data to clinicians, improve patient engagement, and correlate strongly with laboratory-grade devices.
What technological trend is most likely to shape future spirometry?
AI-powered analytics that provide predictive exacerbation alerts and personalized insights are set to transform spirometers into comprehensive respiratory-management platforms.
Page last updated on:


