Spatial Genomics And Transcriptomics Market Size and Share
Market Overview
| Study Period | 2020 - 2031 |
|---|---|
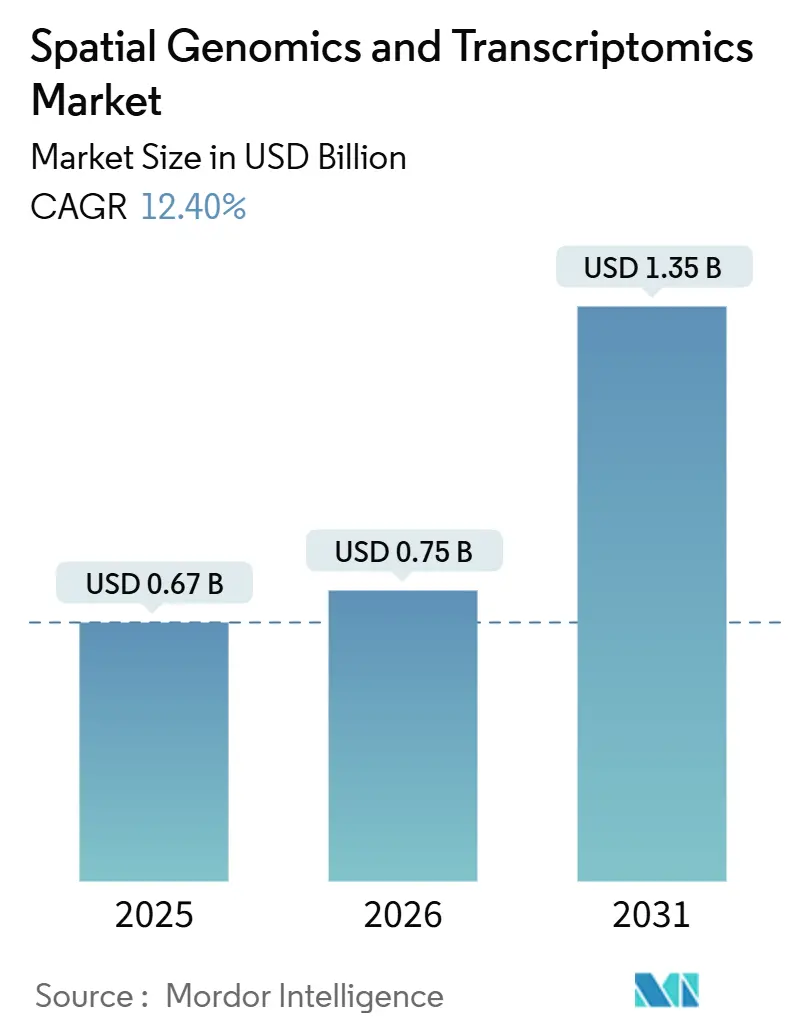
| Market Size (2025) | USD 0.75 Billion |
| Market Size (2030) | USD 1.35 Billion |
| Growth Rate (2026 - 2031) | 12.40% CAGR |
| Fastest Growing Market | Asia Pacific |
| Largest Market | North America |
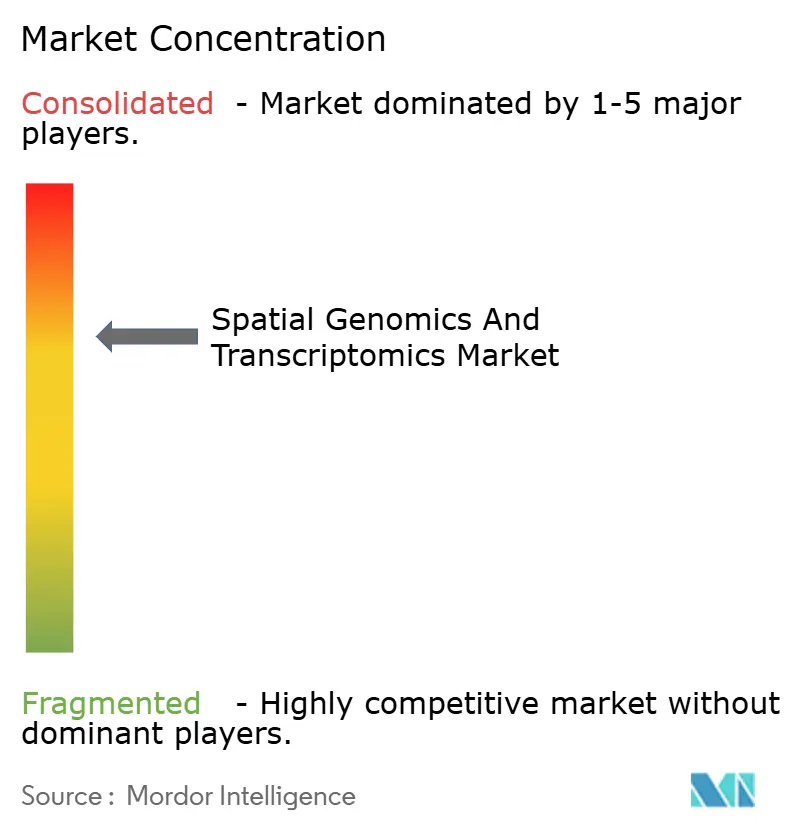
| Market Concentration | Medium |
Major Players *Disclaimer: Major Players sorted in no particular order Image © Mordor Intelligence. Reuse requires attribution under CC BY 4.0. | |
Spatial Genomics And Transcriptomics Market Analysis by Mordor Intelligence
The Spatial Genomics And Transcriptomics Market size is projected to expand from USD 0.67 billion in 2025 and USD 0.75 billion in 2025 to USD 1.35 billion by 2030, registering a CAGR of 12.40% between 2025 to 2030.
The sharp rise mirrors escalating demand from pharmaceutical firms that now rely on spatial context to explain cellular interactions inside intact tissue. Steady integration of artificial intelligence with spatial biology platforms enables automated cell-type identification, richer biomarker discovery, and faster translational workflows. Consortium-level initiatives, including the NIH BRAIN Cell Census Network, have secured long-term public funding and cemented the technology’s research relevance. Simultaneously, fourth-generation sequencing instruments are pushing throughput and cost thresholds, widening clinical feasibility. Strategic acquisitions such as Bruker–NanoString and the pending Quanterix–Akoya deal signal that turnkey spatial solutions are attracting premium valuations and accelerating platform consolidation. Overall, competitive intensity is shifting toward software differentiation and ecosystem partnerships.
Key Report Takeaways
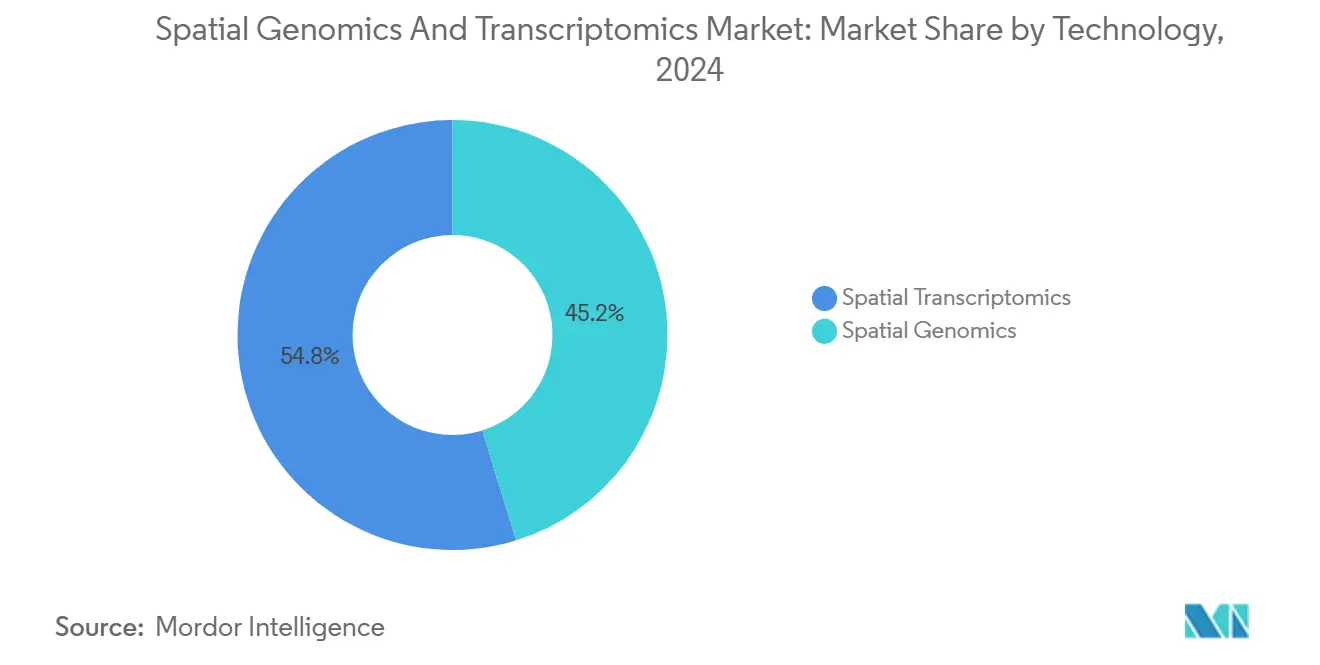
- By technology, spatial transcriptomics led with 54.80% revenue share in 2025, while spatial genomics is forecast to grow at a 14.00% CAGR through 2031.
- By product, consumables accounted for a 46.30% share in 2025, and software & services are projected to expand at a 15.40% CAGR through 2031.
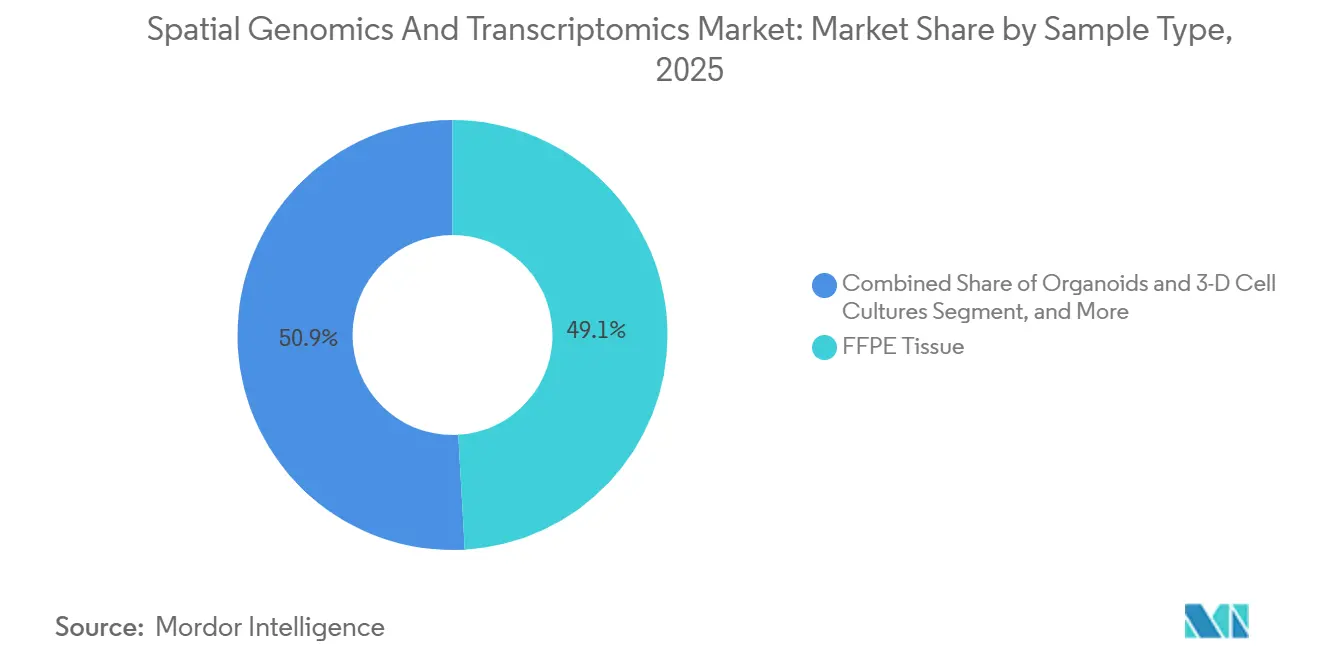
- By sample type, FFPE Tissue captured 49.10% of 2025 revenues, and Organoids & 3D Cell Cultures are expected to grow at a 16.60% CAGR through 2031.
- By application, oncology held a 47.60% share in 2025, while immunology & infectious Diseases are set to advance at a 14.20% CAGR through 2031.
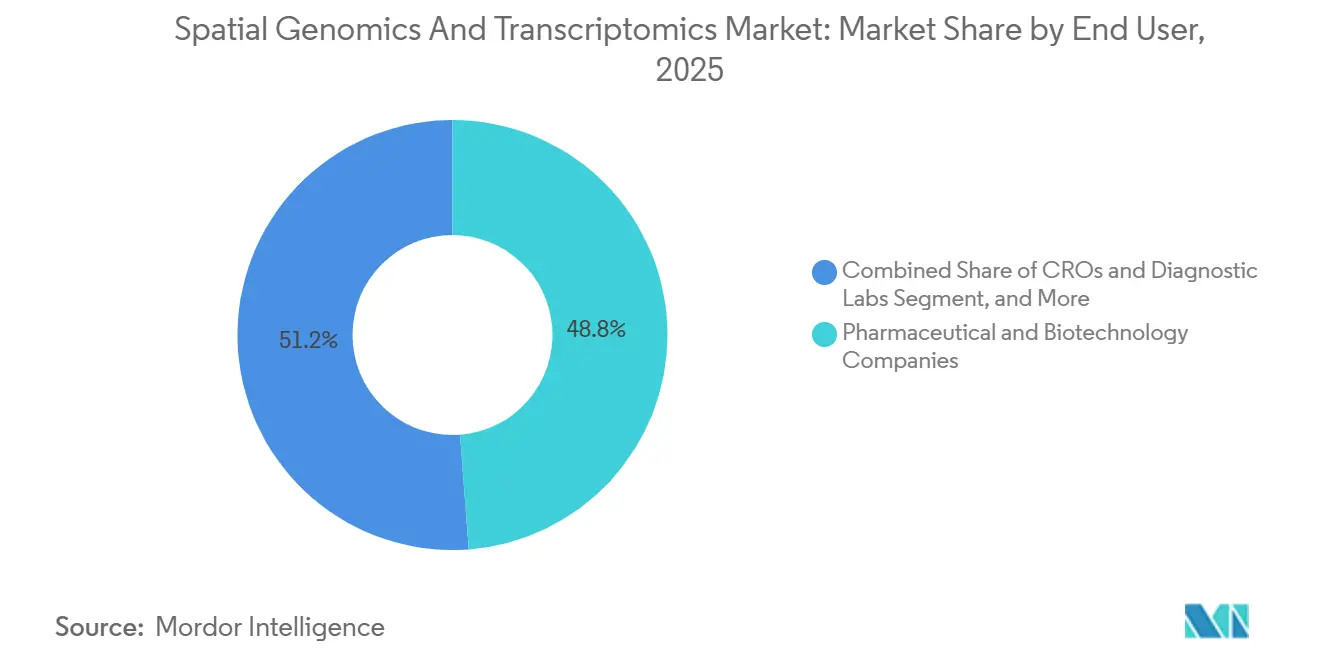
- By end user, pharmaceutical & biotechnology companies accounted for 48.80% of spending in 2025, while CROs & diagnostic labs are projected to post a 15.60% CAGR through 2031.
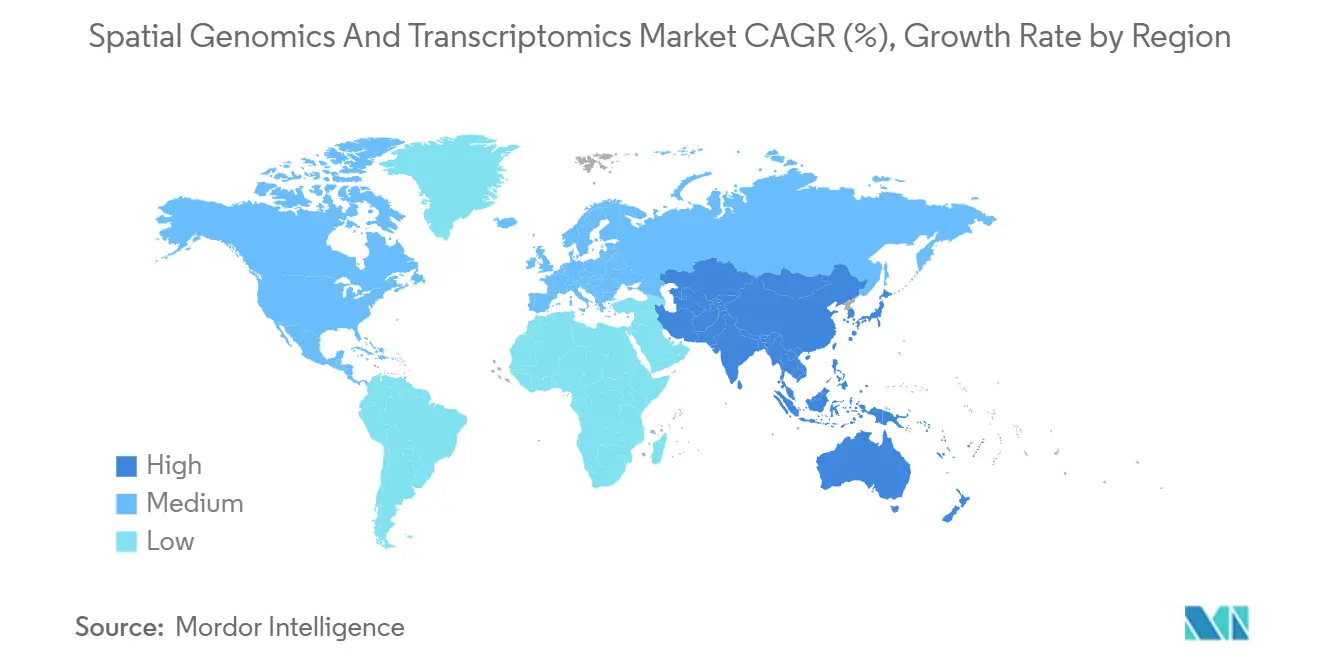
- By geography, North America accounted for a 41.02% share in 2025, while Asia-Pacific is projected to grow at a 17.02% CAGR through 2031.
Note: Market size and forecast figures in this report are generated using Mordor Intelligence’s proprietary estimation framework, updated with the latest available data and insights as of January 2026.
Global Spatial Genomics And Transcriptomics Market Trends and Insights
Drivers Impact Analysis*
| DRIVER | (~) % IMPACT ON CAGR FORECAST | GEOGRAPHIC RELEVANCE | IMPACT TIMELINE |
|---|---|---|---|
| Emerging potential of spatial analyses as cancer diagnostics | + 2.8% | Global, with concentration in North America & Europe | Medium term (2-4 years) |
| Rapid advances in high-resolution imaging & barcoding chemistries | + 2.3% | Global, led by North America, expanding to Asia-Pacific | Short term (≤ 2 years) |
| Advent of 4th-generation sequencing platforms | + 1.9% | North America & Europe core, emerging in China | Medium term (2-4 years) |
| Growing single-cell multi-omics adoption in drug discovery | + 2.1% | Global, pharma hubs in US, Switzerland, UK, China | Long term (≥ 4 years) |
| AI-enabled spatial pathology pipelines | + 1.7% | North America & Europe, pilot deployments in Asia-Pacific | Medium term (2-4 years) |
| FFPE-compatible in-situ capture chemistries | + 1.6% | Global, clinical pathology labs worldwide | Short term (≤ 2 years) |
| Source: Mordor Intelligence | |||
Emerging Potential of Spatial Analyses as Cancer Diagnostics
Spatial analysis technologies are transforming cancer diagnostics by revealing the complexities of the tumor microenvironment that traditional genomics cannot capture. Recent studies using Visium HD spatial transcriptomics have identified distinct macrophage subpopulations with pro-tumor functions in colorectal cancer, demonstrating how spatial context influences therapeutic targeting strategies.[1]Stephane Plaisance, “Spatial Transcriptomics Dissects Tumor-Immune Niches,” Nature Genetics, nature.com The technology's ability to map cellular interactions at single-cell resolution enables precision oncology approaches that match patients to immunotherapies based on spatial biomarker signatures rather than bulk tumor genetics. Clinical validation studies show that spatial transcriptomics can predict treatment responses in liver cancer and characterize complex tumor microenvironments in glioblastoma, directly supporting FDA companion diagnostic development pathways. This diagnostic potential extends beyond research applications, with pharmaceutical companies integrating spatial analysis into clinical trial design to identify patient populations most likely to respond to targeted therapies. The convergence of spatial biology with AI-driven pathology workflows promises to revolutionize cancer diagnosis by providing clinicians with unprecedented insights into tumor biology and mechanisms of treatment resistance.
Rapid Advances in High-Resolution Imaging & Barcoding Chemistries
Technological breakthroughs in imaging resolution and molecular barcoding are expanding spatial transcriptomics capabilities beyond current limitations. Illumina's unveiling of next-generation spatial transcriptomics technology in February 2025 promises cellular resolution with capture areas nine times larger than existing solutions, enabling analysis of millions of cells in a single experiment. Advanced barcoding chemistries now support simultaneous RNA and protein detection, with Bio-Techne's protease-free RNAscope multiomics workflow preserving tissue morphology while enabling comprehensive molecular profiling. These advances address critical bottlenecks in spatial analysis, particularly the trade-off between resolution and throughput that has limited clinical adoption. High-definition platforms like 10x Genomics' Visium HD achieve subcellular resolution while maintaining whole-transcriptome profiling capabilities, enabling researchers to identify rare cellular phenotypes and interactions critical for disease understanding.
Advent of 4th-Generation Sequencing Platforms
Fourth-generation sequencers such as Singular Genomics’ G4X process over 6.2 million cells and 438 million transcripts per flow cell, redefining throughput for spatial assays. Direct-Seq chemistry layers T- and B-cell receptor mapping onto tissue context, enriching immuno-oncology pipelines. PacBio’s low-cost HiFi genome chemistry lowers per-sample barriers, facilitating translational studies across hospital labs. By eliminating destructive sample preparation and enabling 3D reconstruction, these systems deliver unprecedented fidelity in the analysis of tissue architecture.
Growing Single-Cell Multi-Omics Adoption in Drug Discovery
Drug developers leverage single-cell multi-omics to connect compound action with spatially resolved molecular changes. Absci and Owkin’s collaboration fuses AI drug design with spatial multi-omics data to streamline target validation. Spatial VDJ sequencing maps immune repertoire dynamics inside tumors, highlighting antigen-specific clones for therapeutic exploitation.[2]Nikolaus Rajewsky, “LifeTime: Building a European Atlas of Spatial Single-Cell Data,” Max Delbrück Center, mdc-berlin.de Such depth accelerates lead optimization and reduces late-stage attrition by revealing resistance pathways early.
Restraints Impact Analysis*
| RESTRAINT | (~) % IMPACT ON CAGR FORECAST | GEOGRAPHIC RELEVANCE | IMPACT TIMELINE |
|---|---|---|---|
| Slow implementation across clinical labs | - 1.4% | Global, acute in community hospitals | Medium term (2-4 years) |
| Entrenched conventional genomics workflows | - 0.9% | Global, stronger in cost-sensitive regions | Long term (≥ 4 years) |
| Data-storage & compute-burden scalability | - 0.7% | Global, infrastructure gaps in emerging markets | Short term (≤ 2 years) |
| Limited barcoded reagents for non-model organisms | - 0.5% | Academic research, veterinary diagnostics | Long term (≥ 4 years) |
| Source: Mordor Intelligence | |||
Slow Implementation Across Clinical Labs
Adoption in diagnostic laboratories lags because spatial workflows require specialized imaging hardware, advanced bioinformatics, and standardized tissue handling. Many facilities lack capital budgets and trained staff, forcing reliance on reference centers. Additionally, reimbursement codes for spatial assays remain undefined in several markets, limiting return on investment. Regulatory clarity around analytical validity and clinical utility is progressing, yet laboratories still navigate uncertain approval routes. Until protocol harmonization matures, sample-to-sample variability can hinder reproducibility of results and operator confidence.
Entrenched Conventional Genomics Workflows
Hospitals invested heavily in bulk NGS platforms and LIMS configurations tailored to established assays. Transitioning to spatial solutions demands re-engineering IT pipelines and retraining staff, creating inertia even in high-resource systems. Laboratory leaders cite integration with electronic health records as a key barrier because current data schemas seldom accommodate multi-layer spatial coordinates. Conservative practice patterns further discourage the replacement of assays with long track records of clinical validation, despite mounting evidence of spatial technology’s incremental value.
*Our forecasts treat driver/restraint impacts as directional, not additive. The impact forecasts reflect baseline growth, mix effects, and variable interactions.
Segment Analysis
By Technology: Sequencing Platforms Diversify Beyond Imaging Dominance
In 2025, Spatial Transcriptomics captured 54.80% of the market share in the spatial genomics and transcriptomics segment, highlighting its compatibility with next-generation sequencing infrastructure and its extensive adoption in pharmaceutical validation studies. Within this segment, sequencing-based methods such as Visium and Slide-seq contributed 62% of the revenues, while imaging-based approaches like MERFISH, seqFISH, and Xenium accounted for 38%. This revenue split reflects the balance between achieving subcellular resolution and covering the whole transcriptome. Spatial Genomics, the fastest-growing technology in this market, is anticipated to grow at a 14.00% CAGR through 2031, driven by in-situ sequencing methods that maintain chromatin architecture, enabling enhancer-promoter analysis in developmental and disease research. The market is also being shaped by the adoption of long-read technologies, which resolve isoforms within intact tissues and expand applications in neurology and developmental biology. Companies offering multi-modality portfolios that integrate imaging and sequencing are well-positioned to gain a competitive advantage, as customers increasingly prioritize aligning resolution requirements with throughput, budget considerations, and data integration capabilities.


By Product: Software Monetization Reshapes Revenue Models
In 2025, consumables contributed 46.30% of total revenues, reflecting a strategic shift by vendors toward emphasizing reagent and slide-based annuities over one-time instrument sales. Gross margins on barcoded slides for platforms such as Visium and Xenium, exceeding 75%, drive aggressive pricing strategies for instruments to expand the installed base and maximize lifetime value. Saturation in the installed base across leading North American academic centers, where most R1 universities operate at least one spatial platform, has redirected focus from instrument growth to optimizing utilization and increasing software subscriptions. With data volumes from individual tissue sections now surpassing 2 terabytes, the demand for specialized analytics encompassing image registration, segmentation, and spatial statistics has become a critical driver for renewals and expansions.
Software & Services is the fastest-growing product category, with a projected 15.40% CAGR through 2031. This growth is primarily driven by rising demand for cloud-native pipelines, onboard analysis, and enterprise-level visualization.
By Sample Type: Organoid Models Disrupt FFPE Dominance
In 2025, FFPE Tissue accounted for 49.10% of the revenue, driven by laboratories leveraging existing archives from hospital systems and clinical biobanks. This approach enabled retrospective studies and expedited validation cohorts. The introduction of FFPE-compatible kits by leading vendors significantly reduced preparation time from 48 hours to just 6 hours, making same-day processing more practical in translational research settings. While fresh-frozen samples provide higher RNA quality and 15% to 20% greater detection rates, many clinical programs continue to prioritize FFPE-based workflows due to their stable logistics and broad availability. The spatial genomics and transcriptomics market has adapted by offering tailored chemistry and pre-analytical guidance to address FFPE variability across institutions.
Organoids & 3D Cell Cultures represent the fastest-growing sample type, with a projected CAGR of 16.60% through 2031. This growth reflects the increasing adoption of microphysiological models, which more effectively replicate human tissue functions compared to traditional 2D systems.

By Application: Immunology Gains on Oncology's Early Lead
In 2025, oncology applications dominated the spatial genomics and transcriptomics market, accounting for a 47.60% share. This growth was primarily driven by advancements in tumor microenvironment mapping, enabling improved prediction of checkpoint responses and resistance monitoring. Within oncology, the immuno-oncology sub-segment emerged as the largest contributor, supported by the spatial quantification of T-cell exclusion, tertiary lymphoid structures, and fibroblast states capabilities that surpass the limitations of traditional flow cytometry. Neurology also gained significant traction in 2025, propelled by national initiatives that developed spatial atlases of the human cortex. These atlases have expanded reference maps, playing a critical role in advancing neurodegeneration research. In developmental biology, spatial methodologies have been utilized to reconstruct cell fate processes, including breakthroughs in cardiac valve formation and the identification of previously uncharacterized progenitors, marking a transformative step in the field.
Immunology & Infectious Diseases is the fastest-growing application area, projected to expand at a 14.20% CAGR through 2031. This growth is driven by increased investments in host-pathogen mapping and advancements in autoimmune disease biology.
By End-User: CROs Accelerate as Pharma Outsources Complexity
In 2025, Pharmaceutical & Biotechnology Companies represented 48.80% of spending, leveraging spatial platforms for target validation, biomarker discovery, and patient stratification in late preclinical and early clinical programs. Major sponsors demonstrated internal capability expansion by deploying multi-site instrument fleets and achieving high sample throughput, particularly in oncology and neuroscience programs, reflecting steady demand for consumables. The spatial genomics and transcriptomics market continues to depend on public-private partnerships that drive method development, establish reference datasets, and support workforce training.
CROs & Diagnostic Labs are the fastest-growing end-user segment, with a projected 15.60% CAGR through 2031. This growth is fueled by sponsors increasingly outsourcing specialized assays to providers capable of delivering faster turnaround times with standardized methodologies.
Geography Analysis
In 2025, North America accounted for 41.02% of the spatial genomics and transcriptomics market, driven by consistent NIH funding that supports numerous atlas projects and accelerates their clinical application. The region leads in clinical experimentation, with the majority of spatial transcriptomics trials in 2025 being U.S.-sponsored, highlighting a well-established ecosystem connecting research hospitals, biopharmaceutical companies, and regulatory frameworks. Additionally, the market in North America benefits from significant investments in informatics and logistics, ensuring efficient turnaround times critical for oncology decision-making. Collaborative efforts across multiple centers are standardizing benchmarks for FFPE performance and analysis pipelines, reducing variability and enhancing payer engagement.
Asia-Pacific is positioned as the fastest-growing region in the spatial genomics and transcriptomics market, with a projected CAGR of 17.02% through 2031. This growth is fueled by national programs investing in core facilities, workforce training, and data platforms. In 2025, China’s National Key R&D Program funded numerous spatial platforms across tier-1 cities, driving the adoption of these tools in academic hospitals and the pharmaceutical sector. Japan’s pharmaceutical industry is expanding the use of spatial technologies in oncology and immunology, while regional consortia are contributing to global atlas projects by harmonizing methods and metadata. Australia’s investment in spatial data commons is enabling research groups to access cloud-based analysis tools, reducing barriers to entry and accelerating publication timelines.

Competitive Landscape
The spatial genomics and transcriptomics market is moderately consolidated. After purchasing NanoString for its GeoMx portfolio, Bruker broadened into RNA-protein co-detection, integrating analysis pipelines that shorten sample-to-insight time. Quanterix’s pending acquisition of Akoya promises an end-to-end platform spanning blood-based ultrasensitive assays and tissue proteomics. 10x Genomics retains leadership by iterating on Visium HD and Xenium, leveraging an installed base and closed-loop reagent model. Intellectual property disputes, such as Vizgen versus 10x, indicate high barriers for new entrants.
Technology roadmaps converge on higher plex, faster run times, and AI-driven analytics. Singular Genomics positions throughput as a differentiator, while PacBio banks on read accuracy. Software-first firms like Nucleai partner with instrument makers to bundle predictive algorithms, capturing value without manufacturing hardware. Clinical validation capacity remains a bottleneck; firms able to finance multi-site trials will gain first-mover advantage in regulated diagnostics.
Spatial Genomics And Transcriptomics Industry Leaders
10x Genomics
NanoString Technologies, Inc.
Dovetail Genomics
S2 Genomics, Inc.
Illumina, Inc.
- *Disclaimer: Major Players sorted in no particular order

Recent Industry Developments
- February 2026: Parse Biosciences, a QIAGEN company, announced the launch of its Evercode Whole Transcriptome v4 product line, offering improved scalability, enhanced sensitivity, and a simplified workflow for single-cell RNA sequencing.
- February 2026: Stellaromics introduced Pyxa, the first platform enabling multiplexed 3D spatial transcriptomics in intact tissue up to 100 micrometers thick. This innovation shifts spatial biology from 2D thin-section methods to comprehensive 3D analysis, preserving the native organization of cells, molecules, and microenvironments.
- February 2026: Singular Genomics launched its G4X platform in the U.S., delivering the industry's highest-throughput system for spatial multiomics analysis. The platform supports simultaneous analysis of 500-plex RNA, 18-plex protein, and FFPE samples at subcellular resolution.
- January 2026: Illumina integrated CARTANA's in-situ sequencing technology into its NovaSeq X platform, enabling whole-transcriptome spatial profiling at USD 500 per square centimeter, a 70% cost reduction compared to standalone systems. This positions Illumina to market spatial capabilities to its 8,000+ NovaSeq systems, targeting 15-20% of the spatial market by 2028.
- January 2026: Signios Bio launched a grant program to support spatial transcriptomics research using the 10x Genomics Xenium 5K platform. The program aims to help U.S.-based researchers generate high-plex, single-cell-resolution spatial gene expression data in human and mouse tissues.
- January 2026: Illumina introduced Illumina Connected Multiomics, a cloud-based platform for analyzing and visualizing complex multiomic and multimodal biological data. The platform addresses the growing need for tools that integrate data across transcriptomics, genomics, proteomics, epigenetics, and more.


Research Methodology Framework and Report Scope
Market Definitions and Key Coverage
Our study treats the spatial genomics & transcriptomics market as all revenues from instruments, consumables, and analytical software that spatially map DNA or RNA molecules within intact tissues across research, pre-clinical, and emerging diagnostic settings. Data cover sales to pharmaceutical and biotechnology companies, academic and research institutes, contract research organizations, and clinical laboratories.
Scope exclusion: revenues from proteomics-only and purely imaging mass-cytometry platforms fall outside this definition.
Segmentation Overview
- By Technology
- Spatial Transcriptomics
- Sequencing-based
- Imaging-based (MERFISH, seqFISH, Xenium, CARTANA)
- Spatial Genomics
- In-situ Sequencing
- Fluorescence in situ Hybridization (FISH)
- In-situ Capture
- Spatial Transcriptomics
- By Product
- Instruments
- Consumables
- Software & Services
- By Sample Type
- FFPE Tissue
- Fresh-Frozen Tissue
- Organoids & 3-D Cell Cultures
- By Application
- Oncology
- Neurology
- Immunology & Infectious Diseases
- Developmental Biology
- Drug Discovery & Screening
- Metabolic & Cardiovascular Research
- By End-User
- Pharmaceutical & Biotechnology Companies
- Academic & Research Institutes
- CROs & Diagnostic Labs
- Others
- By Geography
- North America
- United States
- Canada
- Mexico
- Europe
- Germany
- United Kingdom
- France
- Italy
- Spain
- Rest of Europe
- Asia-Pacific
- China
- India
- Japan
- Australia
- South Korea
- Rest of Asia-Pacific
- Middle East and Africa
- GCC
- South Africa
- Rest of Middle East and Africa
- South America
- Brazil
- Argentina
- Rest of South America
- North America
Detailed Research Methodology and Data Validation
Primary Research
Mordor analysts conducted semi-structured interviews with laboratory directors in North America, pathologists in European university hospitals, and procurement managers at Asian CROs. These discussions clarified reagent burn rates, emerging sample-prep bottlenecks, likely average selling price shifts, and uptake timelines for next-gen "in-situ" chemistries, thereby closing gaps left by desk work.
Desk Research
We began with publicly available datasets from the NIH RePORTER grant portal, European Union Horizon project database, and Japan AMED funding lists, which reveal spatial-omics project counts and budget flows. Annual import-export records for sequencing reagents from UN Comtrade, patent families mined through Questel, and peer-reviewed output indexed in PubMed helped us gauge technology diffusion and pricing. Regulatory filings and 10-K statements of listed platform suppliers, plus production statistics released by trade bodies such as the Association for Molecular Pathology, anchored shipment volumes. Paid feeds from D&B Hoovers and Dow Jones Factiva supplemented company-level revenue splits. The sources above are illustrative; many other references informed data collection and validation.
The second pass organized disparate facts into a harmonized evidence pack that evidences installed-base growth, average consumable pull-through, and regional funding intensity before figures moved into modelling.
Market-Sizing & Forecasting
A top-down build used global sequencing spend and tissue-sample workflows to reconstruct demand pools, which were then split by technology and region using penetration ratios cross-checked against supplier shipment tallies. Select bottom-up checks, such as rolling up quarterly Visium slide shipments and average list prices, were layered to refine totals. Key variables in our model include installed single-cell sequencing capacity, oncology biopsy volumes, NIH spatial-biology grant dispersal, price per permeabilization kit, and the share of FFPE samples compatible with spatial assays. Multivariate regression combined with scenario analysis projects 2025-2030 growth given funding, ASP, and adoption triggers; gaps in bottom-up inputs are bridged through weighted regional proxies validated with interview feedback.
Data Validation & Update Cycle
Outputs pass three rounds of analyst review, variance scans against independent funding and publication metrics, and re-contact of experts when anomalies persist. Reports refresh each year, with mid-cycle updates issued after material events.
Why Mordor's Spatial Genomics And Transcriptomics Baseline Stands Firm
Published estimates often diverge because firms pick different revenue buckets, coverage years, and refresh cadences.
Key gap drivers here include whether services revenue is counted, if consumables for adjacent proteomics kits are bundled, currency conversion timing, and the aggressiveness of future funding assumptions.
Benchmark comparison
| Market Size | Anonymized source | Primary gap driver |
|---|---|---|
| USD 0.67 B (2025) | Mordor Intelligence | - |
| USD 0.55 B (2024) | Global Consultancy A | Includes sample-prep services and counts partial proteomics kits |
| USD 0.26 B (2023) | Industry Publication B | Excludes software revenue and models only academic demand |
| USD 0.38 B (2024) | Trade Journal C | Uses supplier list prices without regional ASP adjustments |
Taken together, the comparison shows that our disciplined scope selection, variable tracking, and annual refresh give decision-makers a balanced, transparent baseline they can trace back to clear inputs and repeatable steps.


Key Questions Answered in the Report
What is the current size and growth outlook for the spatial genomics and transcriptomics market?
The spatial genomics and transcriptomics market size is USD 0.75 billion in 2026 and is projected to reach USD 1.35 billion by 2031, reflecting a 12.4% CAGR.
Which application areas are leading and expanding fastest in spatial genomics and transcriptomics?
Oncology led with 47.60% share in 2025, while Immunology & Infectious Diseases is the fastest-growing application at a 14.20% CAGR through 2031.
What technology choices are shaping platform selection in spatial genomics and transcriptomics?
Imaging approaches offer subcellular precision on targeted panels, while sequencing approaches deliver whole-transcriptome breadth at lower spatial resolution, and long-read methods are adding isoform-level insights for intact tissue.
How are products and services evolving across spatial genomics and transcriptomics?
Consumables drive recurring revenue and held 46.30% share in 2025, while Software & Services is the fastest-growing category with a 15.40% CAGR as analysis shifts to cloud-native subscriptions.
Which regions show the strongest momentum in spatial genomics and transcriptomics?
North America led with 41.02% share in 2025, and Asia-Pacific is poised for the fastest growth with a 17.02% CAGR due to national programs funding spatial infrastructure and training.
Who are the key companies shaping spatial genomics and transcriptomics platforms?
10x Genomics, Illumina, and Bruker together controlled approximately 60% of instrument placements as of 2025, while many specialists compete across consumables and software layers.
Page last updated on:


