Spacecraft Market Size and Share
Market Overview
| Study Period | 2019 - 2031 |
|---|---|
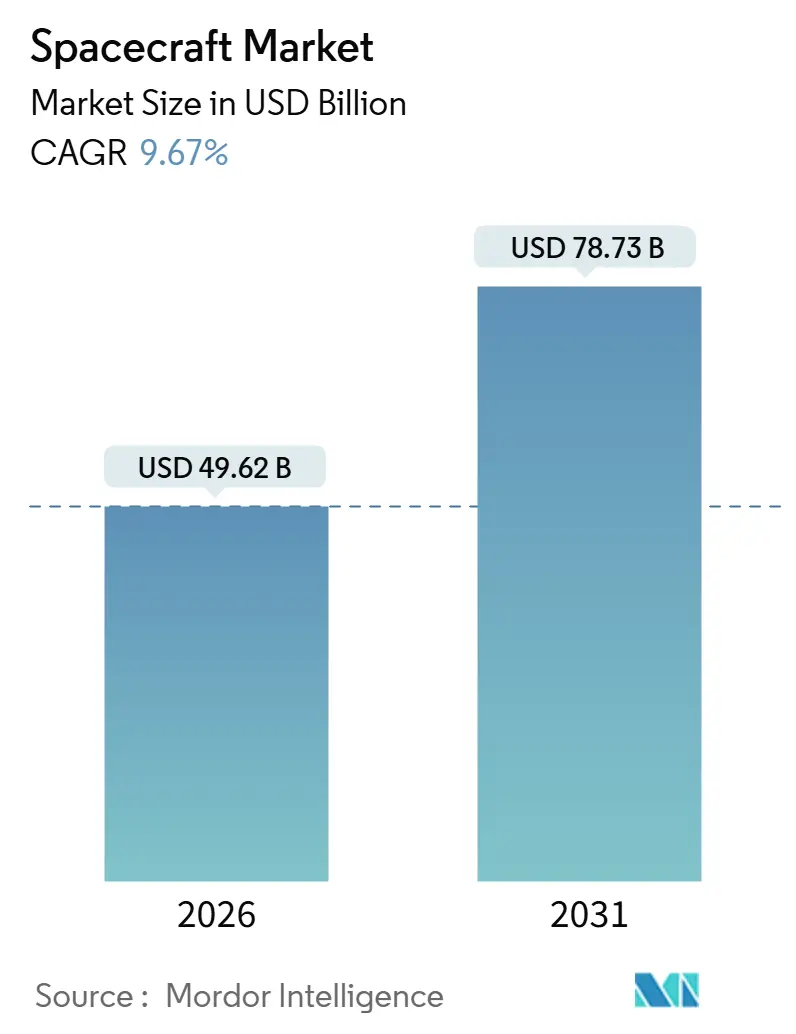
| Market Size (2026) | USD 49.62 Billion |
| Market Size (2031) | USD 78.73 Billion |
| Growth Rate (2026 - 2031) | 9.67% CAGR |
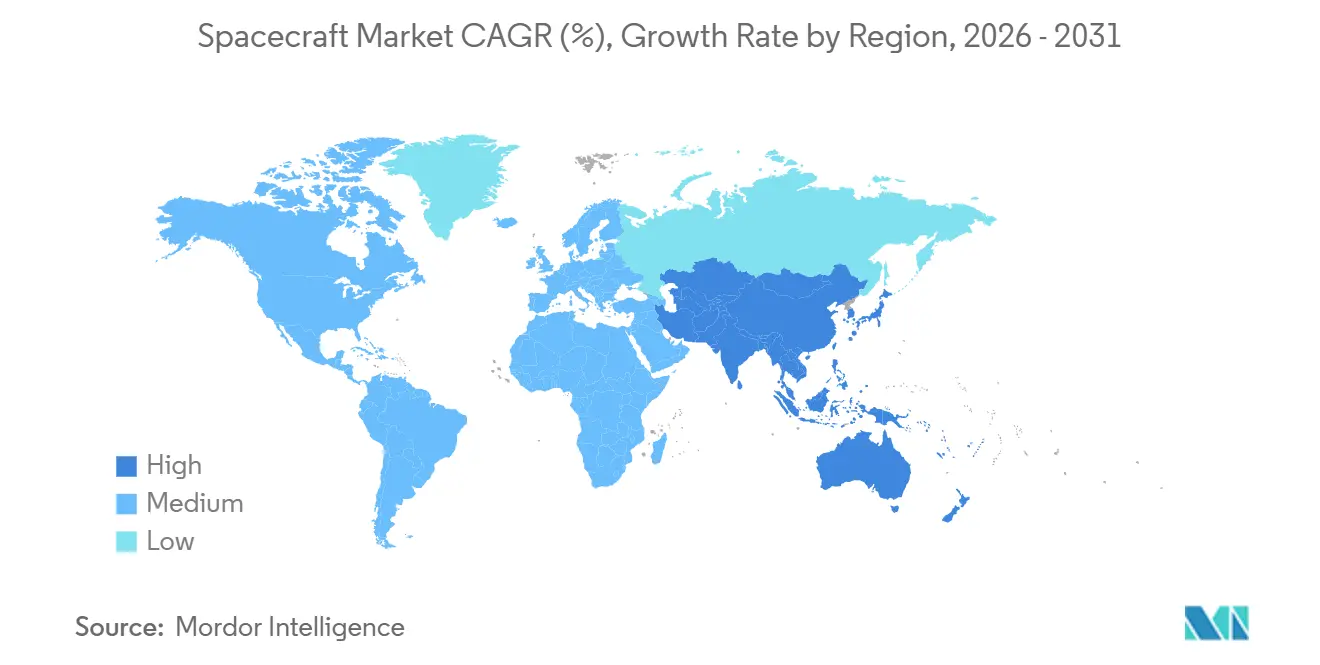
| Fastest Growing Market | Asia Pacific |
| Largest Market | North America |
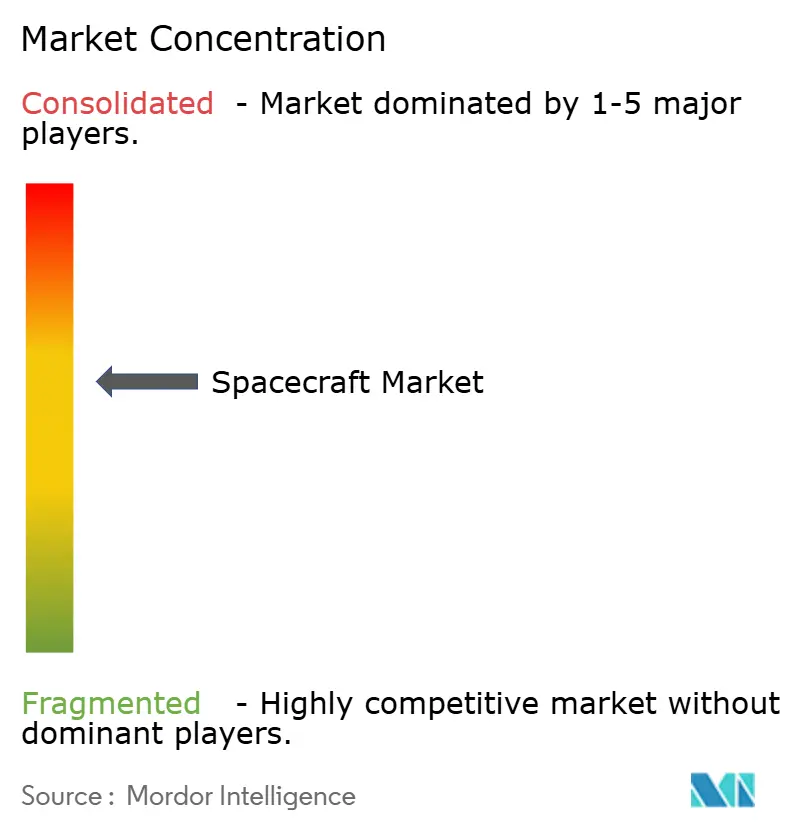
| Market Concentration | Medium |
Major Players *Disclaimer: Major Players sorted in no particular order Image © Mordor Intelligence. Reuse requires attribution under CC BY 4.0. | |
Spacecraft Market Analysis by Mordor Intelligence
The spacecraft market size stands at USD 49.62 billion in 2026 and is projected to reach USD 78.73 billion by 2031, growing at a 9.67% CAGR over the forecast period. Growth reflects a decisive pivot from fully government-funded missions to hybrid procurement models that blend defense, civil, and commercial demand. Nations are proliferating small satellites to build resilient intelligence networks, private operators are fielding broadband mega-constellations at automotive-style production rates, and lunar logistics programs are opening recurring cargo opportunities. Tightening de-orbit rules, additive manufacturing breakthroughs, and rising reliance on commercial-off-the-shelf (COTS) electronics are further compressing development cycles and cost curves. Meanwhile, launch-site congestion and space debris mitigation costs temper the expansion, but do not blunt the long-term trajectory of the spacecraft market.
Key Report Takeaways
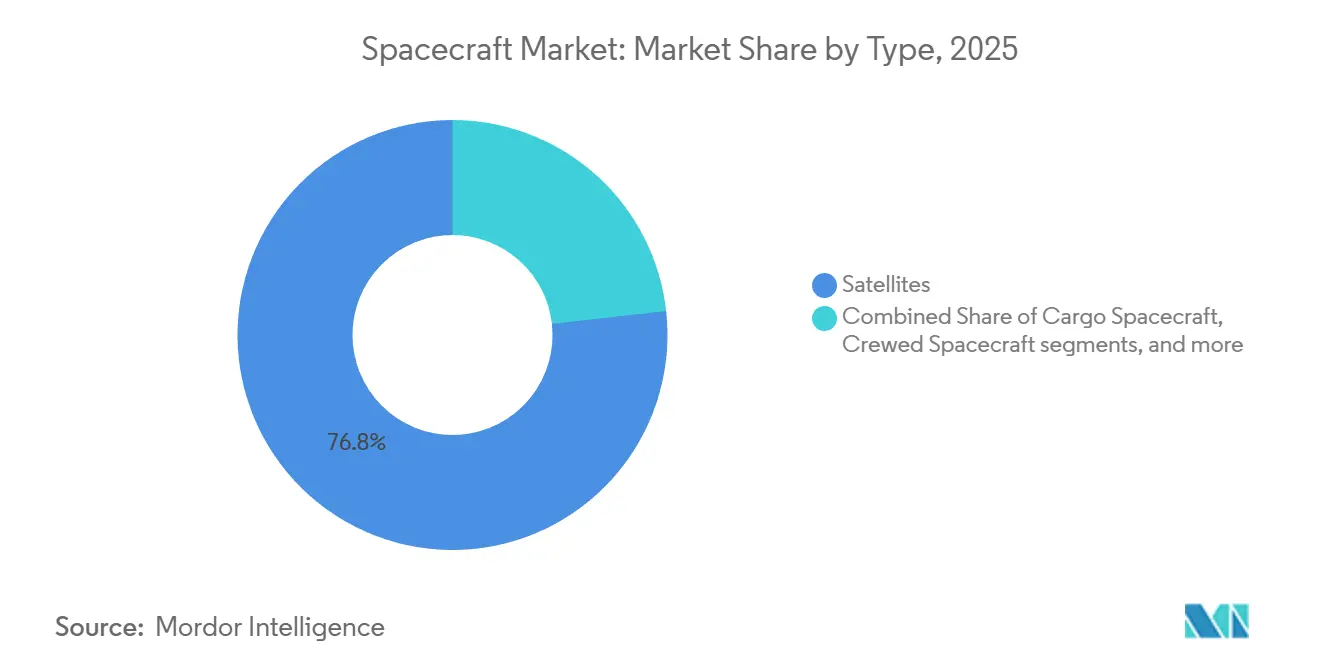
- By type, satellites accounted for 76.78% of the 2025 revenue. In contrast, cargo vehicles are forecasted to grow at a 10.12% CAGR through 2031 as NASA’s Commercial Lunar Payload Services and private space-station resupply schedules ramp up.
- By application, communication held a 42.24% share of the spacecraft market size in 2025, while technology-demonstration missions are set to expand at a 10.32% CAGR through 2031, driven by in-orbit servicing and debris-removal pilots.
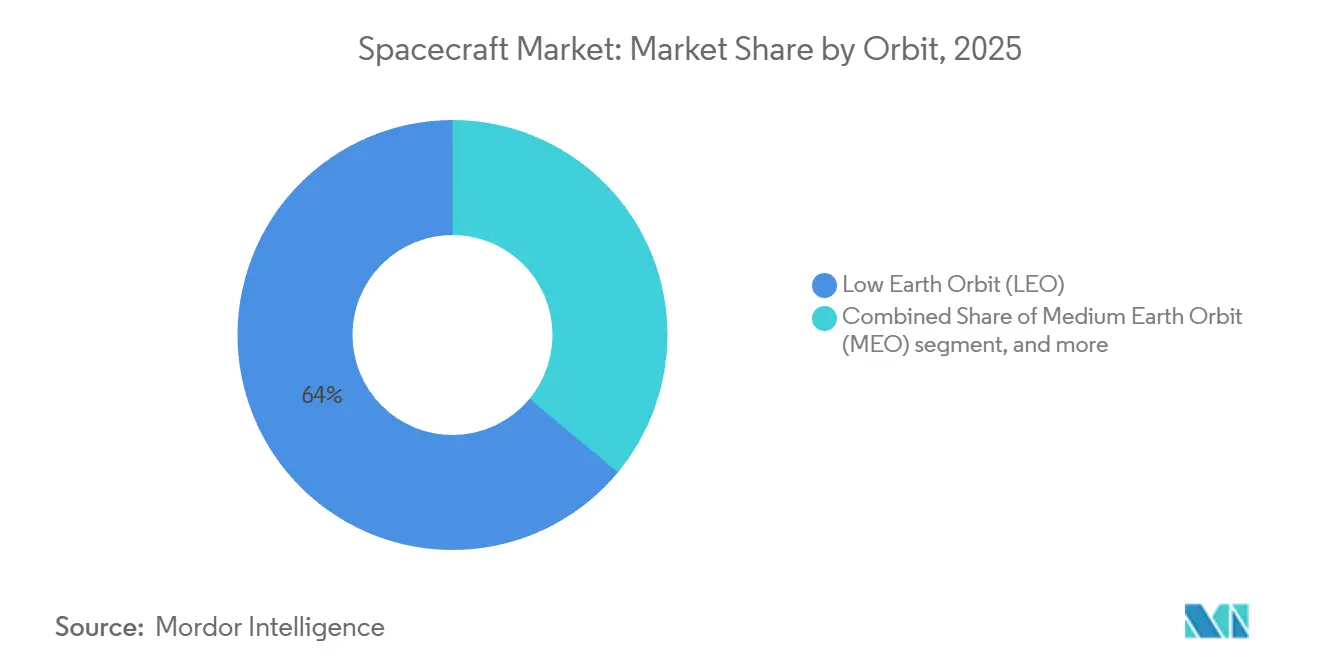
- By orbit, Low Earth Orbit (LEO) accounted for 63.97% of 2025 deployments, but the “Others” category (beyond GEO, cislunar, highly elliptical, and interplanetary) shows the fastest rise at a 10.75% CAGR to 2031, supported by Artemis Gateway modules and Mars sample-return probes.
- By subsystem, payloads commanded 31.54% of the 2025 value, yet propulsion will post the highest 10.44% CAGR as electric systems become standard for both LEO raising and mandated five-year de-orbit compliance.
- By geography, North America led with 47.89% of 2025 revenue, anchored by USD 2.7 billion in Orion capsule orders and USD 3.19 billion in Space Launch System boosters, while Asia-Pacific is the fastest-growing region at an 11.25% CAGR through 2031 on the back of Chinese, Indian, and Japanese deep-space programs.
Note: Market size and forecast figures in this report are generated using Mordor Intelligence’s proprietary estimation framework, updated with the latest available data and insights as of January 2026.
Global Spacecraft Market Trends and Insights
Drivers Impact Analysis*
| Driver | (~) % Impact on CAGR Forecast | Geographic Relevance | Impact Timeline |
|---|---|---|---|
| Adoption of commercial-off-the-shelf electronics is accelerating spacecraft development | +1.8% | Global, early in North America and Europe | Medium term (2-4 years) |
| Growth of broadband satellite constellations is increasing spacecraft manufacturing demand | +2.4% | Global, concentrated in North America, Europe, Asia-Pacific | Short term (≤2 years) |
| Government lunar and Mars exploration programs are driving advanced spacecraft procurement | +1.6% | North America, Europe, Asia-Pacific | Long term (≥4 years) |
| Rising defense ISR requirements are expanding small satellite deployments | +1.5% | North America, Europe, Middle East, Asia-Pacific | Medium term (2-4 years) |
| In-orbit servicing and life-extension concepts are creating new spacecraft demand | +1.2% | Global, early in North America and Europe | Long term (≥4 years) |
| Additive manufacturing is enabling scalable and cost-efficient spacecraft production | +1.4% | North America, Europe, spillover to Asia-Pacific | Medium term (2-4 years) |
| Source: Mordor Intelligence | |||
Adoption of Commercial-Off-the-Shelf Electronics is Accelerating Spacecraft Development
COTS components shorten design cycles and lower unit costs by replacing long-lead, radiation-hardened parts with high-volume automotive or consumer chips, safeguarded through software error correction and redundancy. The Aerospace Corporation’s 2024 guidelines confirm that COTS processors now power guidance computers in small satellites flying below 600 km for up to five years.[1]The Aerospace Corporation, “COTS Guidance,” Aerospace.org ESA echoed the trend by green-lighting commercial microcontrollers for non-critical subsystems, enabling primes to source from Infineon and Texas Instruments rather than waiting 18 months for space-qualified equivalents. The US Space Development Agency’s Tranche 1 transport layer specifies COTS-heavy designs to hit 90-day replenishment goals. The DoD’s 2025 acquisition policy revision further encourages the adoption of COTS for missions with manageable risk. Together, these moves accelerate procurement while introducing supply chain exposure to commercial fabs.
Growth of Broadband Satellite Constellations is Increasing Spacecraft Manufacturing Demand
Mega-constellations require assembly line production. SpaceX’s Redmond plant builds six Starlink spacecraft daily, holding per-unit cost under USD 1 million and resetting pricing expectations. Europe’s IRIS² contract allocates EUR 10.6 billion (USD 12.39 billion) to 290 satellites, justifying investments in automated testing and pushing the first launches to 2028. Amazon’s Project Kuiper received approval for 3,236 satellites and booked 83 launches through 2029, triggering a production ramp in 2025-2026. OneWeb, majority-owned by Eutelsat, is planning a higher-capacity second generation that will reopen its supply chain. This flood of orders institutionalizes mass‐manufacturing practices across the spacecraft market.
Government Lunar and Mars Exploration Programs Are Driving Advanced Spacecraft Procurement
Deep space missions command premium platforms. In 2025, NASA ordered three Orion capsules, extending production into the early 2030s. Commercial Lunar Payload Services has already issued USD 800 million across fourteen task orders, guaranteeing two to three payload flights per year through 2028. Japan’s Martian Moons eXploration probe will showcase ion propulsion and autonomous rendezvous on its 2026-2029 mission. India’s Chandrayaan-4 sample-return mission, approved at over USD 100 million, further diversifies demand. These programs anchor high-value demand well beyond 2030.
Rising Defense ISR Requirements Are Expanding Small-Satellite Deployments
Military agencies are moving from exquisite, single-point-failure satellites to proliferated constellations. The US National Reconnaissance Office issued contracts in 2024 for low-cost electro-optical and SAR assets, each valued at under USD 50 million, with launch cadences exceeding ten per year. The UK earmarked GBP 968 million (USD 1.30 billion) for the Oberon and ISTARI constellations to secure sovereign ISR by 2027. Meanwhile, DARPA’s Blackjack program proved autonomous tasking across six spacecraft, a template for the Space Development Agency’s Tranche 2 network. Small-satellite production lines, therefore, scale not only for telecom but also for defense surveillance, reinforcing the expansion of the spacecraft market.
Restraints Impact Analysis*
| Restraint | (~) % Impact on CAGR Forecast | Geographic Relevance | Impact Timeline |
|---|---|---|---|
| Launch-site capacity constraints and launch manifest congestion are delaying deployments | -0.9% | Global, acute in North America | Short term (≤2 years) |
| Increasing space debris and collision risks are complicating mission planning | -0.7% | Global, focused in LEO | Medium term (2-4 years) |
| Export control regulations are restricting international spacecraft collaboration | -0.5% | Global, affecting US-EU and US-Asia | Long term (≥4 years) |
| Shortages of radiation-hardened components are constraining spacecraft production | -0.6% | Global, high in North America and Europe | Medium term (2-4 years) |
| Source: Mordor Intelligence | |||
Launch-Site Capacity Constraints and Manifest Congestion Are Delaying Deployments
Cape Canaveral and Kennedy Space Center hosted more than 50 launches in 2024, stretching range safety staffing and causing multi-week slips when anomalies struck.[2]U.S. Space Force, “18th Space Defense Squadron,” Spaceforce.mil Vandenberg completed upgrades for 50 flights per year, yet SpaceX has requested over 40 slots alone. Blue Origin’s New Glenn debut moved to 2025, partly due to pad availability conflicts. Such saturation cascades to spacecraft builders, extending delivery timelines and adding cost buffers.
Increasing Space Debris and Collision Risks Are Complicating Mission Planning
The 18th Space Defense Squadron tracks 47,000 objects larger than 10 cm, a 15% increase since 2022. Starlink alone executed 50,000 avoidance maneuvers in the first six months of 2024, burning propellant and shortening the design life. FCC de-orbit mandates compel operators to reserve fuel, reducing payload mass. ESA’s Zero Debris Charter will require controlled re-entries by 2030. Insurance premiums have increased by 20-30%, thereby elevating operating costs.
*Our forecasts treat driver/restraint impacts as directional, not additive. The impact forecasts reflect baseline growth, mix effects, and variable interactions.
Segment Analysis
By Type: Satellites Dominate, Cargo Spacecraft Accelerate
Satellites generated 76.78% of the 2025 revenue for the spacecraft market, confirming their centrality to communication, navigation, and Earth observation missions. In contrast, cargo spacecraft are forecasted to post a 10.12% CAGR, making them the fastest-growing segment of the spacecraft market. NASA’s Commercial Lunar Payload Services has already allocated USD 800 million, securing two to three cislunar cargo flights per year and cementing demand for uncrewed logistics craft. Sierra Space’s Dream Chaser, with a 5,500 kg capacity and runway landing, is set for a late-2024 ISS debut and differentiates through gentle re-entry profiles.[3]Sierra Space, “Dream Chaser,” Sierraspace.com
Cargo growth dovetails with planned commercial stations, where Axiom modules and Orbital Reef concepts need routine supply. Crewed spacecraft remain niche but lucrative; SpaceX’s Dragon capsules dominate current rotations, while Boeing’s Starliner clears final certification for operational flights in 2026. Deep-space probes, although low-volume, deliver high contracting value and drive subsystem innovations, such as deep-space optical links and autonomous navigation. Collectively, the expanding mix sustains a broad production base and underpins the spacecraft market.


By Application: Communication Leads, Technology Demonstration Surges
Communication retained a 42.24% share of the spacecraft market size for 2025, reflecting the relentless demand for broadband capacity and secure defense links. Technology demonstration missions, however, are expected to grow at a 10.32% CAGR through 2031 as operators validate life-extension, debris-removal, and on-orbit assembly concepts. In-orbit servicing successes, such as MEV dockings and forthcoming Astroscale operations, signal a commercial tipping point.
The growth of the Earth observation segment is powered by sub-meter synthetic aperture radar constellations that fulfill defense and agritech analytics. Navigation missions maintain a steady cadence with GPS III and Galileo replenishments, ensuring batch orders are fulfilled every two to three years. Science missions, such as the Europa Clipper, which exceeds USD 5 billion, act as technology pathfinders and maintain institutional knowledge at prime contractors.
By Orbit: Low Earth Orbit Dominates, Cislunar Trajectories Emerge
Low Earth Orbit (LEO) secured 63.97% of 2025 spacecraft deployments, primarily due to the proliferation of Starlink, OneWeb, and defense architectures. Starlink’s more than 7,500 operational satellites span 340-614 km shells, minimizing latency and aligning with FCC five-year disposal rules. Medium Earth Orbit (MEO) serves as the navigation backbone for systems such as GPS III and BeiDou. Geostationary (GEO) remains the realm of weather and high-throughput telecom but increasingly relies on electric propulsion for orbit raising. The Others category, including cislunar and interplanetary paths, will expand at a 10.75% CAGR through 2031 as Artemis Gateway modules and sample-return probes enter serial production.
Cislunar traffic introduces new challenges in radiation shielding, navigation autonomy, and long-duration power systems, encouraging investment in advanced subsystems. Highly elliptical and interplanetary orbits likewise demand higher-specific-impulse propulsion. As these missions mature, they catalyze supplier specialization and broaden the spacecraft market share for niche hardware.
By Subsystem: Payloads Command Premium, Propulsion Grows Fastest
Payloads accounted for 31.54% of the 2025 value, driven by the premium pricing of SAR and optical inter-satellite link packages. Propulsion will lead growth at a 10.44% CAGR, with Aerojet Rocketdyne’s XR-100 Hall thruster offering 4,000 seconds specific impulse and 40% propellant savings for GEO transfer. Busek’s BIT-7 ion thruster underpins multiple small-sat platforms, proving low-mass precision orbit control.
Power, communication, thermal control, and guidance subsystems are all trending toward modular, software-defined architectures. Spectrolab’s 32%-efficient triple-junction cells increase available power density, while NASA’s Laser Communications Relay achieved 1.2 Gbps downlink speeds from the ISS, indicating the potential for optical mainline adoption. Such subsystem evolution reinforces competitive differentiation across the spacecraft market.
Geography Analysis
North America contributed 47.89% of 2025 revenue, buoyed by Orion capsule orders and SpaceX’s 148 launches in 2024 that soak up Cape and Vandenberg capacity. The National Reconnaissance Office’s sub-USD 50 million small-sat awards further embed proliferated architectures. Canada’s Telesat Lightspeed constellation targets a 2026 service launch, cementing regional broadband competition.[4]Telesat, “Lightspeed Constellation,” Telesat.com
Asia-Pacific is set for the highest 11.25% CAGR to 2031. China executed 67 orbital launches in 2024, showcasing reusable boosters like Landspace’s Zhuque-3 and expanding commercial payload share. India’s NewSpace India Limited (NSIL) booked twelve small-sat launches and is maturing a reusable launch demonstrator to halve per-kilogram prices. Japan’s Martian Moons eXploration probe remains on track for 2026, emphasizing deep-space ambition: South Korea’s Nuri rocket and Taiwan’s maiden Triton weather satellite signal broader regional participation.
Europe advances strategic autonomy with the IRIS² sovereign broadband program and the asteroid-defense Hera mission. OHB SE continues to carve a 500 kg-class niche, whereas the UK invests in Oberon and ISTARI ISR constellations. Sanctions constrain Russia to 19 launches in 2024, but domestic GEO and Progress logistics remain steady. The Middle East and Africa are building momentum through the UAE’s MBZ-SAT and Saudi Vision 2030 initiatives, signaling a fresh demand for high-resolution imaging and secure links.

Competitive Landscape
Prime contractors show moderate consolidation, with Space Exploration Technologies Corp., Lockheed Martin Corporation, Airbus SE, and China Aerospace Science and Technology Corporation vertically integrating propulsion, avionics, and final assembly lines. NASA’s dual awards to Starship and Blue Origin for lunar landers demonstrate intent to keep at least two providers in every critical lane. SpaceX’s cradle-to-orbit model captures margin across launch, satellite, and ground station domains, intensifying price competition.
Mid-tier entrants, such as Rocket Lab, Relativity Space, and Sierra Space, differentiate themselves through additive manufacturing, rapid cadence micro-launches, and winged re-entry cargo capabilities. Electric propulsion specialists (Aerojet Rocketdyne, Busek), optical-link innovators, and deployable solar-array suppliers fragment the subsystem layer, encouraging niche excellence. Patent filings in autonomous rendezvous, mesh networking, and deployable structures climbed 30% from 2022 to 2025, signaling sustained innovation.
White-space growth pivots on in-orbit servicing, debris removal, and cislunar trucking. Astroscale’s ELSA-M targets FCC-mandated disposal burdens; Orbit Fab’s hydrazine depots extend GEO satellite life; and Intuitive Machines pitches lunar cargo flights. These emergent verticals should widen participation and gradually lower the spacecraft market concentration score.
Spacecraft Industry Leaders
The Boeing Company
Lockheed Martin Corporation
China Aerospace Science and Technology Corporation
Space Exploration Technologies Corp.
Airbus SE
- *Disclaimer: Major Players sorted in no particular order

Recent Industry Developments
- December 2025: The Space Development Agency (SDA) announced the allocation of four agreements, totaling approximately USD 3.5 billion, for the construction of 72 Tracking Layer satellites. These satellites will be equipped with missile warning/missile tracking (MW/MT) infrared (IR) sensors, as well as missile warning, tracking, and defense (MWTD) sensors. This initiative supports the Tracking Layer Tranche 3 (TRKT3) of the Proliferated Warfighter Space Architecture (PWSA) in low Earth orbit (LEO).
- May 2025: The European Space Agency (ESA) entered into two contracts with European industry to develop a commercial service for transporting cargo to and from the International Space Station (ISS) in LEO-constellation by 2030.
- January 2024: Japan launched a spacecraft on the Moon to demonstrate precision landing technology and reinvigorate its space program. The Japan Aerospace Exploration Agency's (JAXA) Smart Lander for Investigating Moon (SLIM) landed on the Moon's surface and re-established communication with Earth. By reducing the cost of launching, Japan aims to carry out more frequent missions in the future.


Global Spacecraft Market Report Scope
A spacecraft is a vehicle used in outer space to support various applications, including communications, navigation, Earth observation, space exploration, meteorology, and the transportation of humans and cargo. The market includes satellites, cargo transporters, and human and crew spaceflight.
The market is segmented by type, orbit, subsystem, and geography. By type, the market is segmented into satellites, cargo spacecraft, crewed spacecraft, and deep-space probes. By application, the market is segmented into communication, earth observation, navigation and mapping, science and exploration, and technology demonstration. By orbit, the market is segmented into low earth orbit (LEO), medium earth orbit (MEO), geostationary orbit (GEO), and others. By subsystem, the market is segmented into propulsion systems, power systems, communication systems, thermal control systems, guidance and navigation systems, and payloads. The report covers the market sizes and forecasts for the spacecraft market in major countries across different regions. For each segment, the market size is provided in terms of value (USD).
| Satellites |
| Cargo Spacecraft |
| Crewed Spacecraft |
| Deep-Space Probes |
| Communication |
| Earth Observation |
| Navigation and Mapping |
| Science and Exploration |
| Technology Demonstration |
| Low Earth Orbit (LEO) |
| Medium Earth Orbit (MEO) |
| Geostationary Orbit (GEO) |
| Others |
| Propulsion Systems |
| Power Systems |
| Communication Systems |
| Thermal Control Systems |
| Guidance and Navigation Systems |
| Payloads |
| North America | United States | |
| Canada | ||
| Mexico | ||
| Europe | United Kingdom | |
| France | ||
| Germany | ||
| Russia | ||
| Rest of Europe | ||
| Asia-Pacific | China | |
| India | ||
| Japan | ||
| South Korea | ||
| Rest of Asia-Pacific | ||
| South America | Brazil | |
| Rest of South America | ||
| Middle East and Africa | Middle East | United Arab Emirates |
| Saudi Arabia | ||
| Rest of Middle East | ||
| Africa | South Africa | |
| Rest of Africa | ||
| By Type | Satellites | ||
| Cargo Spacecraft | |||
| Crewed Spacecraft | |||
| Deep-Space Probes | |||
| By Application | Communication | ||
| Earth Observation | |||
| Navigation and Mapping | |||
| Science and Exploration | |||
| Technology Demonstration | |||
| By Orbit | Low Earth Orbit (LEO) | ||
| Medium Earth Orbit (MEO) | |||
| Geostationary Orbit (GEO) | |||
| Others | |||
| By Subsystem | Propulsion Systems | ||
| Power Systems | |||
| Communication Systems | |||
| Thermal Control Systems | |||
| Guidance and Navigation Systems | |||
| Payloads | |||
| By Geography | North America | United States | |
| Canada | |||
| Mexico | |||
| Europe | United Kingdom | ||
| France | |||
| Germany | |||
| Russia | |||
| Rest of Europe | |||
| Asia-Pacific | China | ||
| India | |||
| Japan | |||
| South Korea | |||
| Rest of Asia-Pacific | |||
| South America | Brazil | ||
| Rest of South America | |||
| Middle East and Africa | Middle East | United Arab Emirates | |
| Saudi Arabia | |||
| Rest of Middle East | |||
| Africa | South Africa | ||
| Rest of Africa | |||


Key Questions Answered in the Report
How large is the spacecraft market in 2026?
The spacecraft market size reached USD 49.62 billion in 2026 and is forecasted to climb to USD 78.73 billion by 2031.
What CAGR is projected for spacecraft sales through 2031?
The spacecraft market is expected to expand at a 9.67% CAGR over the 2026-2031 period.
Which spacecraft type shows the fastest growth?
Cargo vehicles lead with a projected 10.12% CAGR as lunar and commercial-station logistics missions multiply.
Which region is growing fastest in spacecraft demand?
Asia-Pacific is the fastest, advancing at an 11.25% CAGR through 2031 on the back of Chinese, Indian, and Japanese programs.
What is the biggest restraint facing new spacecraft programs?
Launch-site congestion and rising space-debris risks are causing schedule delays and higher insurance costs affecting the market growth.
Which subsystem is forecast to grow the most?
Propulsion leads subsystem growth at a 10.44% CAGR, driven by orbit-raising efficiency and de-orbit mandates.
Page last updated on:


