
South Korea Used Car Market Size and Share
Market Overview
| Study Period | 2020 - 2031 |
|---|---|
| Forecast Data Period | 2026 - 2031 |
| Base Year Market Size (2025) | USD 24.11 Billion |
| Market Size (2026) | USD 25.16 Billion |
| Market Size (2031) | USD 31.13 Billion |
| Growth Rate (2026 - 2031) | 4.35 % |
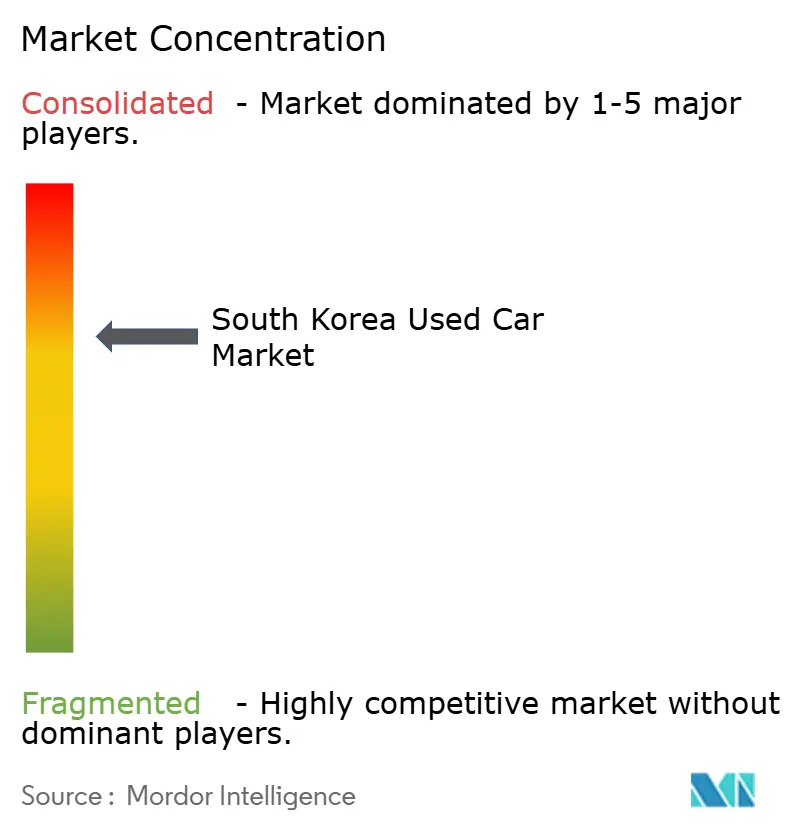
| Market Concentration | Medium |
Major Players *Disclaimer: Major Players sorted in no particular order Image © Mordor Intelligence. Reuse requires attribution under CC BY 4.0. | |
South Korea Used Car Market Analysis by Mordor Intelligence
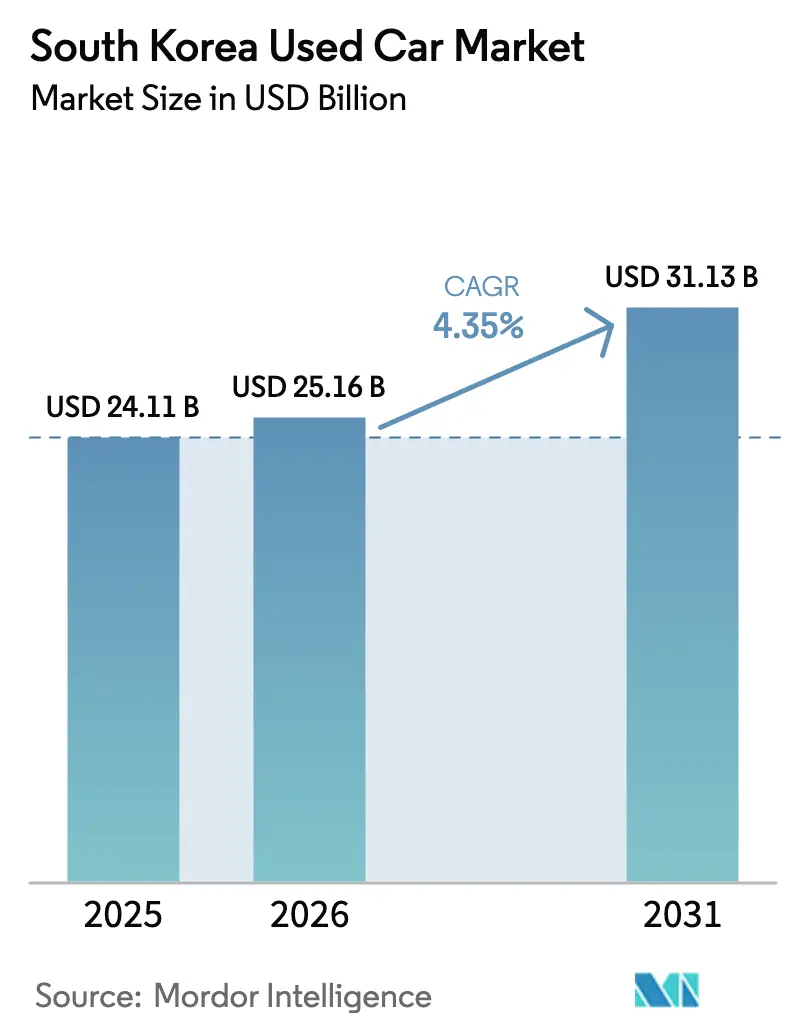
The South Korea used car market size is expected to grow from USD 24.11 billion in 2025 to USD 25.16 billion in 2026 and is forecast to reach USD 31.13 billion by 2031 at 4.35% CAGR over 2026-2031. Growth momentum comes from a steady pipeline of three-year lease returns, widening digital access to inventory, and policy support that encourages organized retail formats. Government liquidity of KRW 2 trillion supports inventory financing and technology upgrades. Sedans still dominate but rapidly rising demand for SUVs, battery electric vehicles, and nearly-new inventory is diversifying the supply mix. Digital platforms create pricing transparency that presses unorganized dealers to modernize, while Seoul’s forthcoming emission rules accelerate turnover of older diesel vehicles.
Key Report Takeaways
- By vehicle type, sedans led with 39.85% share of the South Korea used car market in 2025; SUVs are forecast to expand at a 6.38% CAGR to 2031.
- By vendor type, organized dealers held 57.98% of the South Korea used car market share in 2025, and the segment will grow at a 5.34% CAGR through 2031.
- By fuel type, petrol powertrains captured 60.41% of the South Korea used car market share in 2025; battery electric vehicles post the highest projected CAGR at 11.48% through 2031.
- By vehicle age, the 3-5 year bracket held a 35.72% of the South Korea used car market share in 2025; the 0-2 year bracket is rising at a 9.24% CAGR.
- By price segment, the USD 10,000-14,999 tier accounted for 32.05% of the South Korea used car market share in 2025; the USD 30,000+ tier shows a 9.91% CAGR outlook.
- By sales channel, multi-brand independent dealers managed 55.25% of the South Korea used car market share in 2025; pure-play e-retailers grew at an 8.08% CAGR.
- By ownership, multi-owner vehicles represented 61.76% of the South Korea used car market share in 2025; first-owner resale grows at 5.09% CAGR.
Note: Market size and forecast figures in this report are generated using Mordor Intelligence’s proprietary estimation framework, updated with the latest available data and insights as of 2026.
Dynamics observed within South korea present a country level view when set against the broader international context. The used car market analysis by Mordor Intelligence provides that expanded global perspective.
South Korea Used Car Market Trends and Insights
Drivers Impact Analysis*
| Driver | (~) % Impact on CAGR Forecast | Geographic Relevance | Impact Timeline |
|---|---|---|---|
| 3-year Lease-Return Glut | +1.8% | Seoul, Busan, Incheon, Gyeonggi | Short term (≤ 2 years) |
| Digital Marketplaces Boom | +1.2% | Seoul, Busan, Daegu, Gyeonggi | Medium term (2-4 years) |
| EV Resale Deregulation | +0.9% | Seoul, Gyeonggi, Incheon | Medium term (2-4 years) |
| OEM CPO Roll-Out | +0.7% | Seoul, Busan, Daegu, Gyeonggi, Ulsan | Long term (≥ 4 years) |
| SUV Demand Spike | +0.6% | Gyeonggi, Seoul, Busan, Daegu | Medium term (2-4 years) |
| AI Condition Grading | +0.4% | Seoul, Busan, Gyeonggi | Long term (≥ 4 years) |
| Source: Mordor Intelligence | |||
Wave of Three-Year Lease Returns Swelling High-Quality Supply
High residual-value lease vehicles re-enter the market in bulk, giving organized dealers superior inventory that attracts buyers focused on warranty cover and lower mileage. These units retain 65.4% of original value after three years, underscoring the premium associated with nearly-new stock. Hyundai and Kia’s dominant domestic production secures a predictable stream of such returns, anchoring dealer margins. Government incentives that remain in place through 2025 further raise conversion rates from lease to purchase, particularly among eco-friendly models. The resulting inventory depth strengthens buyer confidence and supports gradual price normalization[1]“자동차 통계,” Korea Automobile Manufacturers Association, kama.or.kr.
Rising Adoption of Digital Marketplaces and Price-Comparison Apps
Online comparison tools grant shoppers instant visibility into pricing, mileage, and condition, eroding traditional information asymmetries. Dealers are shifting resources into omnichannel models that integrate virtual showrooms with in-person inspections. OEM platforms launched since 2022 offer certified listings and financing in one transaction flow, lifting service quality benchmarks across the sector. The convenience of click-to-buy capabilities is translating into a robust growth for pure-play e-retail, though in-store inspection still seals most high-value deals. Organized dealers therefore embed remote appraisal and video walkthroughs to maintain competitiveness while leveraging their physical infrastructure.
Government Deregulation Opening Resale of Up-To Four-Year-Old EVs with Tax Credits
Policy amendments allow used EV transactions to qualify for subsidies up to KRW 6.5 million, creating an immediate cost-of-ownership advantage over new internal-combustion models. This regulatory nudge is widening the buyer pool for pre-owned EVs and compressing payback periods. Dealers handling electric stock face new operational requirements, including battery health diagnostics and charger-compatibility checks. Regional subsidy limits concentrate activity around Seoul, generating price spreads that mobile wholesalers exploit by reallocating inventory to satellite cities[2]“중고차 등록 현황,” Korea Automobile Importers and Distributors Association, kaida.co.kr.
OEM-Backed Certified-Pre-Owned Roll-Out Post-2022 Law Boosts Buyer Trust
Legislation opened the used retail segment to vehicle manufacturers, allowing branded certification, extended warranties, and integrated financing. Programs such as Hyundai’s H Promise subject each unit to more than 270 inspection points, adding measurable value in the eyes of risk-averse shoppers. These offerings command premium pricing but also create reference standards that independent dealers must match on transparency and after-sales support. Over the long term, OEM participation accelerates consolidation as smaller outlets find it difficult to finance comparable warranty liabilities.
Restraints Impact Analysis*
| Restraint | (~) % Impact on CAGR Forecast | Geographic Relevance | Impact Timeline |
|---|---|---|---|
| Used-car Price Inflation | -1.4% | Seoul, Busan, Gyeonggi, Incheon | Short term (≤ 2 years) |
| Unorganized Dealer Dominance | -0.8% | Daegu, Gwangju, Ulsan, Jeju | Medium term (2-4 years) |
| Seoul’s 2027 Emission-grade Diesel Ban | -0.6% | Seoul, Gyeonggi, Incheon | Medium term (2-4 years) |
| Vehicle-history Blockchain Hesitation | -0.3% | All regions | Long term (≥ 4 years) |
| Source: Mordor Intelligence | |||
Used-Car Price Inflation Narrowing Gap with New Cars
Persistent inventory shortages keep used prices elevated, reducing the historical savings that once drew consumers away from new-car showrooms. Manufacturers respond with aggressive financing on new models, tipping cost equations further. Dealers managing used inventory face compressed margins as buyers hold out for promotions or pivot toward new EVs fortified by tax relief. Urban centers feel the squeeze most acutely, where emission rules drive rapid fleet renewal and amplify demand for compliant stock.
Fragmented Unorganized Dealers Keep Trust Deficit and Price Opacity High
Small independent lots without standardized processes generate inconsistent inspection reports and variable pricing, discouraging first-time buyers who prefer transparent digital platforms. Organized dealers capture share by publicizing certified checklists and vehicle-history reports, but rural regions still rely on legacy operators with limited technology adoption. The credibility gap slows market formalization and introduces reputational risk that dampens transaction velocity in price-sensitive segments.
*Our forecasts treat driver/restraint impacts as directional, not additive. The impact forecasts reflect baseline growth, mix effects, and variable interactions.
Segment Analysis
By Vehicle Type: SUVs Drive Market Transformation
Sedans retained the largest share at 39.85% in 2025, while SUVs are the fastest-expanding part of the South Korea used car market with a 6.38% CAGR. The shift is propelled by households seeking vehicles that blend commuter comfort with outdoor utility. Government incentives aimed at hybrid and electric SUVs further amplify demand. Dealers capitalize by prioritizing recent lease returns from Hyundai and Kia’s SUV lines, which carry strong residual values and readily available parts. Inventory managers balancing compact sedan supply with SUV demand mitigation reposition hatchbacks toward entry-level buyers who focus on price.
The growing preference for high-stance vehicles strengthens the resale prospects of models that feature advanced driver-assistance systems and low-emission powertrains. Younger families view SUVs as flexible assets that can satisfy recreation without a second vehicle, consolidating purchasing budgets into a single multipurpose unit. Dealers that align reconditioning standards with family-oriented feature sets, such as rear-seat convenience and cargo management, secure faster inventory turnover.




By Vendor Type: Organized Dealers Consolidate Market Share
Organized dealers captured 57.98% of the South Korea used car market share in 2025 and are projected to expand at 5.34% CAGR, owing to scale advantages in sourcing, certification, and marketing. Larger players streamline inspection, standardize pricing, and offer bundled financing, reducing friction for buyers who value speed and accountability. The South Korea used car market size for organized dealerships is forecast to climb in lock-step with digital investment that supports omnichannel experiences.
Unorganized dealers remain relevant in peripheral provinces where personal networks override formal structures, yet regulatory compliance costs and technology gaps hinder their growth. Consolidators increasingly acquire standalone lots to access local clientele and real estate footprints. The resultant network effects enable larger inventory breadth, attracting online traffic and reinforcing visibility in price-comparison apps.
By Fuel Type: Electric Vehicles Reshape Value Propositions
Petrol listings held 60.41% of the South Korea used car market share in 2025, but battery electric vehicles exhibit a 11.48% CAGR that will materially alter the South Korea used car market structure by 2031. Diesel demand contracts under city emission limits, pushing dealers to pivot toward petrol-hybrid and battery electric stock to avoid stranded assets. The South Korea used car market size for battery electric vehicles grows in tandem with charging infrastructure rollout, encouraging higher residual values and shorter selling cycles.
Dealers that master battery health assessments and warranty transfer logistics capture premiums on nearly-new EVs. Safety-related spikes in listing volumes demonstrate the sensitivity of this segment to brand reputations and incident news. Transparent battery-state disclosures mitigate fear, and certified programs that include replacement guarantees improve buyer confidence.
By Vehicle Age: Premium on Nearly-New Inventory
Vehicles aged 3-5 years account for 35.72% of the South Korea used car market share in 2025, but the 0-2 years bracket posts a 9.24% CAGR on the promise of factory warranty remainder and modern infotainment. Residual-value retention incentivizes financial leasing structures that feed high-quality supply back to the South Korea used car market. Old diesel units risk accelerated depreciation under Seoul’s 2027 ban, prompting exporters to channel these vehicles to overseas markets where regulations are softer.
The age gradient influences workshop demand, as recent models need software updates rather than mechanical overhaul. Dealers offering subscription-type maintenance packages can wrap service revenue around young inventory, stabilizing profits amid price swings.
By Price Segment: Mid-Market Dominance with Premium Growth
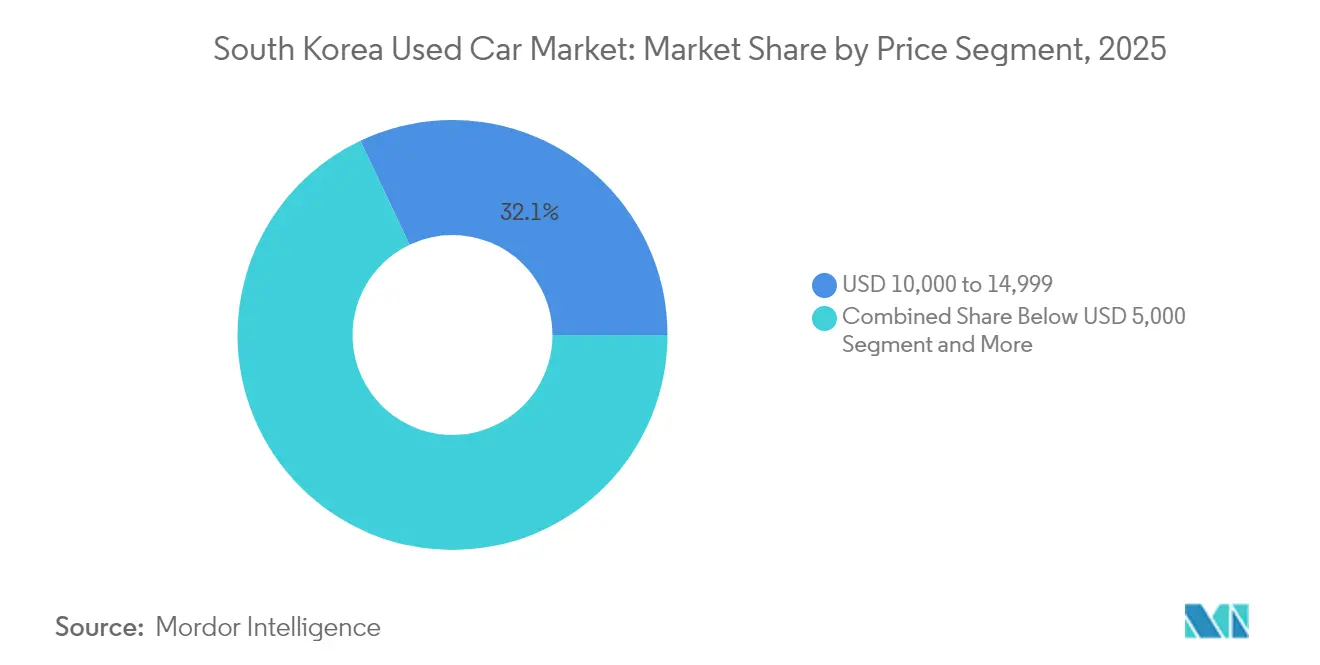
The USD 10,000 to 14,999 band locked in 32.05% of the South Korea used car market share in 2025, cementing its role as the sweet spot for middle-income buyers. At the top, the USD 30,000+ tier grows at 9.91% CAGR, buoyed by demand for near-new luxury SUVs and electric vehicles. The South Korea used car market share for premium tiers strengthens as access to financing widens and brand aspiration rises among younger professionals.
Price elasticity varies across regions. Metropolitan buyers often trade up, leveraging competitive leasing offers, while rural buyers gravitate toward utilitarian sedans. Dealers that segment inventory by zip-code demand patterns optimize carrying costs and turnaround time.
By Sales Channel: Digital Disruption Challenges Traditional Dealers
Multi-brand independents generated 55.25% of the South Korea used car market share in 2025, but pure-play e-retailers' 8.08% CAGR underscores shifting consumer journeys. Hybrid models in which customers reserve vehicles online and finalize transactions offline are becoming standard. Organized networks integrate click-to-finance and doorstep delivery to replicate e-commerce convenience without abandoning the reassurance of showrooms.
Traditional dealers respond with livestreamed walk-around sessions and AI-based price estimators to meet digital expectations. A successful omnichannel strategy blends online lead capture with in-store expertise, preserving dealer relevance while aligning with tech-savvy customer habits.
By Ownership: Multi-Owner Vehicles Dominate Supply
Multi-owner cars make up 61.76% of the South Korea used car market share in 2025, reflecting natural fleet aging and affordability considerations. First-owner resale, expanding at 5.09% CAGR, resonates with buyers prioritizing known maintenance history. Certified-pre-owned channels bolster first-owner resale value by guaranteeing condition and offering factory-backed service, thereby stretching the appeal of recent trade-ins.
For multi-owner units, dealers enhance credibility with blockchain VIN tracking and mandatory inspection uploads. This transparency lessens perceived risk and supports pricing discipline, positioning well-documented older vehicles as budget-friendly yet reliable options.
Geography Analysis
Seoul, Incheon, and Gyeonggi collectively drive a significant turnover, testament to their high incomes, dense populations, and early digital adoption. They also serve as policy laboratories: emission-grade restrictions force owners to shift from diesel to compliant petrol, hybrid, or electric models. Dealers in the capital region use sophisticated online marketing and same-day delivery to match the expectations of tech-literate consumers.
Second-tier hubs, Busan, Daegu, Gwangju, and Ulsan, cater to differing demand: port-linked Busan supports commercial vans, while the industrial belt around Ulsan values fleet reliability and service contracts. These areas tilt toward practical sedans and MPVs, requiring dealers to maintain diversified stock. Government regional development funds help local operators modernize inspection facilities, narrowing the quality gap with capital-area competitors.
Rural provinces still rely on community-based dealers who emphasize relationship selling. Limited charging infrastructure constrains EV adoption, dampening secondary EV prices compared with urban centers. However, the nation’s plan to install 500,000 public chargers by 2025 is expected to unlock pent-up rural demand, creating upside for dealers prepared to deploy mobile service vans and remote inspection tools.
Coverage of the used car market by Mordor Intelligence spans a wide geographic footprint, with regional analysis available for Africa, alongside detailed country-level intelligence for New Zealand, Myanmar, Ethiopia, Qatar, Oman, Netherlands, Tanzania, and South Africa, each shaped by local operating conditions.
Regulatory Landscape
South Korea regulates used-car transactions primarily under the Motor Vehicle Management Act (Automotive Management Act), with policy attention on advertisement integrity, disclosure, and consumer protection as online channels scale. Amendments tracked in 2025 tightened requirements for internet listings, including disclosing whether a seller is acting as a direct seller or an intermediary and providing intermediary details, supported by an Article 58-8 used-car sales information system framework and penalty surcharges that can reach up to 50% of profits for false advertising.
In 2026, authorities have moved further toward platform accountability and anti-fraud controls. As of June 2026, rules require owner pre-approval before a vehicle can be advertised for sale on platforms, which increases compliance expectations for portals and dealers that rely on high listing velocity. MOLIT has also prepared additional consumer-protection measures for July 2026 focused on preventing falsification of vehicle performance and condition records, including a mandatory total-price display approach and stronger seller liability, which raises the bar for standardized inspections and auditable documentation for organized dealers and OEM-certified programs.
Competitive Landscape
The competitive landscape indicates a moderately concentrated setting that rewards scale without stifling innovation. Leading firms integrate AI-guided condition grading and blockchain verification to elevate consumer trust. Partnerships with OEM leasing arms secure pipelines of recent off-lease vehicles, locking in stock quality and spread control.
Emerging digital-only entrants position themselves on transparency and speed, offering seven-day delivery and no-hassle return policies. This nudges incumbents to accelerate app development, introduce video appraisal, and broaden pick-up logistics. OEM-affiliated dealers exploit brand loyalty to extend certified-pre-owned coverage nationwide. Traditional multi-brand lots that invest in omnichannel touch-points hold their ground, but those ignoring tech upgrades face declining footfall.
Strategic moves recently underscore the push toward customer-centric models: One platform introduced seven-day delivery for its verified stock, while a multi-brand luxury retailer announced a dedicated portal targeting imported used cars. Hyundai inaugurated its own certified division with 272-point checks, reinforcing the manufacturer's commitment to the secondary market.
South Korea Used Car Industry Leaders
KB Cha Cha Cha
K Car
Encar
HeyDealer
Hyundai Glovis (H Promise)
- *Disclaimer: Major Players sorted in no particular order

Market Opportunities and Future Outlook
Tightening advertising and documentation rules, including owner pre-approval for listings in June 2026 and MOLIT's July 2026 consumer-protection push targeting performance-record falsification, creates room for platforms and organized dealers to operationalize compliant digital workflows (verification, standardized inspection evidence, and total-price disclosure). The regulatory direction supports investment in remote appraisal, vehicle-history reporting, and battery-health diagnostics for used EVs, particularly as policy support for used EV transactions (subsidies referenced in the market context) increases the need for consistent condition grading and warranty-transfer handling.
Used-car exports are also being positioned as a strategic growth lane at the policy level. In July 2026, a bill introduced by lawmaker Song Young-gil framed the used-car export industry as a national strategic industry and outlined mechanisms such as five-year master plans, export special zones, and an integrated export system with financial and guarantee support. This approach supports more professional export sourcing, reconditioning, and documentation. On the company side, vertical integration efforts, such as the linkage of KG Mobility (manufacturing), K Car (distribution), and K Car Capital (finance), point to bundled offerings that extend beyond retail into financing and service attachments, offering a template for scaling organized used-car ecosystems in South Korea.
Recent Industry Developments
- July 2026: K Car topped the used-car platform category of the 2026 National Customer Satisfaction Index for the second consecutive year. The result underscores dominance in the online used-car platform space. Brands credibility and consumer trust bolster online sales momentum and inventory turnover.
- June 2026: KG Group via subsidiary KG Steel announced an agreement to acquire approximately 72.2 percent of K Car from Hahn and Company. The deal signals major consolidation in the used-car distribution value chain. Vertical integration with manufacturing and financing helps stabilize stock and pricing dynamics.
- May 2026: K Car launched Safe Direct Trade, a service for peer-to-peer used car transactions with owner verification and trade quality certification. The introduction of a compliant P2P channel within established platform expands multi-channel reach. Addressing safety concerns could increase transaction volume.


Research Methodology Framework and Report Scope
Market Definition and Coverage
For this study, the market is defined as the value generated from used (pre-owned) vehicle transactions in South Korea across organized and unorganized channels, counted at the point of sale and reflected in USD.
Scope exclusions: This sizing excludes brand-new vehicle sales, most aftersales-only services (such as repairs and insurance sold separately), and pure financing value that is not part of the vehicle transaction price.
Segmentation Overview
- By Vehicle Type
- Hatchbacks
- Sedans
- Sport-Utility Vehicles (SUVs)
- Multi-Purpose Vehicles (MPVs)
- Others (convertibles, coupes, crossovers, sports cars)
- By Vendor Type
- Organised
- Unorganised
- By Fuel Type
- Petrol
- Diesel
- Hybrid (HEV and PHEV)
- Battery-Electric (BEV)
- LPG / CNG / Others
- By Vehicle Age
- 0 to 2 Years
- 3 to 5 Years
- 6 to 8 Years
- 9 to 12 Years
- Above 12 Years
- By Price Segment
- Below USD 5,000
- USD 5,000 to USD 9,999
- USD 10,000 to USD 14,999
- USD 15,000 to USD 19,999
- USD 20,000 to USD 29,999
- USD 30 000 and Above
- By Sales Channel
- Online Digital Classified Portals
- Pure-play e-Retailers
- OEM-Certified Online Stores
- Offline OEM-Franchised Dealers
- Multi-brand Independent Dealers
- Physical Auction Houses
- By Source
- Online
- Offline
- By Ownership
- First-owner Resale
- Multi-owner
Data Sources, Market Sizing, and Validation
Desk Research
Desk work started with mapping how many vehicles circulate through the used ecosystem and what price levels are realistic by age and vehicle class, since those two items shape most of the value pool. We used public statistics and rules to ground the model, such as national vehicle registration publications, transport and road-safety authority datasets, customs and trade statistics for used vehicle flows, and macro series like CPI and FX from the central bank and government statistics portals.
We also reviewed non-paywalled materials that help explain transaction behavior and supply patterns, such as industry association releases, auction and dealer disclosures, and listed-company filings and investor presentations tied to used vehicle operations. Where needed, we used paid subscriptions for company financials and news intelligence, and shipment-level trade databases to sanity-check volumes and mix shifts, while keeping the market model repeatable with mainstream sources. The desk sources listed above are illustrative, and we relied on other public documents and datasets for collection, cross-checks, and clarification.
Primary Interviews and Surveys
Primary validation focused on how prices move in practice and how volumes split across dealer retail, online listings, auctions, and direct-to-consumer routes. We spoke with dealer principals, marketplace and auction operators, fleet remarketing participants, and service partners to confirm key inputs that are hard to read cleanly from public tables. We also cross-checked those assumptions with people close to buyer behavior, including credit sensitivity, shifts in preference toward SUVs and EVs, and how quickly nearly-new inventory gets absorbed.
Distribution of primary research fieldwork respondents
| Company type | Respondent position |
|---|---|
| Top tier: 39% | CXOs: 14% |
| Mid tier: 43% | Functional/Unit leaders: 41% |
| Smaller Players: 18% | Managers: 45% |
Market-Sizing & Forecasting
Sizing was built using a top-down demand pool reconstruction, where used-vehicle transaction volumes are rebuilt from national vehicle parc turnover signals, re-registration trends, and trade-linked used vehicle inflows and outflows, which are then converted into value using observed pricing bands. To keep the totals realistic, we added selective bottom-up checks, including channel checks on retail versus auction throughput and sampled price times volume logic for common body types and age brackets.
Key inputs in the model include annual used-vehicle transaction volume, average selling price progression by vehicle age, the share of online-assisted transactions, the mix shift between passenger cars and SUVs, and the growing share of EVs and nearly-new lease returns. When data gaps appeared, we set ranges from interview feedback and then narrowed them using the most stable public signals, so outliers did not distort the final total.
For forecasting, we used scenario analysis supported by short time-series smoothing on volume and price drivers, since policy changes and consumer sentiment can shift the curve quickly. Assumptions on FX and inflation were held consistent across the timeline so the USD series remains comparable year to year.
Data Validation & Update Cycle
Outputs were checked against independent signals, including vehicle parc movement, reported transaction counts, and known pricing behavior during demand slowdowns, and any large variance was investigated before final sign-off. If a parameter moved beyond a reasonable range, we revisited the source trail and triggered interview follow-ups to confirm whether the change was real or a data artifact.
Before publication, the model and narrative went through multi-step analyst reviews so calculation links, unit conversions, and implied averages stayed consistent. Reports are refreshed annually, and interim updates are made when material events occur, followed by a final pre-delivery pass so clients receive the latest updated view.
Mordor Intelligence's South Korea Used Car Market Size Compared Against Other Published Estimates
Published estimates for South Korea used cars can look far apart because they do not always count the same transaction value, and they can also use different years, FX timing, and channel coverage. In practice, the biggest swings come from whether auction and dealer margins are treated as market value, or whether the full used-vehicle selling price is counted, and whether exports are mixed into the same value pool.
Some external figures combine domestic used-vehicle sales with adjacent value pools like export realization and broader mobility-related revenues. For Mordor Intelligence, the model counts the value of used vehicles transacted within South Korea, and it keeps financing-only value and most aftersales-only services outside the market number, which reduces double counting when channels overlap.
Benchmark comparison
| Source | Market Size | Gaps in Research Methodology |
|---|---|---|
| Mordor Intelligence | USD 24.11 B (2025) | |
| Trade Journal A | USD 27.80 B (2025) | Often reflects listing or advertised prices and then applies a broad uplift for dealer activity, which can overstate realized transaction values when discounting and inventory churn are high. |
| Industry Association B | USD 21.60 B (2025) | May anchor the value pool to reported dealer turnover and taxable declarations, which can miss peer-to-peer transfers and undercount online-assisted transactions routed through mixed channels. |
The spread in the table is largely explained by what is treated as the transaction value and how missing channels are handled. By keeping the number tied to observable transaction volume and realistic price bands, and then stress-testing it with channel checks and interview-backed ranges, the final estimate stays traceable and easier to reproduce.


Key Questions Answered in the Report
What is the current value of the South Korea used car market?
The market stands at USD 25.16 billion in 2026 and is forecast to reach USD 31.13 billion by 2031.
Which segment holds the largest South Korea used car market share?
Sedans lead with 39.85% share, while SUVs are the fastest-growing at a 6.38% CAGR.
How fast is the battery electric vehicle segment growing?
Battery electric vehicles post a 11.48% CAGR, the highest among all fuel types through 2031.
Why are organized dealers expanding faster than unorganized dealers?
Organized dealers provide certified inspections, transparent pricing, and integrated financing, helping them grow at 5.34% CAGR versus slower growth for fragmented independents.
How will Seoul’s 2027 diesel restrictions impact the market?
The policy accelerates turnover of older diesel stock, raising demand for petrol, hybrid, and electric models while pressuring resale values of older diesels.
Page last updated on:


 Your data is secure and never sold or shared.


