Market Overview
| Study Period | 2021 - 2031 |
|---|---|
| Forecast Data Period | 2026 - 2031 |
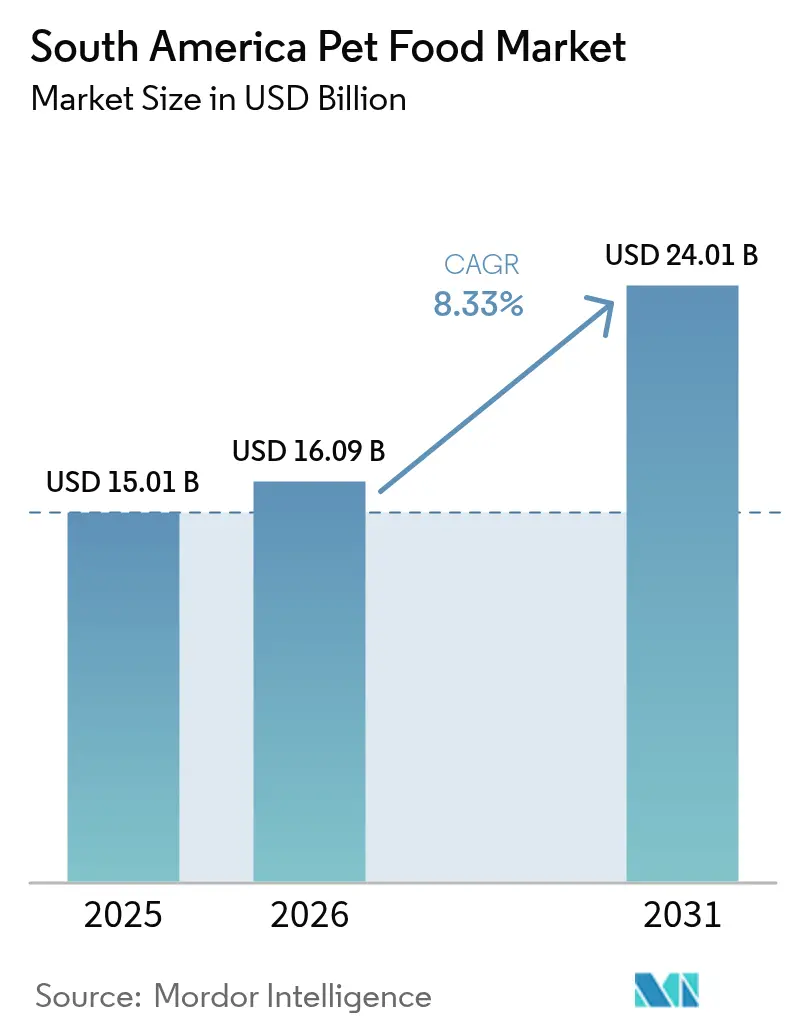
| Base Year Market Size (2025) | USD 15.01 Billion |
| Market Size (2026) | USD 16.09 Billion |
| Market Size (2031) | USD 24.01 Billion |
| Growth Rate (2026 - 2031) | 8.33% CAGR |
| Market Concentration | Low |
Major Players
*Disclaimer: Major Players sorted in no particular order Image © Mordor Intelligence. Reuse requires attribution under CC BY 4.0. |
|
South America Pet Food Market Analysis by Mordor Intelligence
The South America pet food market size was valued at USD 15.01 billion in 2025 and is projected to grow from USD 16.09 billion in 2026 to USD 24.01 billion by 2031, at a CAGR of 8.33% during the forecast period (2026-2031). Rising disposable incomes, an 82% urbanization rate recorded in 2024, and the growing view of pets as family members are moving premium formats from niche to mainstream. Formal registration of manufacturers increased in Brazil between 2024 and 2025, adding capacity for functional and veterinary diets that carry wider margins. E-commerce experienced substantial growth in 2025, leading to significantly reduced delivery times, often within a single day, in major cities such as São Paulo and Buenos Aires. This expansion contributed to a decline in specialty store market share. During the same period, currency stabilization in Argentina led to a significant reduction in the cost of importing functional ingredients, encouraging increased investment from multinational companies. Furthermore, rising prices of essential agricultural commodities such as corn and soybean meal during the previous harvest season placed pressure on profit margins and drove further exploration of insect-based protein as a means to mitigate volatility in feedstock supplies.
Key Report Takeaways
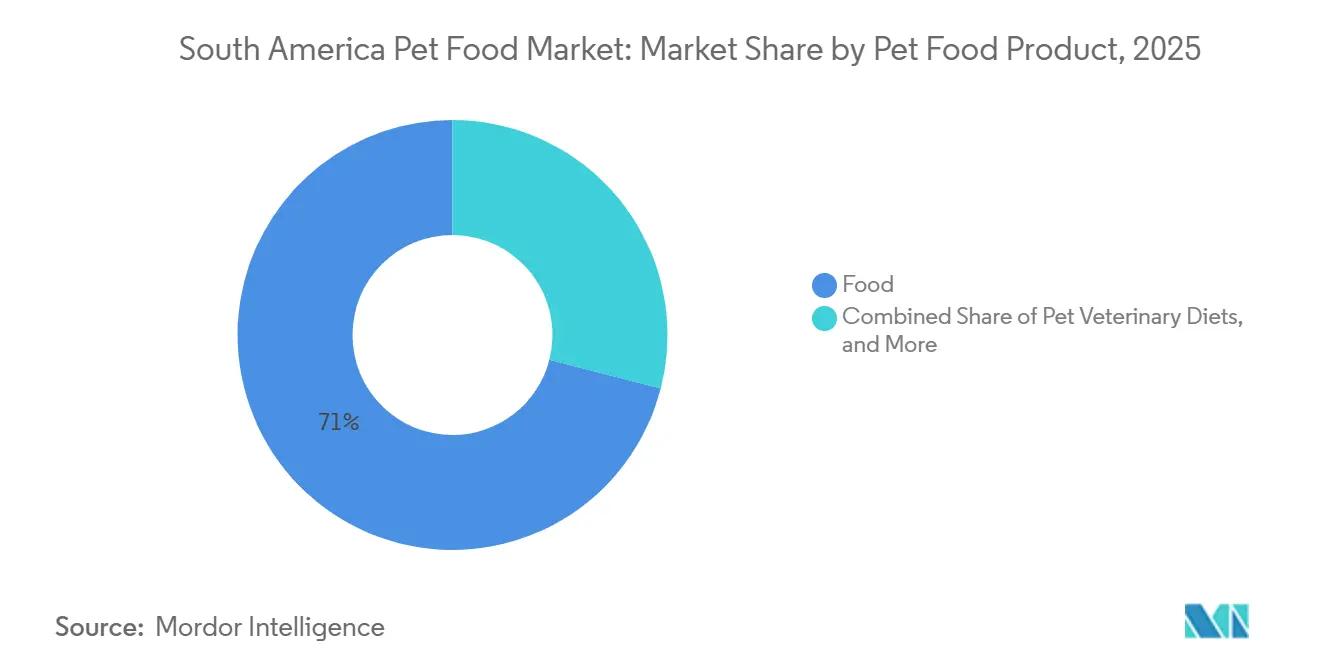
- By product category, food accounted for 71.0% of the South America pet food market share in 2025, while veterinary diets are projected to expand at a 9.6% CAGR through 2031.
- By pets, dogs commanded 68.0% revenue share in 2025 and are advancing at an 8.7% annual growth rate in major urban centers in 2031.
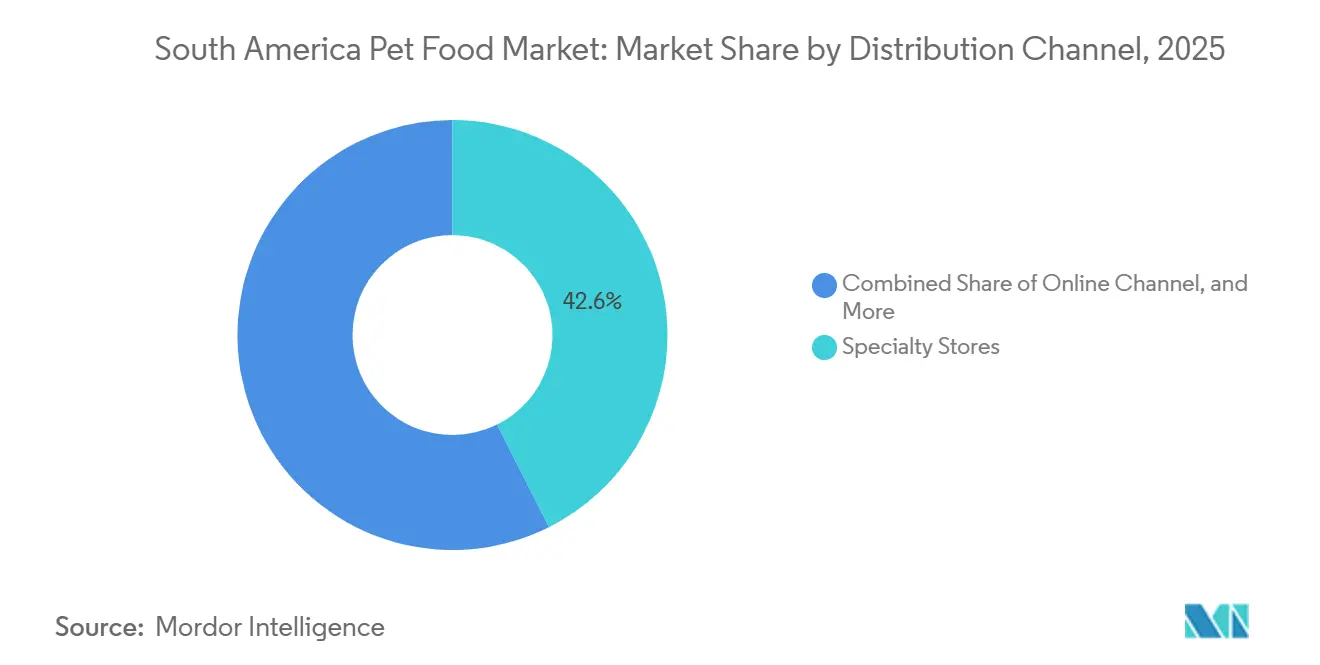
- By distribution channel, specialty stores led with 42.6% share of the South America pet food market size in 2025, whereas online platforms are forecast to post the fastest channel CAGR of 9.8% to 2031.
- By geography, Brazil captured 62.1% of the revenue share in 2025, while Argentina is poised for the fastest expansion, with a 9.2% CAGR projected through 2031.
- The market remains fragmented, with the top five companies, Mars, Incorporated, Nestlé Purina PetCare (Nestlé S.A.), BRF S.A., PremieRpet Holding, and Empresas Carozzi S.A., together accounting for only a modest share of the market in 2025.
Note: Market size and forecast figures in this report are generated using Mordor Intelligence’s proprietary estimation framework, updated with the latest available data and insights as of 2026.
South America Pet Food Market Trends and Insights
Drivers Impact Analysis*
| Driver | (~) % Impact on CAGR Forecast | Geographic Relevance | Impact Timeline |
|---|---|---|---|
| Rising humanization of pets fueling premiumization | +1.2% | Brazil, Chile, and Argentina urban centers | Medium term (2 – 4 years) |
| Expansion of e-commerce pet-specialty platforms | +1.0% | Brazil, Argentina, and Colombia | Short term (≤ 2 years) |
| Adoption of functional nutrition and nutraceuticals in preventive pet healthcare | +0.9% | Brazil, Chile, and Uruguay | Medium term (2 – 4 years) |
| Increasing cat ownership in densely populated urban centers | +0.8% | São Paulo, Rio de Janeiro, Buenos Aires, and Santiago | Long term (≥ 4 years) |
| Rising demand for grain-free formulas for allergy-prone breeds | +0.7% | Brazil, Argentina, and Chile | Medium term (2 – 4 years) |
| Innovation in insect-based proteins improving sustainability profile | +0.4% | Brazil, Chile, and Uruguay | Long term (≥ 4 years) |
| Source: Mordor Intelligence | |||
Rising Humanization of Pets Fueling Premiumization
Pet humanization in South America has emerged as a significant consumer trend, with pets increasingly regarded as family members rather than property. This shift is fueling the growth of the premium pet industry, encompassing high-end nutrition, specialized services, and legal recognition of pets as sentient beings. Key developments include rising demand for wet food and organic products, as well as the trend of "pet parents" treating animals like children. In 2023, South America imported USD 259.0 million worth of dog and cat food, marking a 75% increase since 2020. The primary exporters of dog and cat food to South America are the United States, the European Union (EU), and Mexico[1]Source: Foreign Agricultural Services, "Expanding the Dog and Cat Food Market in South America and the Caribbean," fas.usda.gov. Premium dry food accounted for a significant share of Brazilian kibble sales, driven by millennial and Generation Z pet owners who prioritize ingredient transparency. Brands are achieving margin gains by documenting health benefits through clinical studies, as demonstrated by Farmina’s grain-free, low-glycemic product range in Chile. New labeling protocols introduced by Brazil’s Ministry of Agriculture and Argentina’s Servicio Nacional de Sanidad y Calidad Agroalimentaria (SENASA) have extended the time-to-market for smaller competitors. This regulatory framework creates a compliance barrier, reinforcing premium pricing power for established brands.
Adoption of Functional Nutrition and Nutraceuticals in Preventive Pet Healthcare
Nutraceutical supplements targeting joint, digestive, and cognitive support are gaining traction as pet owners seek to delay the onset of chronic diseases and reduce veterinary expenses. A significant portion of Brazilian dogs were over 7 years old in 2025, driving demand for renal-support and mobility diets priced lower than long-term prescription medications. In November 2024, BRF S.A. introduced the Biofresh for Dogs Loin and Pineapple functional formula as part of its super-premium natural product line. This formula emphasizes high digestibility and gut health, catering to the growing preference for natural, functional pet food. Virbac SA leverages its veterinary distribution channel to maintain higher margins than those of mainstream pet food, supported by a growing adoption rate of pet insurance that covers preventive care products, which further encourages the use of nutraceutical supplements.
Increasing Cat Ownership in Densely Populated Urban Centers
The South American pet food market is experiencing rapid growth, driven by rising cat populations in key countries. Dogs currently hold the majority of the market share, but the cat food segment is projected to grow, driven by factors such as urbanization, smaller living spaces, and lower maintenance costs, which are increasing the popularity of cats. Cat populations are rising in cities such as São Paulo, Buenos Aires, and Santiago, driven by apartment living and dual-income households. In Brazil, the cat population was 22.1 million in 2025, with the Brazilian Shorthair, known for its agility, being the most popular breed [2]Source: World Population Review, "Cat Population by Country 2026," worldpopulationreview.com. Cats consume more premium calories per capita than dogs because they are obligate carnivores that require a higher protein intake. Brands focusing on single-serve wet pouches and high-meat kibble can command price premiums. Online purchasing is gaining traction, particularly in Buenos Aires, where many cat owners lack vehicle access and prefer the convenience of doorstep delivery for four-kilogram bags of cat food.
Innovation in Insect-Based Proteins Improving Sustainability Profile
Production costs for black soldier fly larvae meal have significantly decreased in recent years as Brazil and Chile increased their production capacity. This development has enabled the availability of a high-protein ingredient that generates substantially lower greenhouse gas emissions than traditional poultry meal. Companies such as Farmina were among the first to introduce limited-ingredient diets, emphasizing both hypoallergenic and environmentally friendly benefits in a single product offering. Despite these advancements, consumer acceptance is still in its early stages, with only a small proportion of Brazilian pet owners willing to try insect-based food. Interest is notably higher among younger, urban consumers, with considerable growth. The formal approval granted by Brazil’s Ministry of Agriculture has removed a major regulatory hurdle, creating opportunities for broader production and market adoption.
Restraints Impact Analysis*
| Restraint | (~) % Impact on CAGR Forecast | Geographic Relevance | Impact Timeline |
|---|---|---|---|
| Volatility in raw meat and grain prices | -1.4% | Brazil, Argentina, and grain-dependent subregions | Short term (≤ 2 years) |
| Limited cold-chain infrastructure hinders wet food distribution | -1.0% | Argentina, Peru, Colombia, and interior Brazil | Medium term (2 – 4 years) |
| High informality in retail limits premium brand penetration | -0.9% | Argentina, Bolivia, and Paraguay | Medium term (2 – 4 years) |
| Stringent labeling regulations slowing nutraceutical launches | -0.7% | Brazil and Argentina regulatory regimes | Short term (≤ 2 years) |
| Source: Mordor Intelligence | |||
High Informality in Retail Limits Premium Brand Penetration
Corner stores and open-air markets play a significant role in pet food sales across Argentina and Brazil, accounting for a substantial share of the market. This reliance on these outlets highlights the strong demand for economy kibble, which is characterized by lower profit margins. These retail formats often lack critical infrastructure, such as refrigeration and point-of-sale education, which restricts their ability to stock and promote products like nutraceuticals and wet food that require specialized storage and handling. As efforts to formalize the market progress, supported by a growing number of manufacturers entering the industry, rural areas continue to rely heavily on unregistered trade. This dependence creates challenges for the visibility and distribution of premium pet food brands in these regions.
Stringent Labeling Regulations Slowing Nutraceutical Launches
Regulatory changes require clinical data to substantiate functional claims, leading to a substantial increase in dossier preparation costs and significantly extending the time required for approvals[3]Source: Servicio Nacional de Sanidad y Calidad Agroalimentaria, “Regulatory Updates,” senasa.gob.ar. During that period, numerous product launches were postponed due to these challenges. Large multinational corporations, such as Mars, Incorporated, and Nestlé Purina PetCare (Nestlé S.A.), can distribute these expenses across their extensive global operations, thereby mitigating the financial impact. On the other hand, smaller local companies, including Nutrire Indústria de Alimentos Ltda., face a much higher proportional financial burden, making compliance more challenging. Furthermore, the additional requirement for certification under the International Organization for Standardization (ISO) 22000 food safety standard escalates the overall compliance costs.
*Our forecasts treat driver/restraint impacts as directional, not additive. The impact forecasts reflect baseline growth, mix effects, and variable interactions.
Segment Analysis
By Pet Food Product: Food Dominates, Veterinary Diets Lead Growth
Food is the largest pet food product and captured 71.0% of the South America pet food market share in 2025, as shelf-stable kibble remains ubiquitous across income tiers. Dry kibble anchors weekly baskets in supermarkets, while wet products are gaining adoption in metropolitan areas, where a majority of Brazilian households already mix formats daily. The South America pet food market size for food products is projected to grow, buoyed by steady channel expansion and rising per-animal calorie spend. Capital expenditure, such as Nestlé Purina PetCare (Nestlé S.A.)’s 2024 Brazilian Real 2.5 billion (USD 500 million) wet-food facility, underscores multinationals' confidence in sustained category premiumization.
Veterinary diets are the fastest-growing segment at a 9.6% CAGR through 2031, driven by an aging pet population and expanding insurance coverage that reimburses therapeutic prescriptions. Renal-support recipes treat senior dogs with early kidney issues, while obesity formulas address the rising prevalence of sedentary urban lifestyles. The South America pet food market for veterinary diets is forecast to grow, elevating average selling prices and the margin mix. Prescription control, clinic distribution, and online vet consult bundles create a resilient moat for brands like Hill’s Pet Nutrition, Inc.


By Pets: Dogs Retain Scale, Cats Accelerate Premium Mix
Dogs represented the largest pet type, accounting for 68.0% of the South America pet food market in 2025, and exhibited the fastest growth with a CAGR of 8.7% during 2026-2031, driven by high-calorie demand among large breeds in rural Brazil and enduring cultural preferences in cities. Mass-market kibble continues to dominate dog nutrition, yet premium labels using grain-free and functional claims expanded shelf share. Growth will persist as owners trade up formulations that promise digestive or dermatological relief.
Cats, despite representing a smaller share of the overall market, are experiencing growth due to notable population increases in densely populated urban areas. Feline diets generally include a higher proportion of meat, leading to unit prices that are considerably higher than those for similar dog food formats. Premium wet pouches and freeze-dried toppers are particularly appealing to millennial consumers who value convenience and nutrient-rich options. The South America cat pet food market is projected to grow, prompting manufacturers to focus on protein-rich, single-serve packaging formats.
By Distribution Channel: Specialty Stores Hold Leadership, Online Channel Gains Velocity
Specialty stores are the largest distribution channel and account for 42.6% share of the South America pet food market in 2025, leveraging trained staff and curated assortments to justify higher prices. These outlets excel in selling nutraceuticals and therapeutic diets that require consultation. These outlets, including chains such as Petz in Brazil and independent pet boutiques, provide a tactile shopping experience where pet owners can compare formulas, sample treats, and obtain personalized nutrition advice. However, specialty stores are under pressure on margins from online channels. To address this, they are offering subscription models that ensure recurring revenue while lowering customer acquisition costs compared to one-time purchases.
Online retailers posted the fastest 9.8% CAGR through 2031, winning shoppers through subscription reorder convenience and aggressive digital marketing. As last-mile networks mature, the South America pet food market share for online platforms is projected to grow, accelerating data-driven personalization that lifts average order values. Supermarkets hold relevance for impulse treats and mass-kibble buys, but the depth of premium stock remains modest. Convenience and informal stores still account for a significant share of distribution channel revenue, but restrict premium brand reach due to limited shelf space and refrigeration.
Geography Analysis
Brazil is the largest geography and accounts for 62.1% of the South America pet food market share in 2025, underpinned by the continent’s highest pet population and the most advanced manufacturing base. Registered producers increased between 2024 and 2025, enabling premium segment rollouts that meet stringent Ministry of Agriculture standards. Online penetration is growing rapidly, accounting for a significant share of distribution channel revenue during the forecast period (2026–2031), supported by the widespread adoption of same-day fulfillment services in São Paulo. Investment activity continues to demonstrate strength, highlighted by Nestlé Purina PetCare's 2024 establishment of a wet-food production facility, which underscores sustained confidence in the market.
Argentina is the fastest-growing geography, forecast to post a 9.2% CAGR through 2031. Currency stabilization lowered ingredient import costs in 2025 and increased pet ownership in households. The pet ownership rate in the country has significantly increased, with a majority of households owning pets. This growth has been largely driven by the adoption of companion animals in Buenos Aires and other urban areas, where cats are becoming increasingly popular. However, informal retail channels in Argentina continue to account for a substantial share of sales, limiting the reach of premium brands and posing challenges for products like wet food and nutraceutical supplements that require more controlled merchandising environments.
The rest of South America, including Chile, Colombia, Peru, and Uruguay, is a growing market for pet food. Chile's market is experiencing steady growth, supported by rising middle-class incomes and Empresas Carozzi S.A.'s expansion of regional distribution networks. Colombia and Peru are witnessing a rise in e-commerce adoption, helping to offset the limited availability of specialty stores in these countries. Uruguay's early approval of insect protein provides a strategic opportunity to test innovative approaches in the market. Collectively, these markets play an important role in diversifying growth beyond Brazil's primary contributions.
Competitive Landscape
The market exhibits low concentration, with the top five companies, Mars, Incorporated, Nestlé Purina PetCare (Nestlé S.A.), BRF S.A., PremieRpet Holding, and Empresas Carozzi S.A., collectively representing a limited share of the market in 2025, leaving meaningful share for regional challengers. Multinationals Mars, Incorporated and Nestlé Purina PetCare leverage global research pipelines and vertically integrated sourcing to defend leadership in dry and wet mainstream food. Regional companies such as PremieRpet Holding and Nutrire Indústria de Alimentos Ltda. exploit local grain procurement to undercut imports on economy kibble, thereby securing shelf presence in price-sensitive neighborhoods. Mars, Incorporated’s São Paulo hub trims last-mile delivery to fewer than 24 hours, equipping the group to meet e-commerce service levels and protect share against pure-play online retailers.
Opportunities in veterinary diets and sustainability-focused niches are gaining prominence. Hill’s Pet Nutrition, Inc. and Dechra Pharmaceuticals Limited use prescription-only positioning, allowing them to charge significantly higher premiums than non-therapeutic product lines. Farmina Pet Foods Holding is preparing to introduce an insect-protein product in Chile within the next few years, combining hypoallergenic benefits with a substantially lower environmental impact than traditional poultry meal, appealing to environmentally conscious consumers. BRF S.A.’s recent approval from the United States Food and Drug Administration has opened a substantial export pipeline, further enhancing the global reputation of Brazilian products. Furthermore, start-ups are adopting online artificial intelligence-driven ingredient configurators, which are helping increase customer purchases through personalized product recommendations.
Regulation is exerting a growing influence on competitive dynamics. The 11-month functional-claim approval cycle in Brazil and Argentina escalates compliance costs, disproportionately hurting small and mid-sized enterprises. Meanwhile, volatile corn and soybean prices swing by 4 to 6 margin points for brands without hedging or own-farm integration. Groups with diversified protein inputs, including insect meal, show early resilience. Market leaders continue to invest in omnichannel data infrastructure to anticipate demand spikes and adjust merchandising in real time.
South America Pet Food Industry Leaders
-
Mars, Incorporated
-
Nestlé Purina PetCare (Nestlé S.A.)
-
BRF S.A.
-
PremieRpet Holding
-
Empresas Carozzi S.A.
- *Disclaimer: Major Players sorted in no particular order

Recent Industry Developments
- October 2025: The Italian manufacturer Farmina Pet Foods Holding has invested BRL 45 million (approximately USD 8 million) to establish a new distribution center (DC) in Bragança Paulista, Brazil. This 10,500-square-meter facility, situated next to the company's existing manufacturing plant, is intended to boost production capacity by 150% to address rising regional and international demand.
- May 2025: Adimax has opened a new pet food manufacturing facility in Mandirituba, Paraná, Brazil, with an investment of USD 24.8 million. This sixth facility increases production capacity by 7,000 metric tons per month, enabling the production of brands such as Fórmula Natural, Origens, Magnus, and Qualidy. The plant is intended to strengthen Adimax's position as a leading exporter.
- May 2025: The Guillermo Lehmann Cooperative in Argentina has introduced "Lokal," a premium pet food brand, backed by a USD 6 million production facility in San Jerónimo Norte, Santa Fe. The facility specializes in manufacturing additive-free dry dog and cat food, employing advanced extrusion, milling, and automated technologies to meet the growing demand for high-quality, sustainable pet nutrition.


South America Pet Food Market Report Scope
Pet food refers to animal feed specifically designed, formulated, and manufactured for domestic pets, primarily dogs and cats. It is intended to provide complete and balanced nutrition, including proteins, fats, vitamins, and minerals, or to serve as treats.
The South America pet food market report is segmented by pet food product into food, pet nutraceuticals or supplements, pet treats, and pet veterinary diets; by pet type into cats, dogs, and other pets; by distribution channel into convenience stores, online channel, specialty stores, supermarkets or hypermarkets, and other channels; and by geography into Argentina, Brazil, and the rest of South America. The market forecasts are provided in terms of value in USD and volume in metric tons.
By Pet Food Product
| Food | By Sub-Product | Dry Pet Food | Kibbles |
| Other Dry Pet Food | |||
| Wet Pet Food | |||
| Pet Nutraceuticals/Supplements | By Sub-Product | Milk Bioactives | |
| Omega-3 Fatty Acids | |||
| Probiotics | |||
| Proteins and Peptides | |||
| Vitamins and Minerals | |||
| Other Nutraceuticals | |||
| Pet Treats | By Sub-Product | Crunchy Treats | |
| Dental Treats | |||
| Freeze-dried and Jerky Treats | |||
| Soft and Chewy Treats | |||
| Other Treats | |||
| Pet Veterinary Diets | By Sub-Product | Diabetes | |
| Digestive Sensitivity | |||
| Oral Care Diets | |||
| Renal | |||
| Urinary Tract Disease | |||
| Obesity Diets | |||
| Derma Diets | |||
| Other Veterinary Diets |
By Pets
| Cats |
| Dogs |
| Other Pets |
By Distribution Channel
| Convenience Stores |
| Online Channel |
| Specialty Stores |
| Supermarkets/Hypermarkets |
| Other Channels |
By Geography
| Brazil |
| Argentina |
| Rest of South America |
| By Pet Food Product | Food | By Sub-Product | Dry Pet Food | Kibbles |
| Other Dry Pet Food | ||||
| Wet Pet Food | ||||
| Pet Nutraceuticals/Supplements | By Sub-Product | Milk Bioactives | ||
| Omega-3 Fatty Acids | ||||
| Probiotics | ||||
| Proteins and Peptides | ||||
| Vitamins and Minerals | ||||
| Other Nutraceuticals | ||||
| Pet Treats | By Sub-Product | Crunchy Treats | ||
| Dental Treats | ||||
| Freeze-dried and Jerky Treats | ||||
| Soft and Chewy Treats | ||||
| Other Treats | ||||
| Pet Veterinary Diets | By Sub-Product | Diabetes | ||
| Digestive Sensitivity | ||||
| Oral Care Diets | ||||
| Renal | ||||
| Urinary Tract Disease | ||||
| Obesity Diets | ||||
| Derma Diets | ||||
| Other Veterinary Diets | ||||
| By Pets | Cats | |||
| Dogs | ||||
| Other Pets | ||||
| By Distribution Channel | Convenience Stores | |||
| Online Channel | ||||
| Specialty Stores | ||||
| Supermarkets/Hypermarkets | ||||
| Other Channels | ||||
| By Geography | Brazil | |||
| Argentina | ||||
| Rest of South America | ||||


Market Definition
- FUNCTIONS - Pet foods are usually intended to provide complete and balanced nutrition to the pet but are primarily used as functional products. The scope includes the food and supplements consumed by pets including veterinary diets. Supplements/nutraceuticals that are directly supplied to pets are considered within the scope.
- RESELLERS - Companies engaged in reselling of pet food without value addition have been excluded from the market scope, in order to avoid double counting.
- END CONSUMERS - Pet owners are considered to be the end-consumers in the market studied.
- DISTRIBUTION CHANNELS - Supermarkets/hypermarkets, specialty stores, convenience stores, online channels and other channels are considered within the scope. The stores which are exclusively providing pet related basic and custom products are considered within the scope of specialty stores.
| Keyword | Definition |
|---|---|
| Pet Food | The scope of pet food includes the food that is eatable by pets including food, treats, veterinary diets, and nutraceuticals/supplements. |
| Food | Food is animal feed intended for consumption by pets. It is formulated to provide essential nutrients and meet the dietary needs of various types of pets, including dogs, cats, and other animals. These are generally segmented into dry and wet pet foods. |
| Dry Pet Food | Dry pet foods may be extruded/baked (kibbles) or flaked. They have a lower moisture content, typically around 12-20%. |
| Wet Pet Food | Wet pet food, also known as canned pet food or moist pet food, generally has a higher moisture content compared to dry pet food, often ranging from 70-80%. |
| Kibbles | Kibbles are dry, processed pet food in small, bite-sized pieces or pellets. They are specifically formulated to provide balanced nutrition for various domestic animals, such as dogs, cats, and other animals. |
| Treats | Pet Treats are special food items or rewards given to pets, to show affection, and encourage good behavior. They are especially used during training. Pet treats are made from various combinations of meat or meat-derived materials with other ingredients. |
| Dental Treats | Pet dental treats are specialized treats that are formulated to promote good oral hygiene in pets. |
| Crunchy Treats | It is a type of pet treat that has a firm and crispy texture which can be a good source of nutrition for pets. |
| Soft and chewy treats | Soft and Chewy pet treats are a type of pet food product that is formulated to be easy to chewy and digest. They are usually made from soft and pliable ingredients, such as meat, poultry, or vegetables, that have been blended and formed into bite-sized pieces or strips. |
| Freeze-dried & Jerky Treats | Freeze-dried and jerky treats are snacks given to pets, that are prepared through a special preservation process, without damaging the nutritional content, resulting in long-lasting, nutrient-rich treats. |
| Urinary Tract Disease Diets | These are commercial diets that are specifically formulated to promote urinary health and reduce the risk of urinary tract infections and other urinary problems. |
| Renal Diets | These are specialized pet foods formulated to support the health of pets with kidney disease or renal insufficiency. |
| Digestive Sensitivity Diets | Digestive-sensitive diets are specially formulated to meet the nutritional needs of pets with digestive issues such as food intolerances, allergies, and sensitivities. These diets are designed to be easily digestible and to reduce the symptoms of digestive problems in pets. |
| Oral Care Diets | Oral care diets for pets are specially formulated diets produced to promote oral health and hygiene in pets. |
| Grain-Free Pet Food | Pet food that does not contain common grains like wheat, corn, or soy. Grain-free diets are often preferred by pet owners seeking alternative options or if their pets have specific dietary sensitivities. |
| Premium Pet Food | High-quality pet food formulated with superior ingredients often offers additional nutritional benefits compared to standard pet food. |
| Natural Pet Food | Pet food made from natural ingredients, with minimal processing and without artificial preservatives. |
| Organic Pet Food | Pet food is produced using organic ingredients, free from synthetic pesticides, hormones, and genetically modified organisms (GMOs). |
| Extrusion | A manufacturing process used to produce dry pet food, where ingredients are cooked, mixed, and shaped under high pressure and temperature. |
| Other Pets | Other pets include birds, fish, rabbits, hamsters, ferrets, and reptiles. |
| Palatability | The taste, texture, and aroma of pet food influence its appeal and acceptance by pets. |
| Complete and Balanced Pet Food | Pet food that provides all essential nutrients in appropriate proportions to meet the nutritional needs of pets without additional supplementation. |
| Preservatives | These are the substances that are added to pet food to extend its shelf life and prevent spoilage. |
| Nutraceuticals | Food products that offer health benefits beyond basic nutrition, often contain bioactive compounds with potential therapeutic effects. |
| Probiotics | Live beneficial bacteria that promote a healthy balance of gut flora, supporting digestive health and immune function in pets. |
| Antioxidants | Compounds that help neutralize harmful free radicals in the body, promoting cellular health and supporting the immune system in pets. |
| Shelf-Life | The duration of which pet food remains safe and nutritionally viable for consumption after its production date. |
| Prescription diet | Specialized pet food formulated to address specific medical conditions under veterinary supervision. |
| Allergen | A substance that can cause allergic reactions in some pets, leading to food allergies or sensitivities. |
| Canned food | Wet pet food that is packed in cans and contains higher moisture content than dry food. |
| Limited ingredient diet (LID) | Pet food formulated with a reduced number of ingredients to minimize potential allergens. |
| Guaranteed Analysis | The minimum or maximum levels of certain nutrients present in pet food. |
| Weight management | Pet food designed to help pets maintain a healthy weight or support weight loss efforts. |
| Other Nutraceuticals | It includes prebiotics, antioxidants, digestive fiber, enzymes, essential oils and herbs. |
| Other Veterinary Diets | It includes weight management diets, skin and coat health, cardiac care, and joint care. |
| Other Treats | It includes rawhides, mineral blocks, lickables, and catnips. |
| Other Dry Foods | It includes cereal flakes, mixers, meal toppers, freeze-dried foods, and air-dried foods. |
| Other Animals | It includes birds, fish, reptiles, and small animals (rabbits, ferrets, hamsters). |
| Other Distribution Channels | It includes veterinary clinics, local unregulated stores, and feed and farm stores. |
| Proteins and Peptides | Proteins are large molecules composed of basic units called amino acids which help in the growth and development of pets. Peptides are the short string of 2 to 50 amino acids. |
| Omega-3 fatty acids | Omega-3 fatty acids are essential polyunsaturated fats that play a crucial role in the overall health and well-being of Pets |
| Vitamins | Vitamins are the essential organic compounds that are essential for vital physiological functioning. |
| Minerals | Minerals are naturally occurring inorganic substances that are essential for various physiological functions in pets. |
| CKD | Chronic Kidney Disease |
| DHA | Docosahexaenoic Acid |
| EPA | Eicosapentaenoic Acid |
| ALA | Alpha-linolenic Acid |
| BHA | Butylated Hydroxyanisol |
| BHT | Butylated Hydroxytoluene |
| FLUTD | Feline Lower Urinary Tract Disease |


Research Methodology
Mordor Intelligence follows a four-step methodology in all our reports.
- Step-1: IDENTIFY KEY VARIABLES: In order to build a robust forecasting methodology, the variables and factors identified in Step-1 are tested against available historical market numbers. Through an iterative process, the variables required for market forecast are set and the model is built on the basis of these variables.
- Step-2: Build a Market Model: Market-size estimations for the forecast years are in nominal terms. Inflation is not a part of the pricing, and the average selling price (ASP) is kept constant throughout the forecast period.
- Step-3: Validate and Finalize: In this important step, all market numbers, variables and analyst calls are validated through an extensive network of primary research experts from the market studied. The respondents are selected across levels and functions to generate a holistic picture of the market studied.
- Step-4: Research Outputs: Syndicated Reports, Custom Consulting Assignments, Databases & Subscription Platforms


