Dynamic Random Access Memory (DRAM) Market Size and Share
Market Overview
| Study Period | 2020 - 2031 |
|---|---|
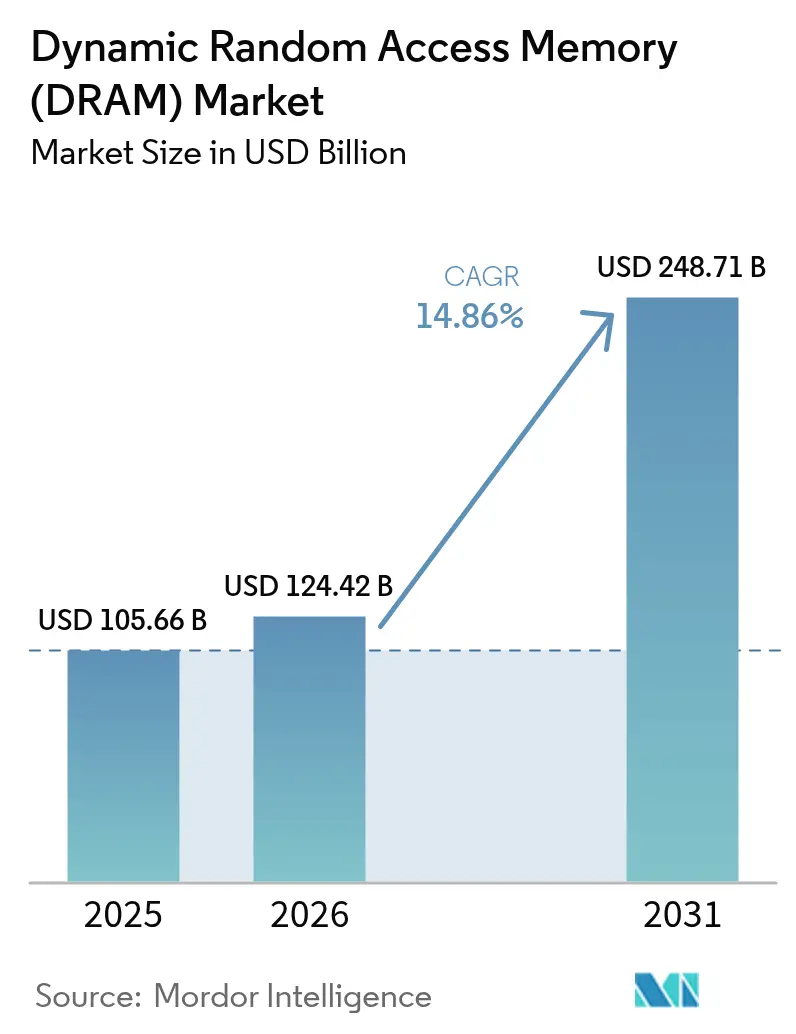
| Market Size (2026) | USD 124.42 Billion |
| Market Size (2031) | USD 248.71 Billion |
| Growth Rate (2026 - 2031) | 14.86% CAGR |
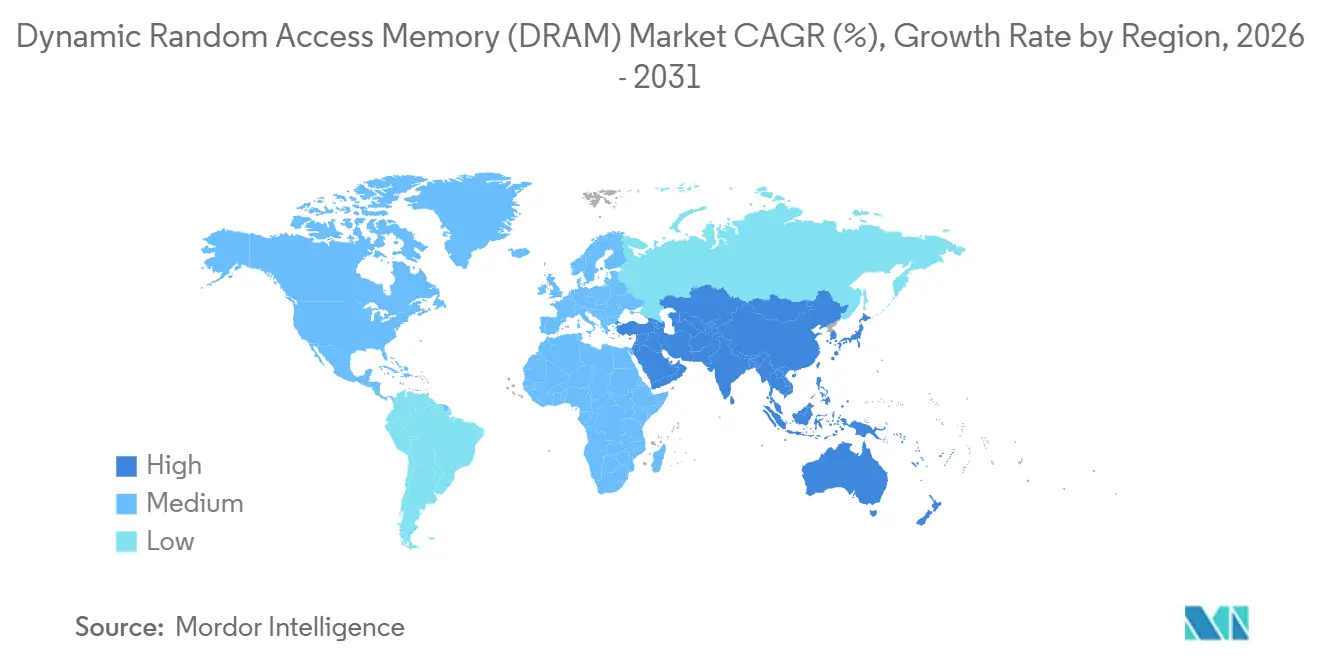
| Fastest Growing Market | Middle East |
| Largest Market | Asia Pacific |
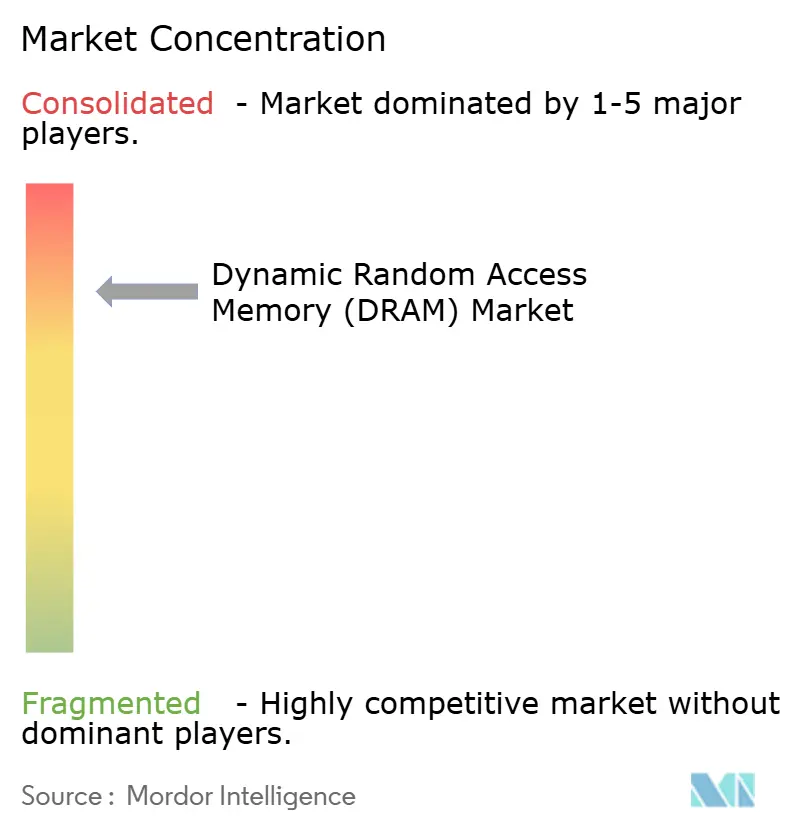
| Market Concentration | High |
Major Players *Disclaimer: Major Players sorted in no particular order Image © Mordor Intelligence. Reuse requires attribution under CC BY 4.0. | |
Dynamic Random Access Memory (DRAM) Market Analysis by Mordor Intelligence
The dynamic random access memory market size is projected to be USD 105.66 billion in 2025, USD 124.42 billion in 2026, and reach USD 248.71 billion by 2031, growing at a CAGR of 14.86% from 2026 to 2031. Rising AI‐centric server deployments, heavier DRAM footprints in 5G smartphones, and the migration of automotive domain controllers toward high-temperature LPDDR5 are expanding average content per device. Supply re-allocation toward cloud service providers has tightened availability for PC channels, supporting firmer pricing despite lingering inventory risk. Meanwhile, export controls that restrict high-speed DDR5 modules to China are diverting premium density to North America and Europe, accelerating node transitions below 10 nanometers. Capital subsidies under the United States CHIPS and Science Act and the European Chips Act are also catalyzing fresh wafer capacity, though most projects target 2027-2028 ramp-up windows.
Key Report Takeaways
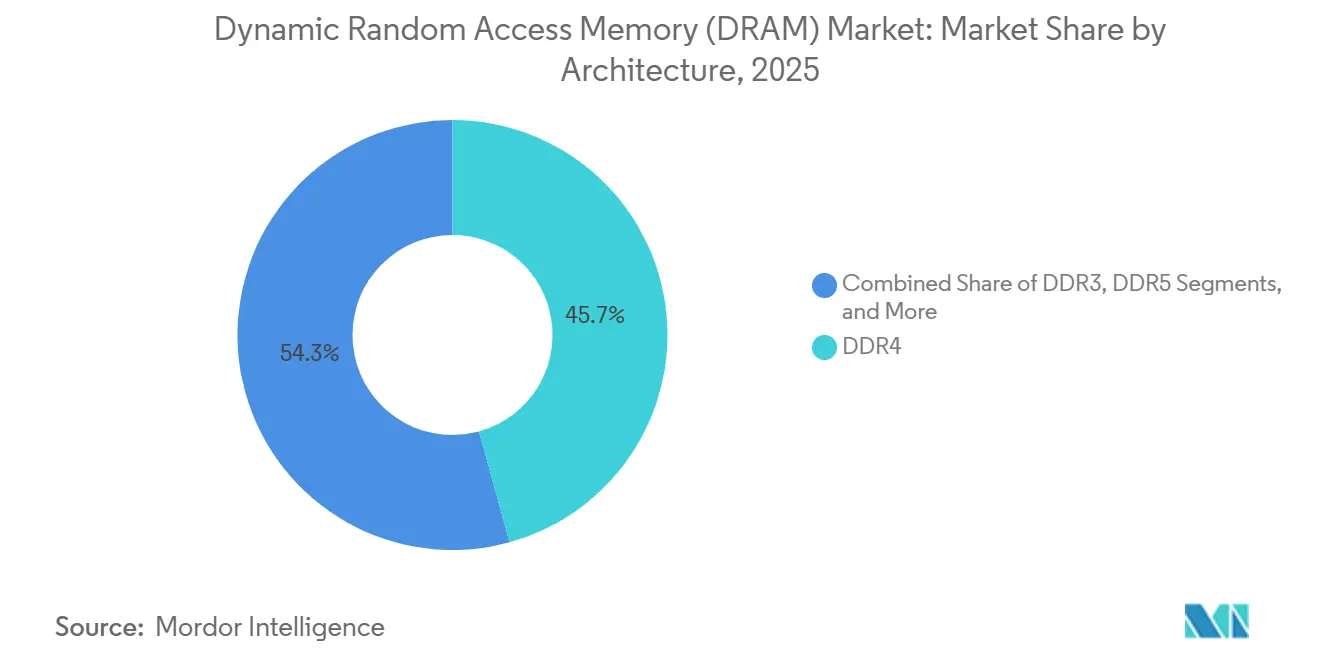
- By architecture, DDR4 led with 45.73% revenue share in 2025, while DDR5 is forecast to expand at a 14.91% CAGR through 2031.
- By technology node, sub-10 nanometer EUV processes captured 35% of the dynamic random access memory market size in 2025 and are projected to advance at 14.95% CAGR over 2026-2031.
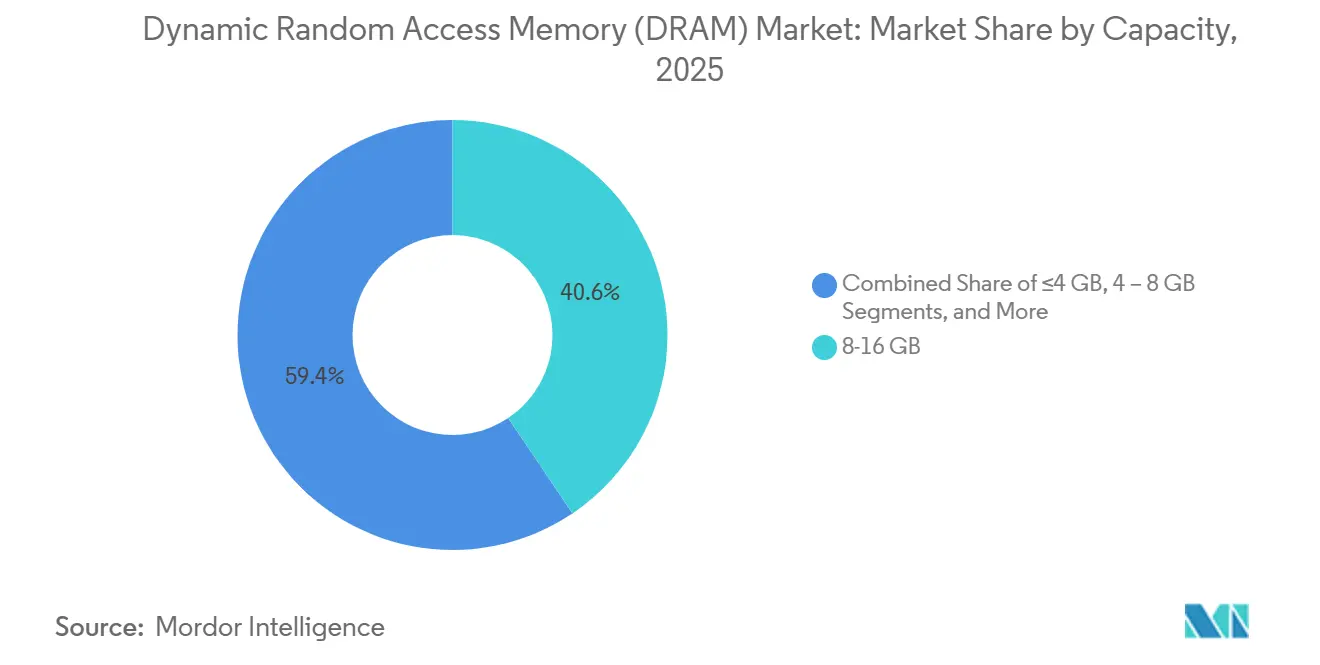
- By capacity, modules of ≥16 gigabytes accounted for 30% of the dynamic random access memory market share in 2025 and are set to grow at a 14.89% CAGR to 2031.
- By end-use application, automotive electronics registered the fastest growth rate at 15.03% between 2026 and 2031, outpacing smartphones, servers, and PCs.
- By geography, Asia-Pacific controlled 60.63% of 2025 revenue, whereas the Middle East is forecast to post the highest regional CAGR at 15.08% to 2031.
Note: Market size and forecast figures in this report are generated using Mordor Intelligence’s proprietary estimation framework, updated with the latest available data and insights as of 2026.
Global Dynamic Random Access Memory (DRAM) Market Trends and Insights
Drivers Impact Analysis*
| Driver | (~) % Impact on CAGR Forecast | Geographic Relevance | Impact Timeline |
|---|---|---|---|
| Ascending content footprint of AI and generative-AI workloads in hyperscale data centers | +3.2% | Global, North America and Asia-Pacific focus | Medium term (2–4 years) |
| Soaring LPDDR adoption in 5G-enabled smartphones across Asia-Pacific | +2.8% | Asia-Pacific core, spill-over to Middle East and Africa | Short term (≤ 2 years) |
| Automotive domain and zonal controllers migrating from NOR to high-temperature DRAM | +2.4% | Global, early gains in Europe and North America | Long term (≥ 4 years) |
| Cloud service providers transitioning to CXL-attached memory pools | +1.9% | North America and Europe, emerging Asia-Pacific | Medium term (2–4 years) |
| Proliferation of graphics DRAM in AR/VR wearables and edge-AI headsets | +1.5% | North America and Asia-Pacific | Medium term (2–4 years) |
| On-device foundation models driving >128 GB mobile DRAM designs | +1.3% | Asia-Pacific and North America flagship tiers | Long term (≥ 4 years) |
| Source: Mordor Intelligence | |||


Ascending Content Footprint of AI and Generative-AI Workloads in Hyperscale Data Centers
Hyperscalers now configure 512-768 GB of DDR5 per dual-socket server to sustain large-language-model inference, tripling memory density versus legacy web tiers. Compute Express Link memory expanders decouple capacity from CPU sockets, allowing a single host to address up to 4 TB of pooled DRAM and further inflating demand.[1]Compute Express Link Consortium, “CXL 3.1 Specification,” Computeexpresslink.org Samsung reported 110% year-over-year growth in DDR5 shipments to cloud customers in Q4 2025, outstripping overall bit output. Sovereign-AI mandates in Europe and the Middle East add incremental clusters that each require 256 GB per edge node. DDR5’s 1.1-V operating rail also lowers energy per bit by 20%, aligning with net-zero targets and supporting premium module pricing.
Soaring LPDDR Adoption in 5G-Enabled Smartphones Across Asia-Pacific
Premium 5G handsets shipped in 2025 standardized LPDDR5X to sustain millimeter-wave throughput, raising DRAM content to 12-16 GB per device. SK Hynix lifted LPDDR5X to 40% of mobile output by February 2026 as Chinese OEMs raced to differentiate flagships. India’s Production-Linked Incentive program rewarded higher local content, nudging assemblers toward 16-GB configurations. Apple increased baseline memory on the iPhone 16 Pro series to 12 GB for on-device image generation. Tight advanced-packaging capacity at TSMC kept LPDDR5X contract prices 35% above LPDDR5, protecting supplier margins amid flat unit growth.
Automotive Domain and Zonal Controllers Migrating from NOR to High-Temperature DRAM
Automotive-grade LPDDR5 shipments jumped 85% in 2025 as tier-1 suppliers replaced discrete NOR with pooled DRAM inside domain controllers, reducing latency from >100 ns to sub-10 ns. Zonal architectures consolidate up to 12 ECUs into 4-6 compute nodes, each qualified to AEC-Q100 Grade 2 standards for −40 °C to 105 °C operation. Micron reached a USD 2 billion automotive DRAM run-rate on the back of Tesla’s Hardware 4.0 computer that integrates 32 GB of LPDDR5. Real-time fusion of lidar, radar, and vision streams requires 8-16 GB buffers to maintain a 50-millisecond functional-safety budget mandated under ISO 26262. Mandatory over-the-air update capability for all EU vehicles after January 2026 adds another 4-8 GB staging area per car.
Cloud Service Providers Transitioning to CXL-Attached Memory Pools
Amazon Web Services demonstrated live VM migration across hosts using CXL 3.0 memory expanders at re-Invent 2025, validating production readiness. Microsoft said 15% of new servers deployed in 2026 include CXL-attached DRAM, cutting stranded capacity below 10% and saving USD 400 per node over five years. The CXL 3.1 spec enables fabric switching for up to 4,096 devices in a single coherent domain, turning DRAM into a networked resource. Samsung began sampling 128-GB CXL modules that deliver 64 GB/s of sustained bandwidth in March 2026. Early adoption is anchored in North America and Europe, but Alibaba’s pilot suggests Asia-Pacific uptake once switch costs fall below USD 500 by late 2027.
Restraints Impact Analysis*
| Restraint | (~) % Impact on CAGR Forecast | Geographic Relevance | Impact Timeline |
|---|---|---|---|
| Supply-demand cyclicality driving extreme ASP volatility | -2.1% | Global | Short term (≤ 2 years) |
| Yield-erosion challenges below 10 nm EUV nodes | -1.7% | South Korea and Taiwan concentration | Medium term (2–4 years) |
| Geopolitical export controls on China limiting high-density server DRAM shipments | -1.4% | Asia-Pacific, spill-over worldwide | Medium term (2–4 years) |
| Emerging chiplet-based architectures diluting per-die DRAM content | -0.9% | North America and Asia-Pacific | Long term (≥ 4 years) |
| Source: Mordor Intelligence | |||
Supply-Demand Cyclicality Driving Extreme ASP Volatility
Commodity DDR4 prices swung 78% during 2025, forcing PC OEMs to renegotiate contracts multiple times a year. A USD 120 billion cap-ex wave by the top three suppliers in 2024-2026 collided with smartphone stagnation, triggering a Q2 2025 supply glut and a 32% sequential drop in DDR4 prices. Inventory corrections now compress into 6-9 months because cloud buyers adjust orders algorithmically using real-time utilization telemetry. China’s gallium and germanium export restrictions in August 2025 further whiplashed specialty DRAM pricing by 50% over the next four weeks. Such volatility complicates long-term procurement and discourages smaller OEMs from multi-year sourcing agreements.
Yield-Erosion Challenges Below 10 nm EUV Nodes
EUV scanners costing EUR 200 million (USD 220 million) suffer from stochastic defects that cut yields by up to 8 percentage points compared with DUV processes, eroding gross margins. Samsung needed 18 months to push its 1-beta DDR5 ramp to 85% yield, compared to 1-alpha's 2x the learning curve. ASML shipped only 42 EUV tools in 2025 against 60 requested, delaying Micron’s 1-gamma schedule by two quarters.[2]ASML Holding, “Annual Report 2025,” Asml.com Multi-patterning at the cell level multiplies defect opportunities fourfold and forces another USD 300 million per fab in inline metrology investment. Warranty reserves for latent field failures have climbed to 3-4% of revenue, squeezing profitability at exactly the point where capital intensity is peaking.
*Our forecasts treat driver/restraint impacts as directional, not additive. The impact forecasts reflect baseline growth, mix effects, and variable interactions.
Segment Analysis
By Architecture: DDR5 Momentum Reshapes the Mix
DDR5 captured rapid share as server CPUs launched after Q2 2025 eliminated DDR4 compatibility, driving suppliers to prioritize high-margin modules. The dynamic random access memory market size linked to DDR5 shipments is projected to more than double by 2031 as module prices converge within 15% of DDR4, removing the cost barrier. Legacy DDR4 still served 45.73% of 2025 revenue thanks to mainstream PCs and embedded systems, but its footprint is shrinking each quarter. LPDDR variants contributed a healthy 28% on the back of flagship smartphones adopting 12-16 GB configurations for on-device inference. GDDR6 and emergent GDDR7 gained momentum in gaming GPUs such as NVIDIA’s GeForce RTX 5090, illustrating how bandwidth-hungry graphics keep a distinct upgrade cadence.
The transition accelerated when Microsoft required DDR5 for Windows 12 certification, prompting OEMs to discontinue DDR4 SKUs by late 2025. JEDEC’s adoption of LPDDR5T at 9.6 Gbps further widens the gap versus older standards, enabling 77 GB/s bandwidth inside smartphones. DDR3 and earlier generations now account for <8% and are trapped in long-lifecycle industrial or automotive niches. Overall, the dynamic random access memory market continues to shift toward power-efficient, higher-bandwidth architectures in every major device category, cementing DDR5 as the new baseline by the middle of the forecast window.


By Technology Node: Sub-10 Nanometer EUV Nodes Accelerate Density
Nodes below 10 nm advanced fastest at 14.95% CAGR as Samsung and SK Hynix migrated sizeable wafer volumes to 1-beta by end-2025. That shift lifted bits per wafer by 35% and improved power efficiency, directly expanding the dynamic random access memory market for leading-edge processes. The 19-nm-to-10-nm cohort still held 51.92% revenue share in 2025, balancing density against higher yields. Nodes ≥20 nm, once dominant for commodity DDR3/DDR4, are being repurposed for image sensors and PMICs as DRAM suppliers chase better returns elsewhere.
SK Hynix’s high-NA EUV tooling delivers 16-Gb die inside a 12-inch wafer, a two-generation density leap. Micron’s future 1-gamma node will add backside power rails, promising 10 Gbps signaling and lower leakage.[3]Micron Technology, “Investor Presentation Q1 2026,” Micron.com High capital thresholds of USD 15 billion per EUV line reinforce the oligopoly. Chinese newcomers remain marooned at 17 nm due to export bans, limiting their reach into premium segments that command 20-30% price premiums. Consequently, technology leadership remains the most potent moat in the dynamic random access memory market.
By Capacity: High-Density Modules Become the Norm
Modules of ≥16 GB are expanding at 14.89% as automotive controllers and AI smartphones drive minimum content higher. Apple’s elimination of the 8-GB tier in the MacBook Air M4 illustrates how mainstream devices now require larger footprints for local AI workloads. The 8-16 GB band still commanded 40.58% of 2025 revenue, but its share erodes each quarter as cost deltas compress. Capacities ≤4 GB are relegated to low-end IoT and disappearing rapidly as OS requirements climb.
Server demand for 64-GB and 128-GB RDIMMs keeps rising; Dell’s PowerEdge R760 supports up to 6 TB across 24 slots, reflecting the shift toward in-memory databases. Through-silicon-via stacking allows 256-GB DDR5 modules without enlarging PCB area, expanding the dynamic random access memory market share tied to ultra-dense form factors. With smartphone SOCs already integrating 24 GB, capacity growth remains a durable tailwind throughout the forecast.
By End-Use Application: Automotive Electronics Leads Upside
Automotive electronics is set to deliver the fastest 15.03% CAGR as software-defined vehicles treat DRAM as a shared compute resource. Volkswagen’s E3 2.0 architecture exemplifies the move toward centralized processing that demands 16-32 GB per car. Smartphones and tablets retained 37.71% revenue share in 2025, yet growth has plateaued; vendors therefore upsell larger memory bundles to defend margins. Servers and hyperscale data centers absorbed 32% of bit shipments thanks to AI inference clusters that install 512-768 GB per node.
Graphics consoles grew 18% year-over-year after Sony’s PlayStation 5 Pro doubled GDDR6 capacity to 32 GB. PCs and laptops transitioned en masse to DDR5, compressing the migration window to 18 months. Consumer electronics such as smart TVs now integrate LPDDR5 to meet the European Union’s 1-W idle mandate. Industrial and IoT devices, at 6% of revenue, remain important for diversification because they secure 40-50% gross margins on long-lifecycle contracts.
Geography Analysis
Asia-Pacific anchored 60.63% of 2025 revenue, owing to South Korea’s fabrication supremacy and China’s smartphone assembly base that together shape the bulk of the dynamic random access memory market. Samsung and SK Hynix own 82% of global sub-15 nm capacity, reinforcing regional dominance. Consumption in China grew 16% even under export restrictions, while India absorbed 18% of Asia-Pacific LPDDR5 shipments through its Production-Linked Incentive program.
North America’s 13.2% growth is propelled by USD 6.1 billion in CHIPS subsidies awarded to Micron, earmarked for 1-gamma production by 2027.[4]U.S. Department of Commerce, “Preliminary Terms with Micron for CHIPS Incentives,” Commerce.gov Hyperscale operators also redirect premium DDR5 to U.S. campuses because export rules cap Chinese clock speeds at 6,400 MT/s, lifting the dynamic random access memory market size captured in the region. Canada and Mexico remain small but benefit indirectly via data-center spill-over and automotive exports into the United States.
The Middle East records the highest 15.08% CAGR, with Saudi Arabia’s Public Investment Fund pledging USD 40 billion for AI data centers that together will need 50 exabytes of DRAM by 2028. Europe advances more modestly, awaiting concrete fab approvals under its EUR 43 billion chips initiative, leaving it 98% import-dependent. South America and Africa contribute only 4% of revenue because import tariffs inflate end-user prices on entry-level devices. Overall, regional demand clusters tightly around subsidy-backed fabrication hubs and hyperscale data-center construction, maintaining Asia-Pacific as the gravitational center of the dynamic random access memory market.
Mordor Intelligence provides coverage of the dynamic random access memory (dram) market across other key regional markets, including Asia and Europe, each with their regulatory frameworks and demand patterns. Detailed country-level analysis extends to China and Japan incorporating local coverage and market participation, as required.

Competitive Landscape
Market structure remains oligopolistic, Samsung Electronics, SK Hynix, and Micron Technology shipped a major share of 2025 bits, allowing coordinated supply discipline yet drawing European Commission scrutiny for parallel price hikes. Technology differentiation now emphasizes application-specific modules rather than raw density; SK Hynix’s GDDR7 with on-die ECC tailored for NVIDIA’s Blackwell GPUs typifies this shift. Samsung’s January 2026 showcase of CXL DRAM with integrated vector engines signals a push toward processing-in-memory, reducing data-movement energy by 60% in AI inference.
Chinese entrant ChangXin Memory Technologies clawed 8% domestic share in legacy DDR4 by undercutting incumbents, but a lack of EUV tools traps it at 17 nm, limiting export competitiveness. Micron’s forthcoming backside-powered 1-gamma node aims to leapfrog rivals on performance-per-watt and regain premium share once volume ships in 2027.
Responsible sourcing is also becoming increasingly important; hyperscalers demand compliance with the RBA Responsible Minerals Initiative, increasing audit costs for smaller players. Taken together, competitive dynamics hinge on capital access, node cadence, and specialized products that solve bottlenecks in AI and automotive compute chains, reinforcing high barriers to entry in the dynamic random access memory market.
Dynamic Random Access Memory (DRAM) Industry Leaders
Samsung Electronics Co., Ltd.
SK Hynix Inc.
Micron Technology Inc.
Nanya Technology Corporation
Winbond Electronics Corporation
- *Disclaimer: Major Players sorted in no particular order

Recent Industry Developments
- February 2026: Samsung Electronics began mass production of 16-Gb GDDR7 at its Pyeongtaek fab, enabling 32 Gbps data rates for next-generation GPUs.
- January 2026: Micron Technology secured a USD 6.1 billion CHIPS grant to expand Idaho and New York DRAM capacity targeting 1-gamma technology by Q4 2027.
- December 2025: SK Hynix announced a KRW 9.4 trillion (USD 7.2 billion) greenfield DRAM fab in Yongin, Korea, slated for 2028 startup on sub-10 nm EUV nodes.
- November 2025: Samsung unveiled a 256-GB DDR5 RDIMM using TSV stacking, doubling capacity for AI training servers.


Global Dynamic Random Access Memory (DRAM) Market Report Scope
The Dynamic Random Access Memory (DRAM) market is a critical component of the global semiconductor industry, driven by increasing demand across various end-use applications such as data centers, consumer electronics, and automotive systems. The market's growth is influenced by advancements in technology nodes, rising adoption of high-capacity memory modules, and the proliferation of connected devices worldwide.
The Dynamic Random Access Memory Market Report is Segmented by Architecture (DDR2 and Earlier, DDR3, DDR4, DDR5, LPDDR, GDDR), Technology Node (≥20 nm, 19 nm – 10 nm, <10 nm EUV), Capacity (≤4 GB, 4-8 GB, 8-16 GB, ≥16 GB), End-Use Application (Smartphones and Tablets, PCs and Laptops, Servers and Hyperscale Data Centers, Graphics and Gaming Consoles, Automotive Electronics, Consumer Electronics, Industrial and IoT Devices, Other), and Geography (North America, Europe, Asia-Pacific, South America, Middle East, Africa). The Market Forecasts are Provided in Terms of Value (USD).
| DDR2 and Earlier |
| DDR3 |
| DDR4 |
| DDR5 |
| LPDDR |
| GDDR |
| Greater Than or Equal to 20 nm |
| 19 nm - 10 nm |
| Greater Than 10 nm (EUV) |
| Less Than or Equal to 4 GB |
| 4 - 8 GB |
| 8 - 16 GB |
| Greater Than or Equal to 16 GB |
| Smartphones and Tablets |
| PCs and Laptops |
| Servers and Hyperscale Data Centers |
| Graphics and Gaming Consoles |
| Automotive Electronics |
| Consumer Electronics (Set-Top Boxes, Smart TV, VR/AR) |
| Industrial and IoT Devices |
| Other End-Use Applications |
| North America | United States |
| Canada | |
| Mexico | |
| Europe | Germany |
| France | |
| United Kingdom | |
| Spain | |
| Rest of Europe | |
| Asia-Pacific | China |
| South Korea | |
| Japan | |
| India | |
| Rest of Asia-Pacific | |
| South America | Brazil |
| Argentina | |
| Rest of South America | |
| Middle East | Saudi Arabia |
| United Arab Emirates | |
| Turkey | |
| Rest of Middle East | |
| Africa | South Africa |
| Rest of Africa |
| By Architecture | DDR2 and Earlier | |
| DDR3 | ||
| DDR4 | ||
| DDR5 | ||
| LPDDR | ||
| GDDR | ||
| By Technology Node | Greater Than or Equal to 20 nm | |
| 19 nm - 10 nm | ||
| Greater Than 10 nm (EUV) | ||
| By Capacity | Less Than or Equal to 4 GB | |
| 4 - 8 GB | ||
| 8 - 16 GB | ||
| Greater Than or Equal to 16 GB | ||
| By End-Use Application | Smartphones and Tablets | |
| PCs and Laptops | ||
| Servers and Hyperscale Data Centers | ||
| Graphics and Gaming Consoles | ||
| Automotive Electronics | ||
| Consumer Electronics (Set-Top Boxes, Smart TV, VR/AR) | ||
| Industrial and IoT Devices | ||
| Other End-Use Applications | ||
| By Geography | North America | United States |
| Canada | ||
| Mexico | ||
| Europe | Germany | |
| France | ||
| United Kingdom | ||
| Spain | ||
| Rest of Europe | ||
| Asia-Pacific | China | |
| South Korea | ||
| Japan | ||
| India | ||
| Rest of Asia-Pacific | ||
| South America | Brazil | |
| Argentina | ||
| Rest of South America | ||
| Middle East | Saudi Arabia | |
| United Arab Emirates | ||
| Turkey | ||
| Rest of Middle East | ||
| Africa | South Africa | |
| Rest of Africa | ||


Key Questions Answered in the Report
How large will global DRAM revenue become by 2031?
The dynamic random access memory market is forecast to reach USD 248.71 billion by 2031, reflecting a 14.86% CAGR over 2026-2031.
Which DRAM architecture is growing fastest?
DDR5 registers the highest growth, expanding at 14.91% annually as servers and PCs retire DDR4 platforms.
Why is automotive demand accelerating?
Software-defined vehicle platforms consolidate multiple ECUs into zonal controllers that each need 8-32 GB of high-temperature LPDDR5.
What is the main supply-side challenge below 10 nm?
Yield erosion from stochastic EUV lithography defects reduces output and raises capital intensity for sub-10 nm nodes.
How will CXL affect future DRAM consumption?
CXL-attached memory pools cut stranded capacity and enable larger aggregate deployments, thereby sustaining long-term bit demand.
Page last updated on:


