Market Overview
| Study Period | 2021 - 2031 |
|---|---|
| Forecast Data Period | 2026 - 2031 |
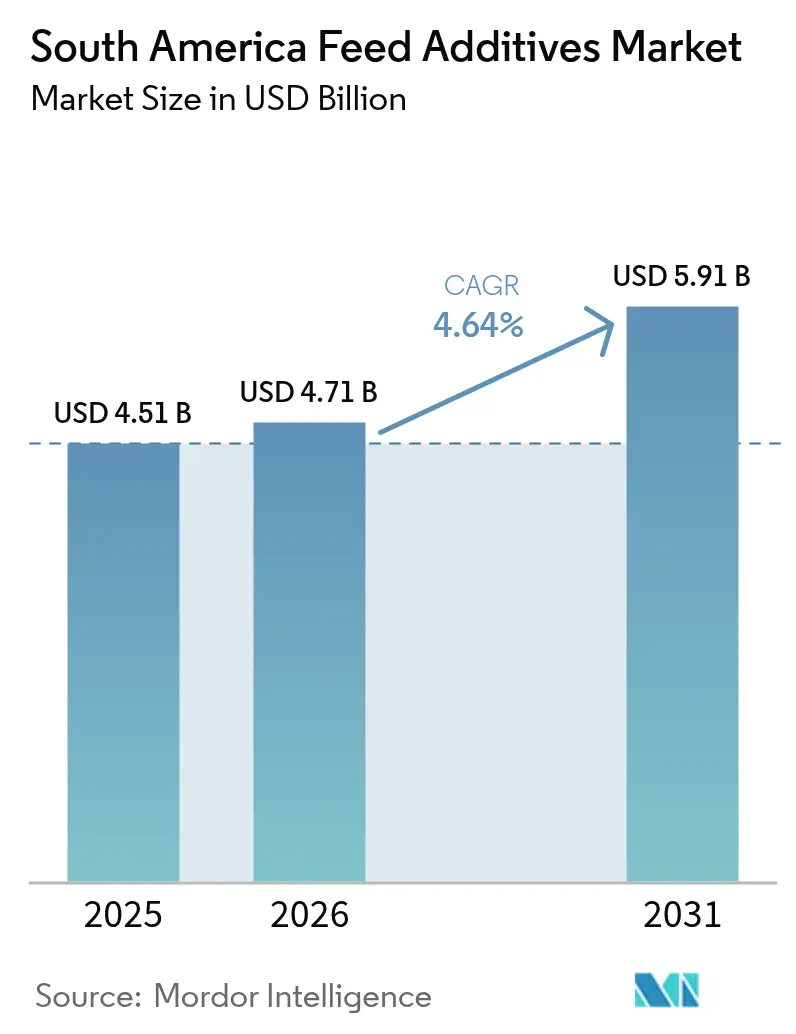
| Base Year Market Size (2025) | USD 4.51 Billion |
| Market Size (2026) | USD 4.71 Billion |
| Market Size (2031) | USD 5.91 Billion |
| Growth Rate (2026 - 2031) | 4.64% CAGR |
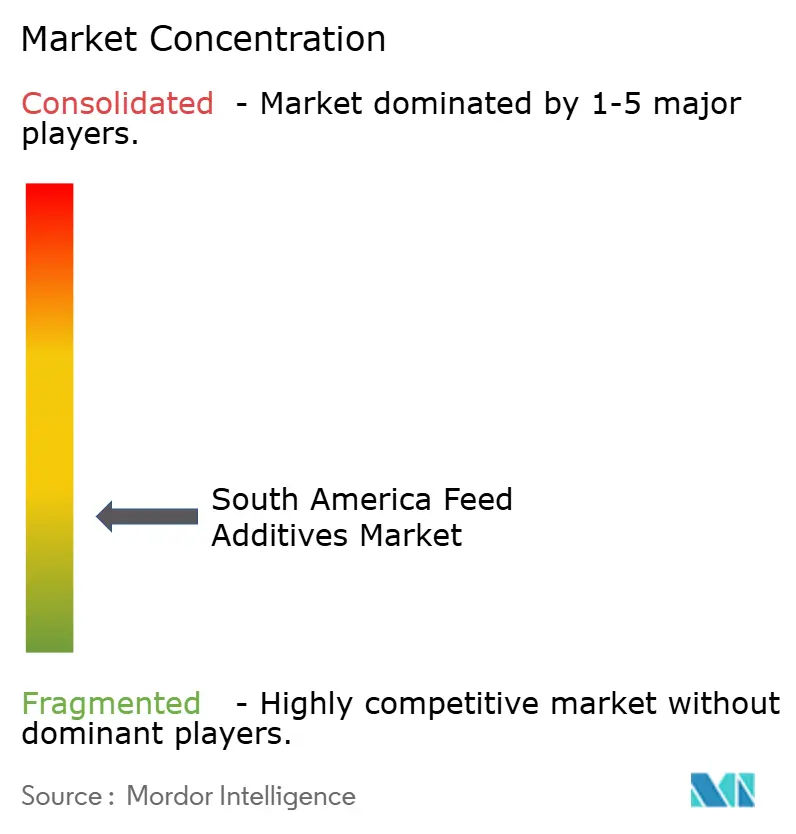
| Market Concentration | Low |
Major Players *Disclaimer: Major Players sorted in no particular order Image © Mordor Intelligence. Reuse requires attribution under CC BY 4.0. | |
South America Feed Additives Market Analysis by Mordor Intelligence
The South America Feed Additives Market size is estimated to grow from USD 4.51 billion in 2025 to USD 4.71 billion in 2026 and is forecast to reach USD 5.91 billion by 2031 at 4.64% CAGR over 2026-2031. Robust poultry and swine expansion in Brazil, a swift pivot toward precision-feeding technologies, and Chile’s salmon color-score mandates are reinforcing demand for targeted enzymes, amino acids, and pigments. Currency weakness in Argentina is forcing smaller mills to trade down to lower-potency premixes, while Brazil’s RenovaBio carbon-credit scheme is embedding crystalline amino acids in mainstream broiler and hog rations. Meanwhile, Chilean Quillaja saponin extraction has reduced phytogenic costs by 18–22%, intensifying price competition against imported essential-oil blends. Together, these factors sustain a moderate-growth trajectory even as feed-mill fragmentation and regulatory delays temper upside potential.
Key Report Takeaways
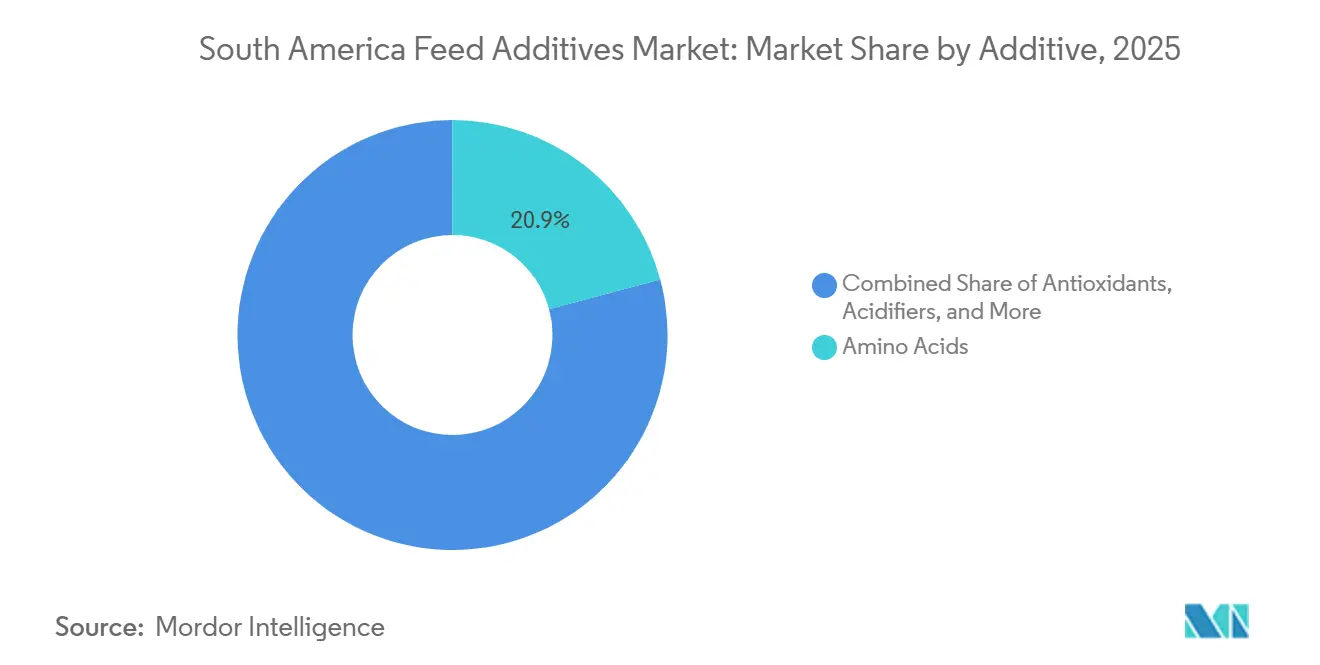
- By additive type, amino acids commanded 20.85% of the South America feed additives market share in 2025, whereas antioxidants are forecast to post the fastest CAGR of 5.28% through 2031.
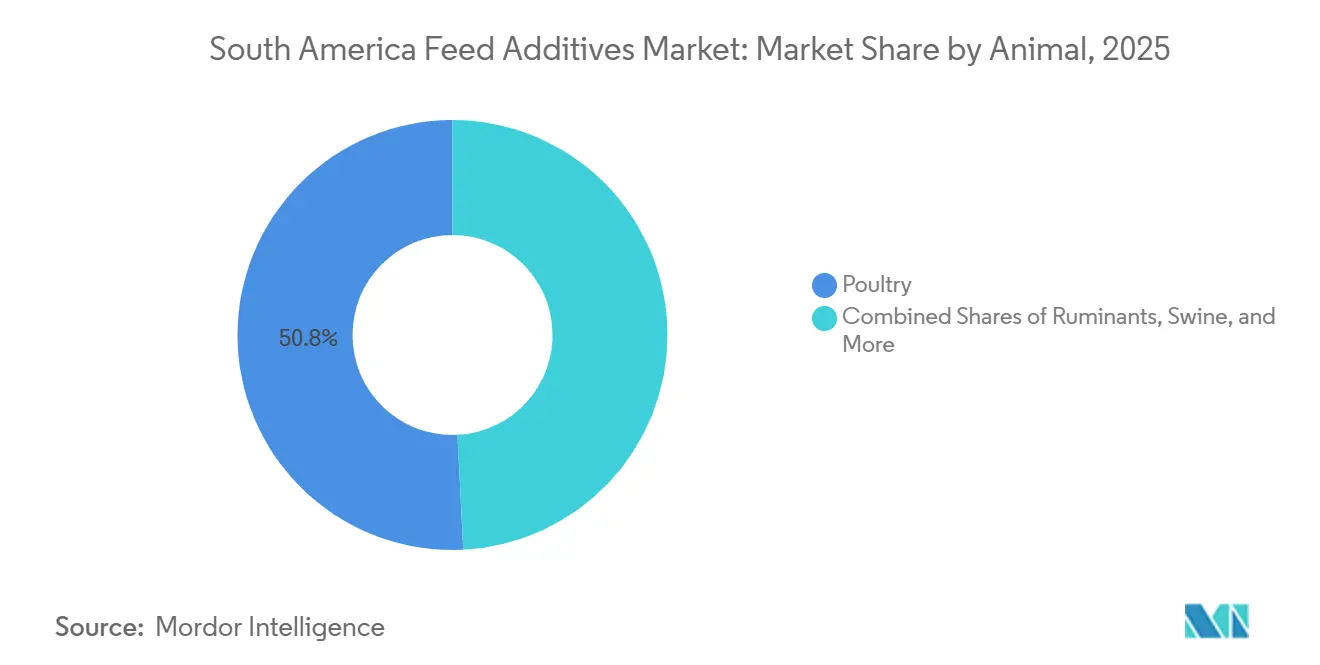
- By animal category, poultry accounted for 50.80% of the South America feed additives market size in 2025, while aquaculture is projected to expand at a 5.99% CAGR through 2031.
- By geography, Brazil captured 56.06% of the South America feed additives market sales in 2025, whereas Chile is set to grow at a 5.28% CAGR through 2031.
Note: Market size and forecast figures in this report are generated using Mordor Intelligence’s proprietary estimation framework, updated with the latest available data and insights as of 2026.
South America Feed Additives Market Trends and Insights
Drivers Impact Analysis*
| Driver | (~) % Impact on CAGR Forecast | Geographic Relevance | Impact Timeline |
|---|---|---|---|
| Growth in industrial poultry and swine production | +1.20% | Brazil (primary), Argentina, and Chile | Medium term (2–4 years) |
| Rising cost focus on feed-conversion efficiency | +1.00% | Brazil, Argentina, with spillover to Paraguay and Uruguay | Short term (≤ 2 years) |
| Aquaculture expansion boosts specialty additives demand | +0.90% | Chile (salmon), Ecuador (shrimp), and Brazil (tilapia) | Long term (≥ 4 years) |
| AI-enabled precision feeding deployment | +0.60% | Brazil (early adopters) and Argentina (pilot phase) | Medium term (2–4 years) |
| Local Quillaja saponin sourcing lowers phytogenic cost | +0.40% | Chile (production hub), regional distribution to Brazil and Argentina | Short term (≤ 2 years) |
| Brazil RenovaBio mandate favors amino-acid inclusion | +0.50% | Brazil (national policy), limited cross-border effect | Medium term (2–4 years) |
| Source: Mordor Intelligence | |||


Growth in Industrial Poultry and Swine Production
Brazil exported 5.32 million metric tons of chicken meat during January to December 2025, with an additional 459.5 thousand metric tons shipped in January 2026 alone. Domestic per capita consumption reached 45.5 kg in 2025, highlighting strong domestic demand alongside sustained export momentum [1]Source: Brazilian Animal Protein Association, “Annual Report 2025,” abpa-br.org. Expansion centers on Paraná, Santa Catarina, and Rio Grande do Sul, where integrators are erecting 1,200 to 1,500 bird houses that use acidifiers and multi-enzyme blends to maintain gut health under dense stocking. Argentina’s pork industry rebounded in 2025 as consumers substituted pork for high-priced beef. Larger, vertically integrated systems are increasingly negotiating bulk discounts on methionine and lysine, reinforcing the link between scale and feed additive penetration. The structural shift toward larger, grain-intensive production systems is steadily adding volume to the South America feed additive market while encouraging suppliers to co-locate premix hubs near high-density livestock corridors.
Rising Cost Focus on Feed-Conversion Efficiency
Corn prices remained elevated in 2025, averaging above their recent multi-year levels, while soybean meal prices also hovered at relatively high levels. This sustained cost pressure has continued to squeeze feed formulators’ margins, reinforcing the need for efficiency-enhancing additives and cost-optimization strategies within feed formulations[2] Source: CEPEA-ESALQ, “Corn and Soybean Meal Prices 2025,” cepea.esalq.usp.br. Brazilian integrators lifted synthetic lysine inclusion from 0.28% to 0.32% of diet weight, trimming crude protein points without hurting daily gain. Argentina feed costs soared significantly over the same span, prompting trials with encapsulated butyric acid that improves villus height and nutrient uptake. Higher raw-material prices cut enzyme payback time to 9 to 11 months, down from 14 to 16 months in 2022, spurring uptake of broad-spectrum blends that unlock energy, protein, and phosphorus simultaneously. Formulators are sharpening matrix values to monetize every incremental gain in feed-conversion ratio, thereby funneling incremental revenue into the South America feed additive market.
Aquaculture Expansion Boosts Specialty Additives Demand
Chile’s Atlantic salmon harvest climbed significantly in 2025, while Ecuador’s frozen shrimp exports reached 1.19 million metric tons[3]Source: International Trade Centre, Trade Map: Country and Product Time Series for HS Code 030617, https://www.trademap.org. Retailers now require SalmoFan 26 flesh scores, driving pigment inclusion to 60–80 milligrams per kilogram of feed. Shrimp ponds in Guayas province layer beta-glucans and mannan-oligosaccharides to mitigate early-mortality syndrome losses recorded in recent years. Brazilian tilapia farms are piloting phytase programs that reduce reliance on dicalcium phosphate, lowering overall ration costs. Species-specific nutritional requirements continue to fragment the additive portfolio, creating niche opportunities for high-stability pigments, thermo-tolerant enzymes, and immune modulators. Sustained growth in aquaculture harvest volumes, therefore, continues to channel specialty demand into the South America feed additive market.
AI-Enabled Precision Feeding Deployment
Twelve Brazilian broiler integrators, representing a notable share of national capacity, trialed near-infrared sensor networks in 2025 that recalibrate amino-acid dosing at regular intervals. Argentina's adoption is slower, with only a limited number of swine farms having installed such systems by year-end, owing to high hardware costs and inconsistent rural broadband coverage. Nonetheless, as rural connectivity infrastructure continues to expand, digital barriers are gradually easing. Precision platforms tend to lock in additive suppliers whose amino-acid and enzyme libraries are embedded within proprietary algorithms, creating a technology-driven competitive advantage by raising switching costs in the South America feed additive market.
Restraints Impact Analysis*
| Restraint | (~) % Impact on CAGR Forecast | Geographic Relevance | Impact Timeline |
|---|---|---|---|
| Currency volatility inflates imported additive prices | -0.80% | Argentina (acute), Brazil (moderate), and Chile (limited) | Short term (≤ 2 years) |
| Fragmented feed-mill base deters value-added adoption | -0.50% | Argentina, Paraguay, Uruguay, and Brazil | Long term (≥ 4 years) |
| Slow approval cycle for novel microbial strains | -0.30% | Regional (Ministry of Agriculture and Livestock (MAPA) and Food Safety and Quality Service), with Argentina experiencing the longest delays | Medium term (2–4 years) |
| Algae-derived antioxidant oversupply pressures prices | -0.20% | Chile (production hub), Ecuador (secondary), and Brazil (import-dependent) | Short term (≤ 2 years) |
| Source: Mordor Intelligence | |||
Currency Volatility Inflates Imported Additive Prices
The Argentine peso slid sharply against the United States dollar between January 2024 and December 2025, resulting in a severe currency collapse that effectively doubled local-currency costs for vitamins, choline chloride, and methionine. Mills stretched payment terms and downgraded vitamin premixes, heightening the risk of subclinical deficiencies. Brazilian Real also depreciated during the same period, increasing the landed cost of imported European enzymes. Export-oriented giants such as JBS hedged a significant share of their inputs, but smaller mills without access to derivatives absorbed the full impact of currency shocks. Chile’s peso remained relatively stable compared to its regional peers due to copper revenues, yet salmon growers still faced higher costs for imported astaxanthin. Currency volatility is pushing buyers toward locally produced lysine and threonine capacity. However, vitamins and trace minerals remain largely import-dependent, leaving the South America feed additive market exposed to ongoing exchange rate fluctuations.
Fragmented Feed-Mill Base Deters Value-Added Adoption
South America mills processing under 50,000 metric tons annually face weakened bargaining power with additive suppliers[4]IERAL Foundation, “Argentina Feed Industry 2025,” ieral.org. Small Argentine and Paraguayan plants encounter higher premix markups, while large Brazilian integrators purchasing straight vitamins achieve significant cost efficiencies. Liquid-methionine dosing lines require substantial capital investment and are economically viable primarily at higher production scales. As a result, smaller mills often rely on salt, limestone, and basic vitamin packs, frequently bypassing enzymes, probiotics, and protected acids that depend on precision dosing systems. Brazil’s leading mills continue to gradually expand their national share, while Argentina’s family-owned operations show slower consolidation trends. Until scale efficiencies improve, premium additive penetration is estimated to remain constrained, limiting upside potential for the South America feed additive market.
*Our forecasts treat driver/restraint impacts as directional, not additive. The impact forecasts reflect baseline growth, mix effects, and variable interactions.
Segment Analysis
By Additive: Amino Acids Dominate, Antioxidants Accelerate
Amino acids accounted for 20.85% of the South America feed additives market share in 2025, driven by integrators focusing on lysine and methionine balancing in corn-soy rations. Local crushing plants and fermentation facilities offer cost advantages for both multinational and domestic producers. Stable supply chains reduce currency risks and enhance confidence among poultry and swine operators in utilizing amino acids to lower crude-protein levels while maintaining growth performance. Demand is particularly high in Brazil's poultry regions and Argentina's swine production areas, where operations efficiently source high-purity powder and liquid methionine. The growing adoption of layer diets, especially low-protein formulations, further supports amino acid usage.
Antioxidants are estimated to grow at a 5.28% CAGR from 2026 to 2031, driven by rising demand from intensive aquaculture systems. Chilean salmon processors favor combinations of natural tocopherols and polyphenolic extracts to preserve filet color and extend shelf life. Brazilian shrimp producers are increasingly using microalgae-derived antioxidants, which provide omega-3 enrichment and stress reduction benefits. These additives improve immune function and reduce reliance on synthetic preservatives across cage, pond, and recirculating systems.


By Animal: Poultry Leads, Aquaculture Surges
Poultry accounted for 50.80% of the South America feed additives market size in 2025, driven by Brazil's significant broiler production and export activities. The rapid production cycles in broiler farming sustain consistent demand for enzymes, probiotics, and organic acids to improve feed conversion and carcass yield. Layer operations are increasingly utilizing specialized vitamin-mineral combinations to support extended laying cycles, while turkey and duck production contribute to the demand for specialty additives such as betaine and pigments.
Aquaculture is anticipated to grow at a CAGR of 5.99% through 2031, making it the fastest-growing animal segment. Chile's salmon industry drives demand for functional proteins, prebiotics, and color enhancers. Additionally, tilapia farms in Brazil and shrimp hatcheries in Ecuador are expanding, while the adoption of biofloc technology is creating new requirements for water-stabilizing binders and immune modulators.
Geography Analysis
Brazil held 56.1% of regional revenue in 2025, driven by strong broiler meat and pork production, which together account for a substantial share of national additive consumption. Argentina follows with a notable share, Chile contributes a meaningful portion, and the Rest of South America cluster, Paraguay, Uruguay, Colombia, and Ecuador, accounts for the remaining balance. The South America feed additive market size is therefore concentrated in Brazil’s southern production belt, where same-day delivery of liquid methionine and enzyme concentrates has become standard practice.
Chile is forecast to post a 5.28% CAGR through 2031, the fastest geography, as salmon volumes continue to climb and pigment inclusion rises toward higher SalmoFan color targets. Ecuador, bolstered by a resilient shrimp pipeline, follows with solid growth momentum, while Brazil maintains steady expansion in line with the overall South America feed additive market growth. Argentina trails, constrained by currency volatility and fragmented feed-mill structures, and Paraguay and Uruguay record moderate growth.
Colombia is experiencing steady growth as major poultry integrators implement advanced premixes, which enhance feed efficiency and overall poultry health. Additionally, the expansion of fisheries along the Pacific Rim, driven by increasing demand for aquaculture products, and the adoption of precision feeding techniques in Brazil, aimed at optimizing livestock nutrition and reducing waste, are projected to significantly influence the geographic composition of the South America feed additive market over the next five years.
Competitive Landscape
The South America feed additive market is moderately fragmented, with the five market leaders, such as DSM-Firmenich, Cargill, Incorporated, BASF SE, Brenntag SE, and China National BlueStar Co. Ltd. (Adisseo), accounting for a significant share of total revenue. DSM-Firmenich secures a substantial portion of Brazilian vitamin A and E demand through multiyear take-or-pay contracts and expands its Ronozyme enzyme portfolio through local premix partnerships. Cargill, Incorporated. operates Brazilian facilities that supply customized vitamin-mineral packs with rapid delivery to mid-sized mills, strengthening its presence in the premix channel. BASF reinforced its regional position following a major retrofit at its Guaratinguetá facility that increased phytase output, while Brenntag SE continues to scale regional distribution of acidifiers and trace minerals using a hub-and-spoke logistics network centered around São Paulo and Buenos Aires.
Local specialists are narrowing cost gaps. Chilean Quillaja suppliers undercut imported essential oil blends, opening pockets of share in antibiotic-free broilers in Brazil and Argentina. CJ CheilJedang Corp. (CJ Corporation) expanded Brazilian lysine capacity, challenging DSM-Firmenich and China National BlueStar Co. Ltd. (Adisseo) on entry-level amino acids. BioMar’s launch of a Bacillus probiotic for shrimp demonstrates how species-specific R&D can command premium margins even in a cost-focused environment. Yet lengthy Ministry of Agriculture and Livestock in Brazil and National Food Safety and Quality Service in Argentina approval windows blunt first-mover advantages, allowing Asian firms that clear Thai or Vietnamese reviews sooner to enter South America with validated dossiers.
Twelve poultry integrators feed real-time amino-acid models that sit inside proprietary cloud platforms, creating switching costs for enzyme suppliers embedded in those algorithms. Salmon and shrimp farms are next, several are piloting pigment-stability dashboards that adjust antioxidant dosing to match storage humidity, a service layer that favors incumbents with strong technical field teams. As digitization spreads, differentiation will rely more on data science plus ingredients than on ingredients alone, tightening competitive dynamics in the South America feed additive market.
South America Feed Additives Industry Leaders
China National BlueStar Co. Ltd. (Adisseo)
DSM-Firmenich
Brenntag SE
Cargill, Incorporated.
BASF SE
- *Disclaimer: Major Players sorted in no particular order

Recent Industry Developments
- September 2025: ADM has launched Nutripiscis Oxygen, a new nutritional solution aimed at improving tilapia productivity and mitigating stress in challenging environments. The product features a unique blend of additives designed to offer nutritional support to Brazilian farmers facing farming challenges such as environmental stress, temperature variations, and low dissolved oxygen levels in water.
- July 2025: Cargill, Incorporated has submitted a binding offer to acquire 100% of Mig-Plus, aiming to strengthen its presence and capabilities in Brazil's animal nutrition market. This acquisition will enable Cargill to establish closer connections with producers. The agreement between the parties has been formalized, with the transaction pending regulatory approval from the Administrative Council for Economic Defense (CADE).
- February 2025: Cargill Incorporated partnered with BinSentry to implement AI-powered solutions for feed ingredient and enzyme supply chain optimization in Brazil. The agreement established Cargill as the exclusive distributor of BinSentry's inventory management platform in Brazil, improving operational efficiency for pork and poultry producers.


South America Feed Additives Market Report Scope
Feed additives are specialized nutritional or functional compounds added to animal feed to enhance growth, health, and efficiency, while reducing waste and meeting regulatory or consumer requirements.
The South America feed additives market report is segmented by additive (acidifiers, amino acids, antibiotics, binders, enzymes, and others), by animal (aquaculture, poultry, ruminants, and others), and by geography (Argentina, Brazil, Chile, and others). The market forecasts are provided in terms of value (USD) and volume (metric tons).
By Additive
| Acidifiers | Fumaric Acid |
| Lactic Acid | |
| Propionic Acid | |
| Other Acidifiers | |
| Amino Acids | Lysine |
| Methionine | |
| Threonine | |
| Tryptophan | |
| Other Amino Acids | |
| Antibiotics | Bacitracin |
| Penicillins | |
| Tetracyclines | |
| Tylosin | |
| Other Antibiotics | |
| Antioxidants | Butylated Hydroxyanisole (BHA) |
| Butylated Hydroxytoluene (BHT) | |
| Citric Acid | |
| Ethoxyquin | |
| Propyl Gallate | |
| Tocopherols | |
| Other Antioxidants | |
| Binders | Natural Binders |
| Synthetic Binders | |
| Enzymes | Carbohydrases |
| Phytases | |
| Other Enzymes | |
| Flavors & Sweeteners | Flavors |
| Sweeteners | |
| Minerals | Macrominerals |
| Microminerals | |
| Mycotoxin Detoxifiers | Binders |
| Biotransformers | |
| Phytogenics | Essential Oil |
| Herbs & Spices | |
| Other Phytogenics | |
| Pigments | Carotenoids |
| Curcumin & Spirulina | |
| Prebiotics | Fructo Oligosaccharides |
| Galacto Oligosaccharides | |
| Inulin | |
| Lactulose | |
| Mannan Oligosaccharides | |
| Xylo Oligosaccharides | |
| Other Prebiotics | |
| Probiotics | Bifidobacteria |
| Enterococcus | |
| Lactobacilli | |
| Pediococcus | |
| Streptococcus | |
| Other Probiotics | |
| Vitamins | Vitamin A |
| Vitamin B | |
| Vitamin C | |
| Vitamin E | |
| Other Vitamins | |
| Yeast | Live Yeast |
| Selenium Yeast | |
| Spent Yeast | |
| Torula Dried Yeast | |
| Whey Yeast | |
| Yeast Derivatives |
By Animal
| Aquaculture | Fish |
| Shrimp | |
| Other Aquaculture Species | |
| Poultry | Broiler |
| Layer | |
| Other Poultry Birds | |
| Ruminants | Beef Cattle |
| Dairy Cattle | |
| Other Ruminants | |
| Swine | |
| Other Animals |
By Geography
| Argentina |
| Brazil |
| Chile |
| Rest of South America |
| By Additive | Acidifiers | Fumaric Acid |
| Lactic Acid | ||
| Propionic Acid | ||
| Other Acidifiers | ||
| Amino Acids | Lysine | |
| Methionine | ||
| Threonine | ||
| Tryptophan | ||
| Other Amino Acids | ||
| Antibiotics | Bacitracin | |
| Penicillins | ||
| Tetracyclines | ||
| Tylosin | ||
| Other Antibiotics | ||
| Antioxidants | Butylated Hydroxyanisole (BHA) | |
| Butylated Hydroxytoluene (BHT) | ||
| Citric Acid | ||
| Ethoxyquin | ||
| Propyl Gallate | ||
| Tocopherols | ||
| Other Antioxidants | ||
| Binders | Natural Binders | |
| Synthetic Binders | ||
| Enzymes | Carbohydrases | |
| Phytases | ||
| Other Enzymes | ||
| Flavors & Sweeteners | Flavors | |
| Sweeteners | ||
| Minerals | Macrominerals | |
| Microminerals | ||
| Mycotoxin Detoxifiers | Binders | |
| Biotransformers | ||
| Phytogenics | Essential Oil | |
| Herbs & Spices | ||
| Other Phytogenics | ||
| Pigments | Carotenoids | |
| Curcumin & Spirulina | ||
| Prebiotics | Fructo Oligosaccharides | |
| Galacto Oligosaccharides | ||
| Inulin | ||
| Lactulose | ||
| Mannan Oligosaccharides | ||
| Xylo Oligosaccharides | ||
| Other Prebiotics | ||
| Probiotics | Bifidobacteria | |
| Enterococcus | ||
| Lactobacilli | ||
| Pediococcus | ||
| Streptococcus | ||
| Other Probiotics | ||
| Vitamins | Vitamin A | |
| Vitamin B | ||
| Vitamin C | ||
| Vitamin E | ||
| Other Vitamins | ||
| Yeast | Live Yeast | |
| Selenium Yeast | ||
| Spent Yeast | ||
| Torula Dried Yeast | ||
| Whey Yeast | ||
| Yeast Derivatives | ||
| By Animal | Aquaculture | Fish |
| Shrimp | ||
| Other Aquaculture Species | ||
| Poultry | Broiler | |
| Layer | ||
| Other Poultry Birds | ||
| Ruminants | Beef Cattle | |
| Dairy Cattle | ||
| Other Ruminants | ||
| Swine | ||
| Other Animals | ||
| By Geography | Argentina | |
| Brazil | ||
| Chile | ||
| Rest of South America | ||


Market Definition
- FUNCTIONS - For the study, feed additives are considered to be commercially manufactured products that are used to enhance characteristics such as weight gain, feed conversion ratio, and feed intake when fed in appropriate proportions.
- RESELLERS - Companies engaged in reselling feed additives without value addition have been excluded from the market scope, to avoid double counting.
- END CONSUMERS - Compound feed manufacturers are considered to be end-consumers in the market studied. The scope excludes farmers buying feed additives to be used directly as supplements or premixes.
- INTERNAL COMPANY CONSUMPTION - Companies engaged in the production of compound feed as well as the manufacturing of feed additives are part of the study. However, while estimating the market sizes, the internal consumption of feed additives by such companies has been excluded.
| Keyword | Definition |
|---|---|
| Feed additives | Feed additives are products used in animal nutrition for purposes of improving the quality of feed and the quality of food from animal origin, or to improve the animals’ performance and health. |
| Probiotics | Probiotics are microorganisms introduced into the body for their beneficial qualities. (It maintains or restores beneficial bacteria to the gut). |
| Antibiotics | Antibiotic is a drug that is specifically used to inhibit the growth of bacteria. |
| Prebiotics | A non-digestible food ingredient that promotes the growth of beneficial microorganisms in the intestines. |
| Antioxidants | Antioxidants are compounds that inhibit oxidation, a chemical reaction that produces free radicals. |
| Phytogenics | Phytogenics are a group of natural and non-antibiotic growth promoters derived from herbs, spices, essential oils, and oleoresins. |
| Vitamins | Vitamins are organic compounds, which are required for normal growth and maintenance of the body. |
| Metabolism | A chemical process that occurs within a living organism in order to maintain life. |
| Amino acids | Amino acids are the building blocks of proteins and play an important role in metabolic pathways. |
| Enzymes | Enzyme is a substance that acts as a catalyst to bring about a specific biochemical reaction. |
| Anti-microbial resistance | The ability of a microorganism to resist the effects of an antimicrobial agent. |
| Anti-microbial | Destroying or inhibiting the growth of microorganisms. |
| Osmotic balance | It is a process of maintaining salt and water balance across membranes within the body's fluids. |
| Bacteriocin | Bacteriocins are the toxins produced by bacteria to inhibit the growth of similar or closely related bacterial strains. |
| Biohydrogenation | It is a process that occurs in the rumen of an animal in which bacteria convert unsaturated fatty acids (USFA) to saturated fatty acids (SFA). |
| Oxidative rancidity | It is a reaction of fatty acids with oxygen, which generally causes unpleasant odors in animals. To prevent these, antioxidants were added. |
| Mycotoxicosis | Any condition or disease caused by fungal toxins, mainly due to contamination of animal feed with mycotoxins. |
| Mycotoxins | Mycotoxins are toxin compounds that are naturally produced by certain types of molds (fungi). |
| Feed Probiotics | Microbial feed supplements positively affect gastrointestinal microbial balance. |
| Probiotic yeast | Feed yeast (single-cell fungi) and other fungi used as probiotics. |
| Feed enzymes | They are used to supplement digestive enzymes in an animal’s stomach to break down food. Enzymes also ensure that meat and egg production is improved. |
| Mycotoxin detoxifiers | They are used to prevent fungal growth and to stop any harmful mold from being absorbed in the gut and blood. |
| Feed antibiotics | They are used both for the prevention and treatment of diseases but also for rapid growth and development. |
| Feed antioxidants | They are used to protect the deterioration of other feed nutrients in the feed such as fats, vitamins, pigments, and flavoring agents, thus providing nutrient security to the animals. |
| Feed phytogenics | Phytogenics are natural substances, added to livestock feed to promote growth, aid in digestion, and act as anti-microbial agents. |
| Feed vitamins | They are used to maintain the normal physiological function and normal growth and development of animals. |
| Feed flavors and sweetners | These flavors and sweeteners help to mask tastes and odors during changes in additives or medications and make them ideal for animal diets undergoing transition. |
| Feed acidifiers | Animal feed acidifiers are organic acids incorporated into the feed for nutritional or preservative purposes. Acidifiers enhance congestion and microbiological balance in the alimentary and digestive tracts of livestock. |
| Feed minerals | Feed minerals play an important role in the regular dietary requirements of animal feed. |
| Feed binders | Feed binders are the binding agents used in the manufacture of safe animal feed products. It enhances the taste of food and prolongs the storage period of the feed. |
| Key Terms | Abbreviation |
| LSDV | Lumpy Skin Disease Virus |
| ASF | African Swine Fever |
| GPA | Growth Promoter Antibiotics |
| NSP | Non-Starch Polysaccharides |
| PUFA | Polyunsaturated Fatty Acid |
| Afs | Aflatoxins |
| AGP | Antibiotic Growth Promoters |
| FAO | The Food And Agriculture Organization of the United Nations |
| USDA | The United States Department of Agriculture |


Research Methodology
Mordor Intelligence follows a four-step methodology in all our reports.
- Step-1: IDENTIFY KEY VARIABLES: In order to build a robust forecasting methodology, the variables and factors identified in Step-1 are tested against available historical market numbers. Through an iterative process, the variables required for market forecast are set and the model is built on the basis of these variables.
- Step-2: Build a Market Model: Market-size estimations for the forecast years are in nominal terms. Inflation is not a part of the pricing, and the average selling price (ASP) is kept constant throughout the forecast period.
- Step-3: Validate and Finalize: In this important step, all market numbers, variables and analyst calls are validated through an extensive network of primary research experts from the market studied. The respondents are selected across levels and functions to generate a holistic picture of the market studied.
- Step-4: Research Outputs: Syndicated Reports, Custom Consulting Assignments, Databases & Subscription Platforms


