
Facial Injectables Market Size and Share
Market Overview
| Study Period | 2020 - 2031 |
|---|---|
| Market Size (2026) | USD 15.55 Billion |
| Market Size (2031) | USD 23.86 Billion |
| Growth Rate (2026 - 2031) | 8.91 % |
| Fastest Growing Market | Asia Pacific |
| Largest Market | North America |
| Market Concentration | Medium |
Major Players *Disclaimer: Major Players sorted in no particular order Image © Mordor Intelligence. Reuse requires attribution under CC BY 4.0. | |
Facial Injectables Market Analysis by Mordor Intelligence
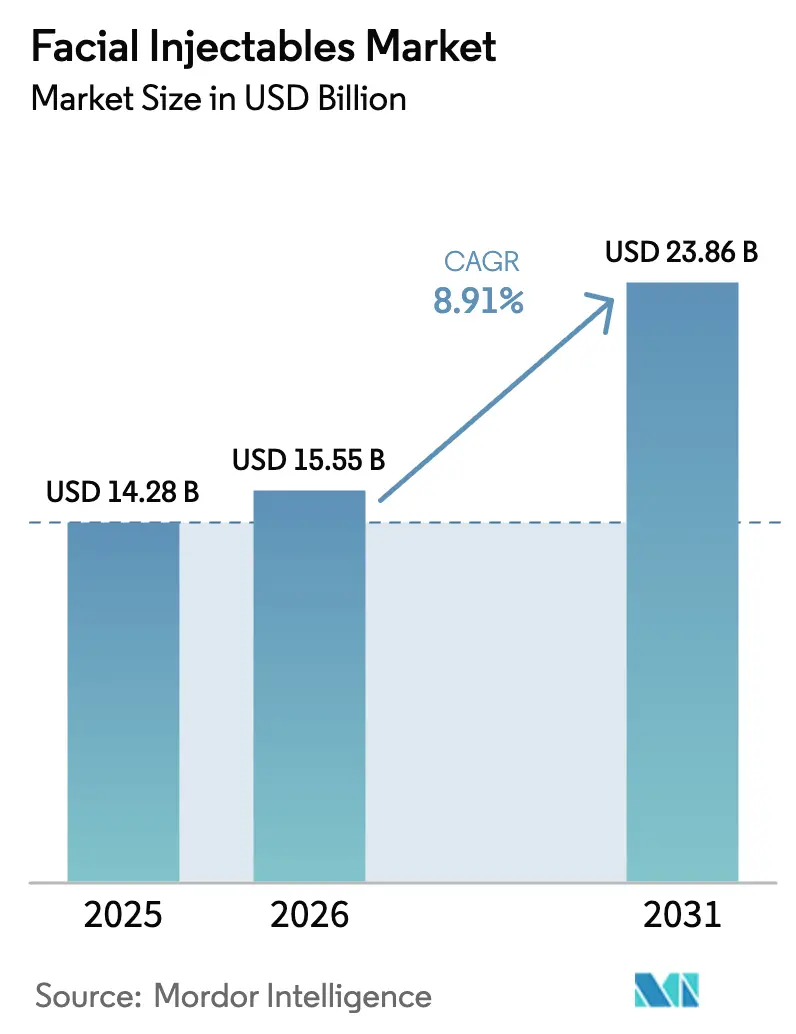
The Facial Injectables Market size is projected to expand from USD 14.28 billion in 2025 and USD 15.55 billion in 2026 to USD 23.86 billion by 2031, registering a CAGR of 8.91% between 2026 to 2031.
Demand growth mirrors a global shift toward minimally invasive aesthetic solutions that promise consistent results and minimal downtime, a preference strengthened by AI-guided facial-mapping tools that reduce operator variability and improve patient satisfaction [1]U.S. Food and Drug Administration, “Warning Letters and Enforcement Actions,” fda.gov. Male patients form the fastest-growing consumer bracket, expanding at an 11.9% CAGR, as social-media-filtered norms normalize injectables among professionals under 45 in finance and technology. Regulatory scrutiny is simultaneously tightening: the U.S. Food and Drug Administration sent multiple warning letters to unlicensed “party-tox” providers in 2024, highlighting how compliance costs and enforcement actions now shape go-to-market strategies.
Key Report Takeaways
- By product type, Botulinum Toxin held 56.8% of the facial injectable market share in 2025. Poly-L-Lactic Acid captured the fastest growth with a 14.6% CAGR through 2031.
- By gender, the female segment held 83.1% of the facial injectables market share in 2025. The male segment is advancing at 11.9% CAGR to 2031.
- By application, wrinkle reduction and anti-aging led with 34.6% revenue share in 2025. Scar and acne-scar treatment is advancing at a 13.9% CAGR to 2031.
- By end-user, hospitals and dermatology clinics controlled 51.0% of the facial injectable market size in 2025. Medical spas and aesthetic centers are expanding at an 11.8% CAGR through 2031.
- North America retained 39.3% of global revenue in 2025, while Asia-Pacific posts the highest projected 10.5% CAGR to 2031.
Note: Market size and forecast figures in this report are generated using Mordor Intelligence’s proprietary estimation framework, updated with the latest available data and insights as of January 2026.
Global Facial Injectables Market Trends and Insights
Drivers Impact Analysis*
| Driver | (~) % Impact on CAGR Forecast | Geographic Relevance | Impact Timeline |
|---|---|---|---|
| Growing preference towards minimally invasive aesthetic procedures | +2.1% | North America, Asia-Pacific urban centers | Medium term (2-4 years) |
| Rapid launch of long-acting, hybrid HA fillers | +1.8% | North America, Europe, South Korea, Japan | Short term (≤ 2 years) |
| Male patient adoption driven by social-media-filtered appearance norms | +1.5% | North America, Western Europe, urban Asia-Pacific | Medium term (2-4 years) |
| Asia-based medical tourism packages bundled with injectables | +1.3% | Asia-Pacific core (Thailand, South Korea), spillover to Middle East and Australia | Long term (≥ 4 years) |
| AI-powered facial-mapping injectors improving outcome predictability | +1.0% | North America, select European markets, South Korea | Long term (≥ 4 years) |
| Growing adoption of long-acting lidocaine-enhanced HA fillers | +0.9% | Global, with early gains in North America and Europe | Short term (≤ 2 years) |
| Source: Mordor Intelligence | |||
Growing Preference Toward Minimally Invasive Aesthetic Procedures
Shorter downtime and reduced scarring make injectables a practical alternative to surgical facelifts, where recovery spans 2-4 weeks. The International Society of Aesthetic Plastic Surgery counted 7.8 million botulinum-toxin and 6.3 million hyaluronic-acid procedures in 2025, confirming mainstream acceptance [2]International Society of Aesthetic Plastic Surgery, “Global Aesthetic Survey 2025,” isaps.org. Employers in hospitality, retail, and media now subsidize injectables as wellness benefits in parts of South Korea, Singapore, and Hong Kong, reinforcing routine uptake. Improved safety profiles and shifting social norms recast treatments as periodic maintenance akin to dental cleanings. Upskilling courses that teach combination therapies extend indication breadth and boost average revenue per patient, encouraging providers to promote injectables as preventive rather than corrective care.
Rapid Launch of Long-Acting, Hybrid HA Fillers
Manufacturers blend hyaluronic acid with calcium hydroxylapatite or PLLA, stretching the effect duration from 9 months to 18 months and cutting annual visit frequency in half. Merz Pharma’s Radiesse hyperdilute protocol gained momentum in 2024 by lowering per-treatment material costs significantly while delivering collagen-stimulating benefits. Galderma’s Sculptra Aesthetic secured FDA clearance for temple and tear-trough use in 2025, broadening upper-face applications. Hybrid fillers resonate with patients in their late 20s and early 30s who want subtle, gradual improvements. Competitive pressure is prompting pure-HA suppliers to refine cross-linking technologies that prolong longevity, favoring firms with deep R&D pipelines.
Male Patient Adoption Driven by Social-Media-Filtered Appearance Norms
Men represented 17% of injectable procedures in 2025, up from 12% in 2020, fueled by the belief that a youthful look supports professional advancement in virtual meetings. Dedicated men’s suites with private entrances at clinics in New York, Los Angeles, and London reduce stigma. Allergan Aesthetics reports male demand skewing toward jawline definition and under-eye hollow correction rather than wrinkle management. Asian markets, particularly South Korea and Japan, already see men account for 22% of injectable patients, signaling future upside for Western regions.
Asia-Based Medical Tourism Packages Bundled with Injectables
Thailand and South Korea price bundled toxin and filler packages between USD 1,500 and USD 2,500, undercutting U.S. and European costs by up to 60% after airfare [3]Bumrungrad International Hospital, “International Patient Services Report 2024,” bumrungrad.com. Bumrungrad International Hospital treated more than 1.2 million foreign patients in 2024, 18% of revenue coming from aesthetics. South Korea earned USD 1.8 billion from aesthetic tourism in 2024, buoyed by advanced micro-botox techniques. Accreditation by global bodies such as the Joint Commission International reassures sophisticated travelers and mitigates concerns over counterfeit products.
Restraints Impact Analysis*
| Restraint | (~) % Impact on CAGR Forecast | Geographic Relevance | Impact Timeline |
|---|---|---|---|
| Regulatory crack-downs on off-label "party-tox" providers | -1.2% | North America, Western Europe, Australia | Short term (≤ 2 years) |
| Shortage of certified injectors in tier-2/3 cities | -0.9% | North America, Europe, select Asia-Pacific markets | Medium term (2-4 years) |
| Counterfeit filler trafficking via e-commerce channels | -0.7% | Global, with highest impact in Asia-Pacific and Latin America | Medium term (2-4 years) |
| Post-COVID household disposable-income squeeze in Europe | -0.6% | Europe, particularly Southern and Eastern regions | Short term (≤ 2 years) |
| Source: Mordor Intelligence | |||
Regulatory Crackdowns on Off-Label “Party-Tox” Providers
Unlicensed injectors operating in salons and social events face escalating enforcement. The FDA issued multiple warning letters in 2024, with some cases leading to criminal charges after vascular occlusions caused permanent harm. State medical boards in California, Texas, and Florida revoked licenses of practitioners delegating injections to unlicensed staff. The United Kingdom’s Care Quality Commission closed 14% of inspected clinics in 2024 for infection-control failures. As informal channels shrink, price-sensitive consumers confront higher treatment costs at licensed facilities.
Shortage of Certified Injectors in Tier-2/3 Cities
Demand growth outstrips the supply of qualified injectors outside major metros. Training programs accredited by the American Academy of Facial Esthetics carry 6-12-month waitlists and tuition fees between USD 5,000 and USD 15,000. Many U.S. states limit nurse practitioners’ scope without physician oversight, constraining medical-spa scalability. Patients in rural areas often travel up to 100 miles for treatment, spurring interest in tele-injector models hindered by cross-state licensure rules. The U.K.’s General Medical Council proposal for mandatory registration may disqualify thousands of current practitioners, further tightening supply.
*Our forecasts treat driver/restraint impacts as directional, not additive. The impact forecasts reflect baseline growth, mix effects, and variable interactions.
Segment Analysis
By Product Type: Biostimulators Challenge Botulinum Dominance
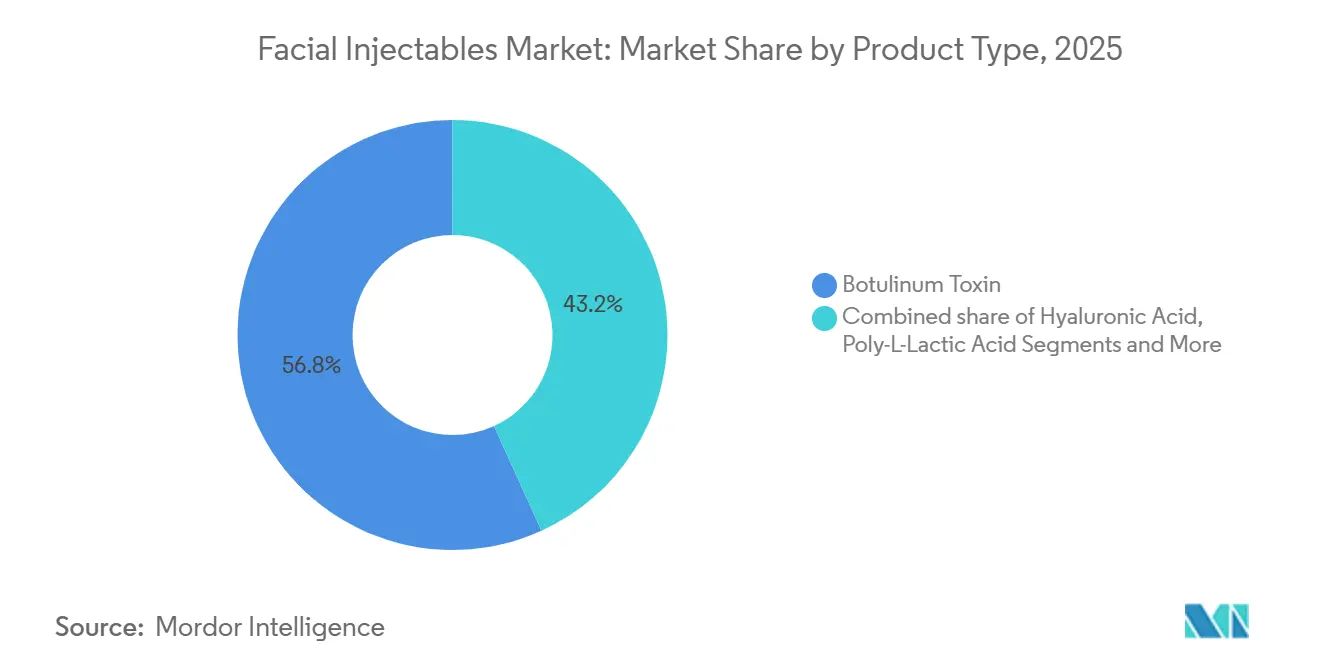
Botulinum Toxin secured 56.8% of 2025 revenue, anchoring the facial injectable market share for dynamic wrinkle treatment. However, Poly-L-Lactic Acid outpaces all rivals at a 14.6% CAGR, aided by long-lasting collagen induction that resonates with cost-conscious patients seeking fewer visits. Hyaluronic Acid fillers contribute a substantial slice of the facial injectable market size yet face commoditization as Asian makers drive per-syringe prices below USD 200. Calcium Hydroxylapatite rises for jawline contouring and hand rejuvenation, leveraging immediate lift and 12-18-month durability. Microspheres remain niche due to non-reversibility and higher complication risk, whereas collagen-based products persist mainly among practitioners who favor natural tissue integration. Three new botulinum formulations gained FDA approval in 2024, including Revance’s six-month Daxxify, hinting at forthcoming share realignments.
Innovations now focus on formulation chemistry and delivery devices instead of pure price competition. Companies with robust IP portfolios and regulatory capabilities enjoy a defensible edge as indication expansion and hybrid formulations raise approval complexity. As the facial injectable industry matures, white-space products that merge HA with biostimulatory agents or leverage microneedle arrays could disrupt entrenched brands once regulatory pathways clear.



By Gender: Female users prevail while male uptake accelerates
Women accounted for 83.1% of 2025 procedures, owing to established demand for minimally invasive anti-aging solutions like botulinum toxins and dermal fillers, with a strong consumer base among women over 40 seeking to maintain a youthful appearance and a growing segment of younger women opting for prejuvenation treatments.
Male procedure volume is rising significantly. Men often require higher product dosages and specialized techniques for treatments like jawline and chin enhancement to achieve a naturally masculine contour. The normalization of these procedures, coupled with companies launching male-specific marketing and discreet clinical environments, is accelerating uptake.
By Application: Scar Treatment Emerges as High-Growth Niche
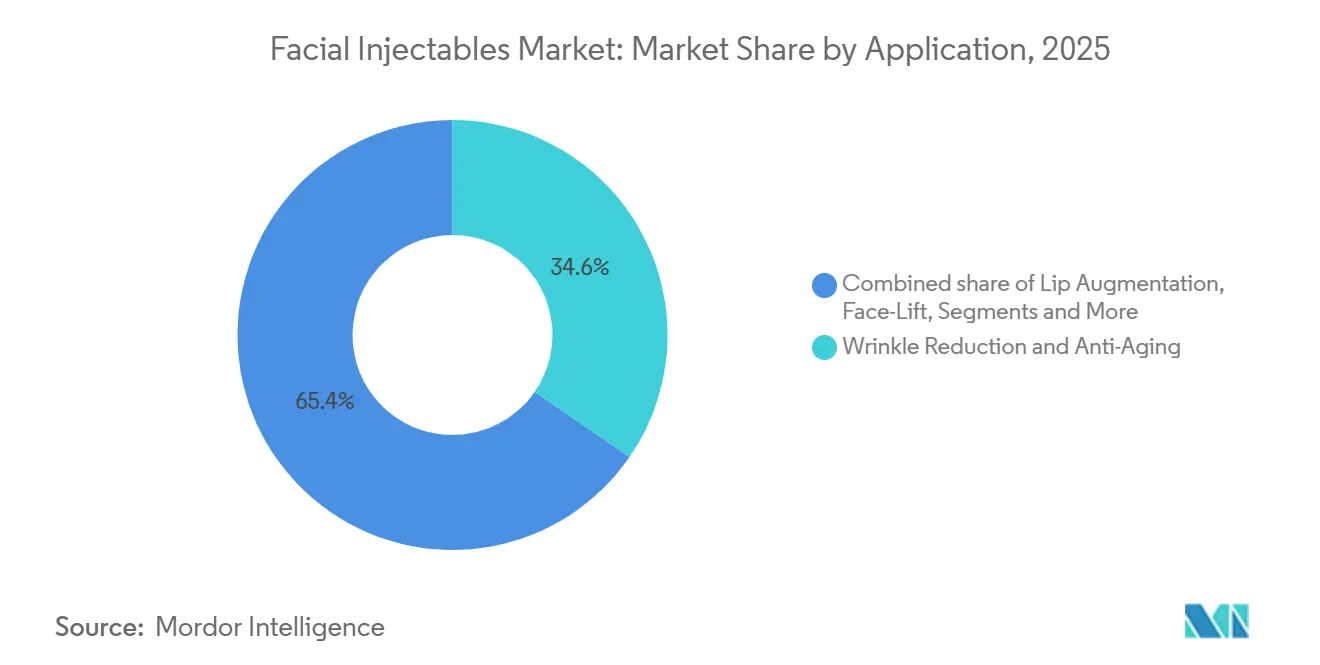
Wrinkle reduction and anti-aging held 34.6% revenue in 2025, reflecting an aging population and the rise of preventative “Baby Botox.” Scar and acne-scar treatment is the fastest-growing slot at a 13.9% CAGR through 2031, supported by subcision-assisted remodeling that combines hyaluronic acid and calcium hydroxylapatite to improve texture and volume. Lip augmentation retains a solid share but shows maturity in North America while expanding in Asia-Pacific, where full lips signal youth and social cachet. Injectable face-lift techniques capture demand from surgery-averse consumers who value non-invasive mid-face volumization.
Insurance-covered lipoatrophy correction for HIV patients offers a stable micro-segment, unusual within the cash-pay landscape. Emerging uses of temple augmentation, tear-trough correction, and non-surgical rhinoplasty advance at a 10.2% CAGR as injector skillsets broaden. Indication-specific products such as Restylane Kysse have seen significant adoption in the lip-filler category within 18 months of its 2024 debut, proving that targeted formulations can command premium pricing. Multi-vector treatments that address several aging markers in one session are raising average spend per visit and redefining clinical workflow.
By End-User: Medical Spas Disrupt Hospital-Based Model
Hospitals and dermatology clinics captured 51% of 2025 revenue thanks to clinical credibility and complication-management capabilities. Yet medical spas and aesthetic centers top growth tables at an 11.8% CAGR, powered by private-equity roll-ups that standardize care, centralize procurement, and roll out subscription memberships. Nurse-practitioner-led staffing models under remote physician supervision lower labor costs 30-40% while remaining compliant with board rules. Dynamic pricing algorithms adopted from hospitality optimize slot utilization and maximize revenue per injector.
Ambulatory surgical centers add injectables to diversify income, but facility fees keep them 20-30% costlier than retail medical-spa peers. Telemedicine platforms that match patients with mobile injectors target rural gaps yet wrestle with insurance and cross-state licensure hurdles. Traditional hospital systems respond by carving out branded cosmetic suites and revamping marketing to retain share. Franchise chains refine tiered membership programs offering discounts, loyalty points, and priority scheduling, mirroring successful fitness-club models.
Geography Analysis
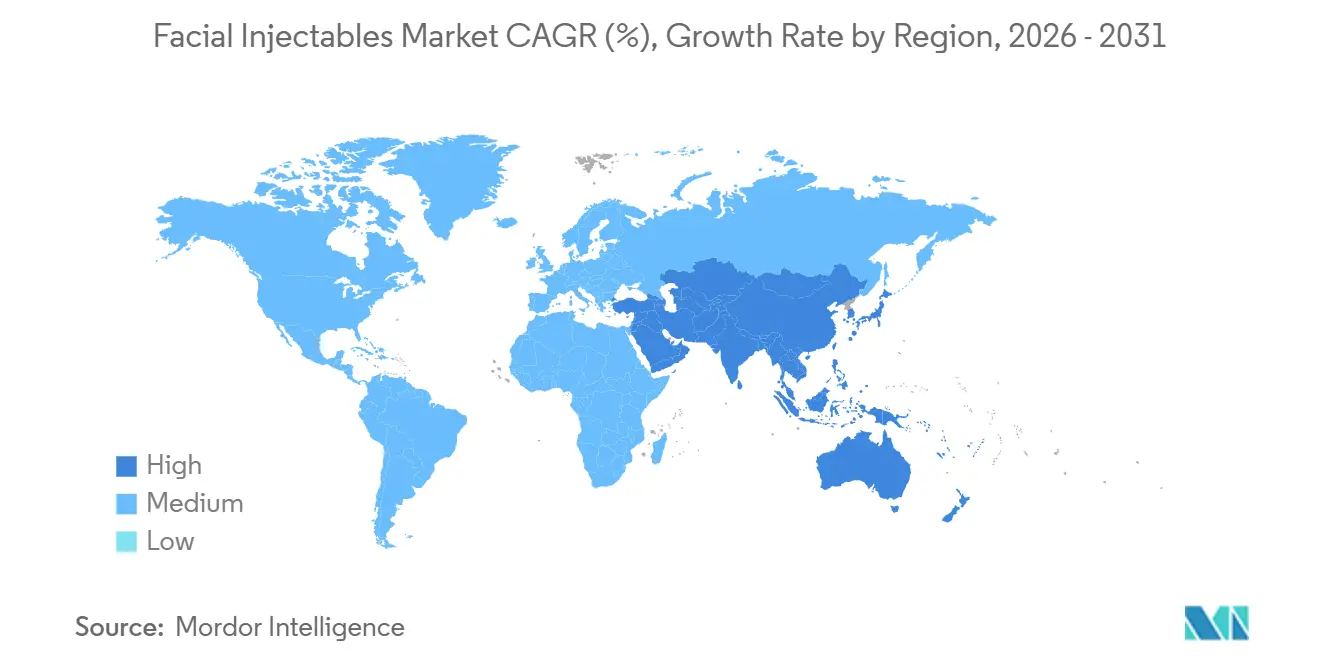
North America preserved 39.3% of global facial injectable market share in 2025, anchored by robust per-capita spend, clear regulatory pathways, and high practitioner density. The United States delivers roughly 85% of regional revenue, with California, Texas, Florida, and New York representing more than half of national volume. Canada lags because provincial law mandates physician oversight for nurse-practitioner injectors, elevating treatment costs, while Mexico harvests value as a tourism hub, offering 40-60% discounts near border cities despite ongoing counterfeit-product risks.
Asia-Pacific posts the swiftest 10.5% CAGR through 2031, lifted by rising disposable incomes in China and India and by structured medical-tourism circuits in Thailand and South Korea. South Korea exported USD 89 million worth of botulinum products in 2024, winning approvals in 14 new markets including Brazil and Mexico. National Medical Products Administration cleared eight new HA fillers in 2025, enabling domestic makers to underprice imports by up to 40% while meeting ISO 13485 standards. Japan maintains conservative growth due to strict approval standards, whereas India’s urban centers post double-digit gains despite rural under-penetration.
The Medical Device Regulation in force since 2024 raises compliance costs and lengthens approval timelines, favoring well-resourced multinationals. The Middle East and Africa track 9.2% CAGR, led by UAE and Saudi Arabia, where government programs market Dubai and Riyadh as aesthetic-tourism gateways. South America grows at 8.7% CAGR, with Brazil’s ingrained aesthetic culture balancing macroeconomic volatility. Europe held about 28% of 2025 revenue. Household disposable income fell 12% versus pre-COVID levels, pressuring elective spending in Southern and Eastern nations.

Regulatory Landscape
Facial injectables operate under increasingly strict, high-risk oversight across major markets, which raises the clinical-evidence and quality-system burden for both manufacturers and clinic channels. In the United States, most dermal fillers follow a Class III medical device pathway with FDA Premarket Approval (PMA), as reflected by Symatese's Evolysse Smooth and Evolysse Form approvals in February 2025 (PMA P240022). FDA actions in 2024 against unlicensed "party-tox" providers reinforced enforcement risk for off-channel administration and made compliant, licensed settings more central to distribution and training.
In Europe, the EU Medical Device Regulation (MDR) has tightened conformity assessment and post-market surveillance, including via Annex XVI rules that pull certain aesthetic products without an intended medical purpose into MDR-style obligations. This structure favors suppliers with established ISO 13485 and vigilance infrastructure. The United Kingdom is also moving toward a national licensing framework for non-surgical cosmetic procedures under the Health and Care Act 2022, alongside government crackdowns on unsafe cosmetic practices, which elevates the role of standardized practitioner qualification and clinic governance. A steady cadence of U.S. approvals in 2026, including Revance and Teoxane's RHA Dynamic Volume (January 2026), Galderma's Restylane Contour for temple hollowing (March 2026), and Merz's Belotero Volume (+) Lidocaine (May 2026), points to an active regulatory environment where label expansion and new indications remain key competitive levers.
Value Chain Analysis
The facial injectables value chain bifurcates into (i) fermentation-driven botulinum toxin production and fill-finish and (ii) polymer and biomaterial science-driven dermal filler formulation, notably HA and biostimulators such as PLLA and CaHA. Upstream inputs include biologic culture systems and containment for toxins, and medical-grade polymers, cross-linkers, and sterility assurance systems for fillers. Both tracks rely on validated manufacturing, packaging, and traceability aligned with ISO 13485 and jurisdiction-specific controls for high-risk devices. Because toxins are sensitive to facility-level contamination and process deviations, and fillers depend on rheology, particulate control, and aseptic processing, scale and quality management remain persistent constraints that affect costs, supply resilience, and support for broad label expansions.
Downstream, manufacturers increasingly use hybrid go-to-market models, combining direct contracting and digital ordering with large clinic groups and MSO-style platforms, alongside specialized medical aesthetics distributors and wholesalers that manage inventory and cold-chain handling where needed. Provider consolidation in key U.S. states such as Texas and Florida supports more centralized procurement and formulary behavior, while training and credentialing ecosystems, including accredited injector education programs, help drive product pull-through and protocol standardization. Regulatory milestones also feed back into commercialization sequencing, with FDA approvals and expanded indications, for example Galderma's Restylane Lyft for chin profile enhancement in 2025, enabling more targeted demand generation and supporting premium positioning across specific facial use cases.
Competitive Landscape
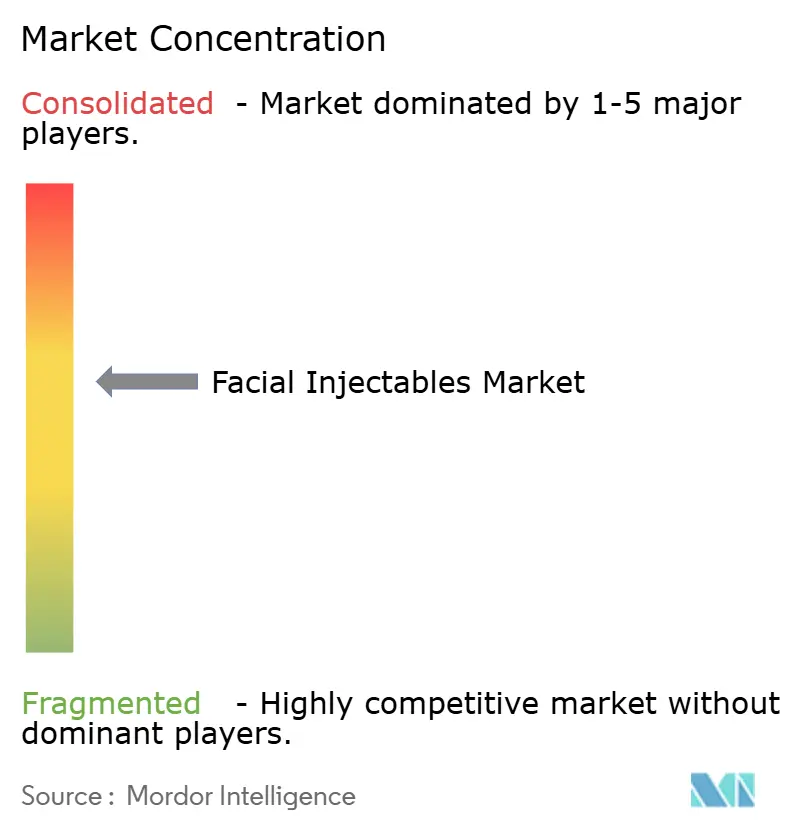
The top five suppliers—AbbVie (Allergan Aesthetics), Galderma, Merz Pharma, Ipsen, and Revance Therapeutics collectively controlled a majority of the 2025 global revenue, giving the facial injectable market a moderately concentrated structure. Asian challengers such as Daewoong, Medytox, Huons Global, and Bloomage Biotechnology are capturing cost-sensitive segments through aggressive pricing and swift regulatory filing, particularly in emerging economies. Patent cliffs on first-generation toxins and HA fillers open gates for biosimilars that intensify price competition in Europe and Asia-Pacific. Incumbents respond by expanding indications, investing in delivery innovations, and deepening clinical-evidence pipelines.
Vertical integration is a dominant theme. Manufacturers acquire medical-spa chains and training academies, ensuring product loyalty and procedural standardization. Technology tie-ups accelerate: AbbVie’s 2024 microneedle-array patent signals intent to migrate certain use cases toward self-administration, though regulatory hurdles persist. AI and robotic injection partnerships promise consistent dosing and may allow non-physicians to handle routine areas, mitigating injector scarcity. Telemedicine ventures and subscription-based franchises pose distributive threats to hospital-centric models unless incumbents evolve.
Strategic moves in 2024-2025 include Revance’s USD 150 million Series D to launch Daxxify, Daewoong’s Brazilian joint venture to localize Nabota production, and Bloomage’s 60% stake in BioPlus for advanced cross-linking tech. Large players increasingly provide outcome-simulation software within training curriculums, embedding their ecosystems deeper into daily clinic operations.
Facial Injectables Industry Leaders
AbbVie Inc.
Galderma SA
Ipsen SA
Merz Pharma
Revance Therapeutics Inc.
- *Disclaimer: Major Players sorted in no particular order

Market Opportunities and Future Outlook
Opportunity is opening in indication expansion beyond traditional wrinkle and midface volume use, supported by recent label moves from major incumbents. U.S. approvals in 2026 for products positioned around distinct anatomical needs and performance profiles, including Galderma's Restylane Contour for temple hollowing (March 2026) and Merz's Belotero Volume (+) Lidocaine for midface volumization (May 2026), show that manufacturers can carve out incremental, premium-priced niches within mature toxin and filler categories by targeting underserved zones and procedure protocols. This supports whitespace for differentiated portfolios, including HA products designed for specific tissue planes and movement dynamics, and biostimulators that complement fillers in combination regimens. Those options align with clinic upselling and bundling models.
A second opportunity is tied to tightening compliance and channel formalization, which shifts volume toward licensed providers and well-governed medical spa chains that can standardize training, sourcing, and outcomes. The United Kingdoms move toward a national licensing scheme for non-surgical cosmetic procedures under the Health and Care Act 2022, alongside heightened enforcement attention in markets such as the United States (FDA warning letters tied to unlicensed administration in 2024), reinforces demand for manufacturer-run training, traceable supply, and clinic-level quality controls that reduce adverse-event and counterfeit risk. Capacity and supply-chain investment, particularly in South Korea for botulinum toxin manufacturing, also points to room for scaled exporters and for multinationals to secure more resilient sourcing and regional filing strategies, as cross-border medical tourism channels continue to concentrate procedure volumes in destinations such as Thailand and South Korea.
Recent Industry Developments
- June 2026: Allergan Aesthetics (AbbVie) announced Health Canada approval for Boey (trenibotulinumtoxinE) for the temporary improvement of moderate to severe glabellar lines. The approval advances serotype E as a differentiated, rapid-onset, short-duration option and strengthens AbbVie ability to segment neurotoxin use cases by patient preference and treatment cadence in a major North American market.
- July 2025: Waldencast plc acquired Novaestiq Corp. and the U.S. rights to the Saypha line of hyaluronic acid injectable gels from Croma-Pharma. The transaction added an FDA-approved filler platform to the Obagi Medical brand, giving Waldencast a direct entry point into U.S. dermal fillers and expanding competitive pressure in the HA segment through a new multi-brand commercial vehicle.
- October 2024: Allergan Aesthetics (AbbVie) received U.S. FDA approval for BOTOX Cosmetic (onabotulinumtoxinA) for the treatment of moderate to severe vertical platysma bands. The label expansion broadened BOTOX Cosmetics addressable anatomy into the neck, supporting higher per-patient utilization and reinforcing incumbent advantage through continuous indication growth.


Research Methodology Framework and Report Scope
Market Definition and Coverage
For this study, the facial injectables market covers injectable aesthetic products used in the face to reduce lines, restore volume, and improve contour through in-clinic administration, with revenues captured at the point of sale to healthcare providers.
Scope exclusions: This scope excludes surgical implants, energy-based facial devices, and topical cosmetics or skin care products.
Segmentation Overview
- By Product Type
- Botulinum Toxin
- Hyaluronic Acid (HA)
- Calcium Hydroxylapatite (CaHA)
- Poly-L-Lactic Acid (PLLA)
- PMMA Microspheres
- Collagen & Others
- By Gender
- Female
- Male
- By Application
- Wrinkle Reduction & Anti-Aging
- Lip Augmentation
- Scar & Acne-Scar Treatment
- Face Lift
- Lipoatrophy Treatment
- Others (Temple, Tear-Trough, etc.)
- By End-User
- Hospitals & Ambulatory Surgical Centers
- Aesthetic & Cosmetic Surgery Centers
- Medical Spas & Others
- By Geography
- North America
- United States
- Canada
- Mexico
- Europe
- Germany
- United Kingdom
- France
- Italy
- Spain
- Rest of Europe
- Asia-Pacific
- China
- Japan
- India
- Australia
- South Korea
- Rest of Asia-Pacific
- Middle East and Africa
- GCC
- South Africa
- Rest of Middle East and Africa
- South America
- Brazil
- Argentina
- Rest of South America
- North America
Data Sources, Market Sizing, and Validation
Desk Research
Desk work starts with building a clean market boundary and a list of measurable demand and supply signals that can be tracked year over year. We mainly used public sources such as U.S. FDA databases for product approvals and safety updates, CDC and National Center for Health Statistics aging and population tables, OECD health spending indicators, World Bank macro and income series, and UN Comtrade trade data for relevant medical or pharma product flows.
Next, the model inputs are cross-checked using company annual reports, investor decks, reputable medical society and association websites, and peer-reviewed journals that discuss procedure trends and patient preferences. Where needed, we also used a paid subscription for company financials and news monitoring, along with a paid patent database to spot technology shifts that can affect pricing and adoption. The desk source list above is illustrative, and we also reviewed other public sources for data collection, validation, and clarification.
Primary Interviews and Surveys
Primary work is used to validate what desk sources cannot reliably show, especially how procedure volumes, average doses per treatment, and price changes are behaving across provider types. We spoke with a mix of manufacturers, distributors, dermatology and cosmetic clinics, and hospital or ambulatory settings across APAC, EMEA, and the Americas, and we also re-contacted select experts when early assumptions looked inconsistent across countries.
Distribution of primary research fieldwork respondents
| Company type | Respondent position | Region |
|---|---|---|
| Top tier: 32% | CXOs: 15% | APAC: 44% |
| Mid tier: 47% | Functional/Unit leaders: 34% | EMEA: 32% |
| Smaller Players: 21% | Managers: 51% | Americas: 24% |
Market-Sizing & Forecasting
Sizing starts with a top-down build that reconstructs the treated aesthetic demand pool by aligning adult population by age bands with procedure propensity, and then converting that into annual injectable consumption using typical sessions per patient and product mix by indication. Once that demand spine is in place, price is applied using an average selling price range grounded in clinic price lists, distributor feedback, and observed inflation patterns.
To keep the totals realistic, we corroborate results with selective bottom-up approximations, such as sampling country level provider counts and throughput, and then scaling volumes with reported utilization patterns. Inputs that matter most include procedure volumes for neurotoxin and filler treatments, repeat rates and maintenance cycles, dose per session, mix shifts across hyaluronic acid, botulinum toxin, and biostimulatory fillers, and the pace of new approvals that can expand eligible users. When data is thin for smaller countries, gaps are handled through proxy countries with similar income levels, urbanization, and provider density, followed by adjustments from interviews.
Forecasts are built using scenario analysis supported by a multivariate regression layer, where adoption is linked to aging trends, discretionary spending indicators, and clinic capacity expansion, and then tuned based on what practitioners and channel participants expect for pricing and utilization.
Data Validation & Update Cycle
Outputs are checked in multiple steps so a single assumption does not move the market size too far without being noticed. We compare implied procedure volumes, per-patient usage, and pricing outcomes against independent signals like provider density changes, trade flows where relevant, and publicly visible clinic pricing, and then we review any large variance by country and product type.
Before sign-off, another analyst reviews the logic, the math, and the reasonableness of the growth path, and follow-up calls are triggered when a metric looks out of line with real-world practice. Reports are refreshed annually, with interim updates made when there are material events such as major approvals, safety actions, or sharp currency and inflation shifts. Right before delivery, we complete a final pass so clients receive the latest updated view.
Mordor Intelligence's Facial Injectables Market Size Versus Other Published Estimates
Different sources often show different facial injectables market values because the scope line is drawn differently, and because procedure volume and pricing assumptions are not always handled the same way across countries. Timing also matters, since exchange rates, inflation, and approval driven mix changes can shift the current-year total even when underlying demand is steady.
By tracking procedure cadence, dose-per-session norms, and clinic-level price movement, Mordor Intelligence keeps the 2026 value tied to an explicit treated-demand build, rather than relying mainly on supplier revenue extrapolation or a single base-year snapshot.
Benchmark comparison
| Source | Market Size | Gaps in Research Methodology |
|---|---|---|
| Mordor Intelligence | USD 15.55 B (2026) | |
| Global Consultancy A | USD 11.80 B (2025) | Uses an earlier base year and a broader country list, and the sizing leans more on reported revenues and category roll-ups, which can undercount the effect of rising per-treatment prices and repeat visit frequency in high-utilization markets. |
| Industry Publisher B | USD 10.22 B (2025) | Anchors the model on 2025 and applies a different product-mix and end-user weighting, with less visibility on dose progression and maintenance cycles, which can compress the current-year total when utilization is shifting. |
The spread mainly comes from base-year choice and how procedure intensity and pricing are translated into revenue, especially when repeat rates change. When the scope and conversion steps are made explicit, the estimate is easier to audit, and it is more stable when refreshed with new utilization and pricing checks.


Key Questions Answered in the Report
What was the global facial injectable market size in 2026?
It reached USD 15.55 billion, setting the baseline for forecast analysis.
Which region will grow fastest for facial injectables through 2031?
Asia-Pacific leads with a projected 10.5% CAGR, driven by medical tourism and rising disposable incomes.
Which product segment is expanding quickest?
Poly-L-Lactic Acid fillers grow at 14.6% CAGR on the strength of long-acting collagen induction.
Why are medical spas outpacing hospital clinics?
Private-equity-backed medical spas leverage standardized protocols, lower labor costs, and subscription models, yielding an 11.8% CAGR.
How is medical tourism influencing demand patterns for injectables?
Cost advantages and well-publicized centers of excellence in destinations like South Korea and Mexico draw international patients, concentrating high procedure volumes in regional hubs and spurring local innovation.
What major restraint could slow near-term growth?
Regulatory crack-downs on unlicensed “party-tox” providers reduce informal access and push prices higher in licensed settings.
Page last updated on:





