Market Overview
| Study Period | 2021 - 2031 |
|---|---|
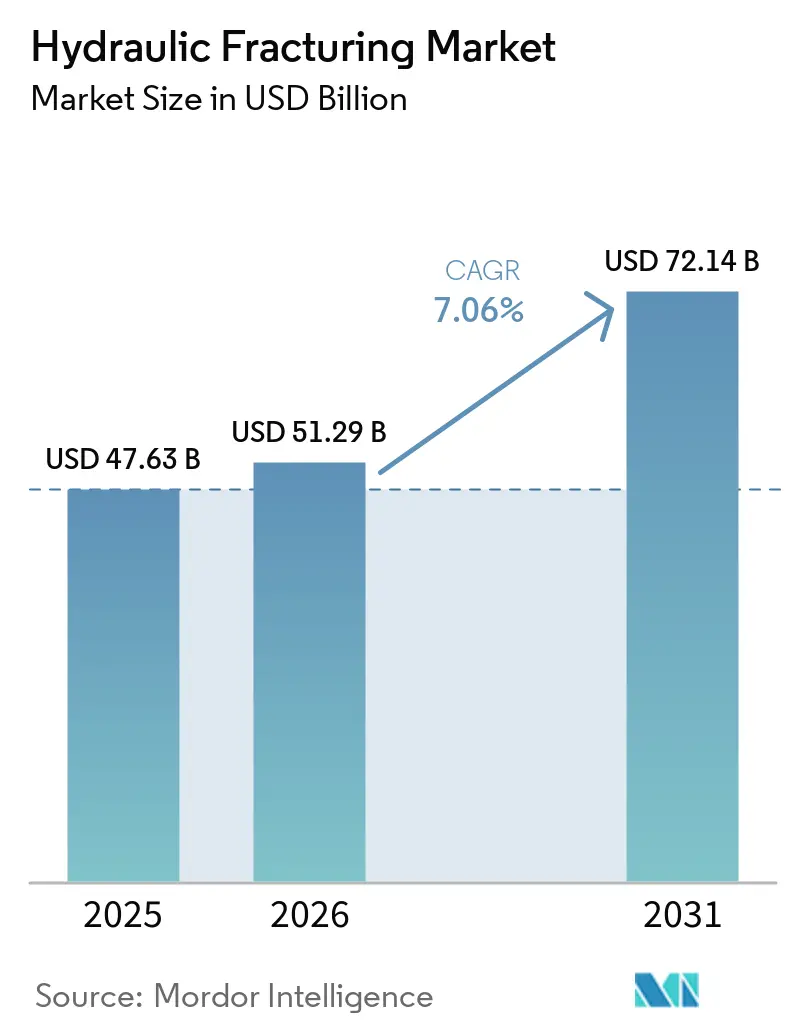
| Market Size (2026) | USD 51.29 Billion |
| Market Size (2031) | USD 72.14 Billion |
| Growth Rate (2026 - 2031) | 7.06% CAGR |
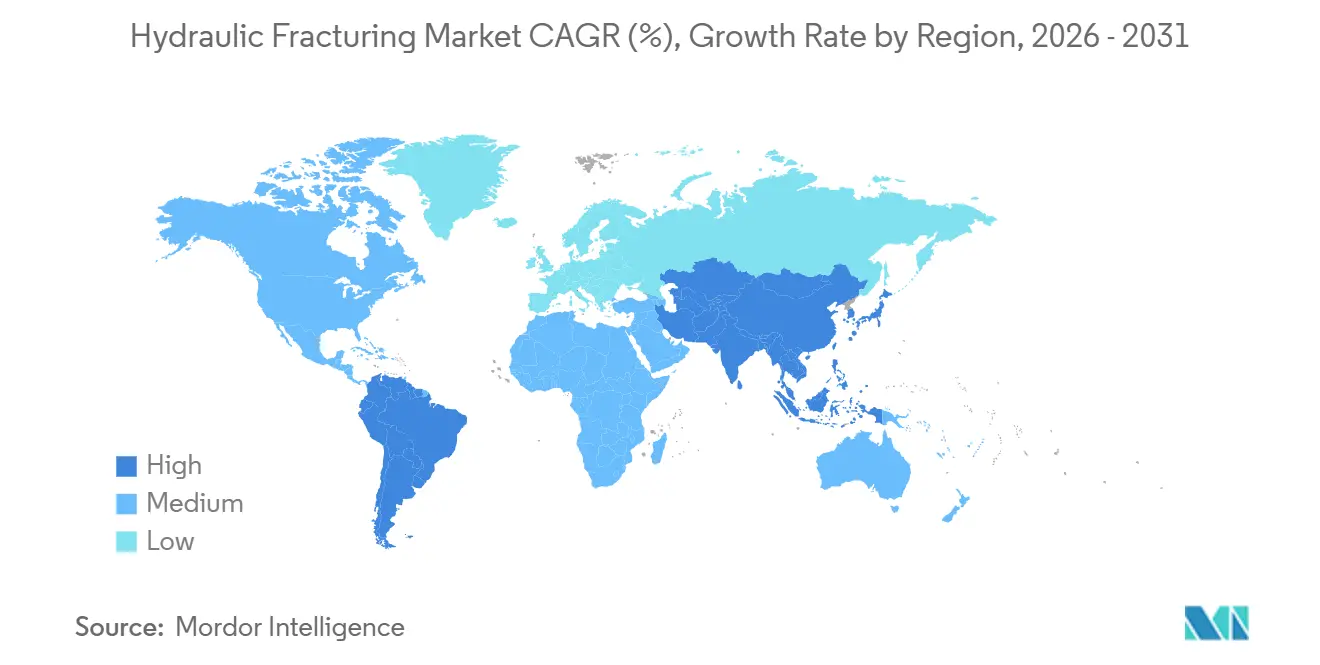
| Fastest Growing Market | Asia Pacific |
| Largest Market | North America |
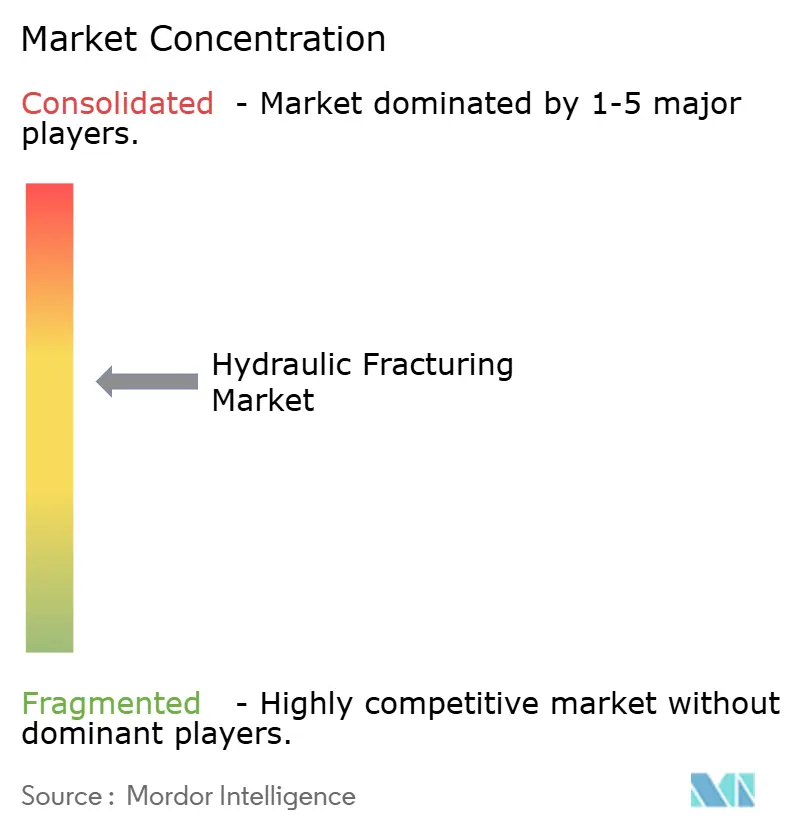
| Market Concentration | Medium |
Major Players *Disclaimer: Major Players sorted in no particular order Image © Mordor Intelligence. Reuse requires attribution under CC BY 4.0. | |
Hydraulic Fracturing Market Analysis by Mordor Intelligence
The Hydraulic Fracturing Market size is expected to increase from USD 47.63 billion in 2025 to USD 51.29 billion in 2026 and reach USD 72.14 billion by 2031, growing at a CAGR of 7.06% over 2026-2031.
Growing unconventional resource development, a pivot toward margin-optimized operations, and technology upgrades such as electric fleets anchor this trajectory. Continued electrification, real-time monitoring, and automation reduce wellsite fuel costs by up to 25% and improve stage-delivery efficiency by 17%.[1]Halliburton, “Electric Fracturing Cost Savings,” halliburton.com Mature shale plays in North America underpin current demand, while policy support in China and Argentina accelerates new activity. Consolidation among service providers concentrates technology ownership, yet moderate market concentration leaves space for regional firms with niche capabilities. Environmental regulations raise water-management costs by 15-20%, but the same rules spur investment in waterless fracturing methods that enhance permeability by several orders of magnitude.
Key Report Takeaways
- By well type, horizontal wells led with 80.1% hydraulic fracturing market share in 2025, while the same segment is projected to post the fastest 8.4% CAGR through 2031.
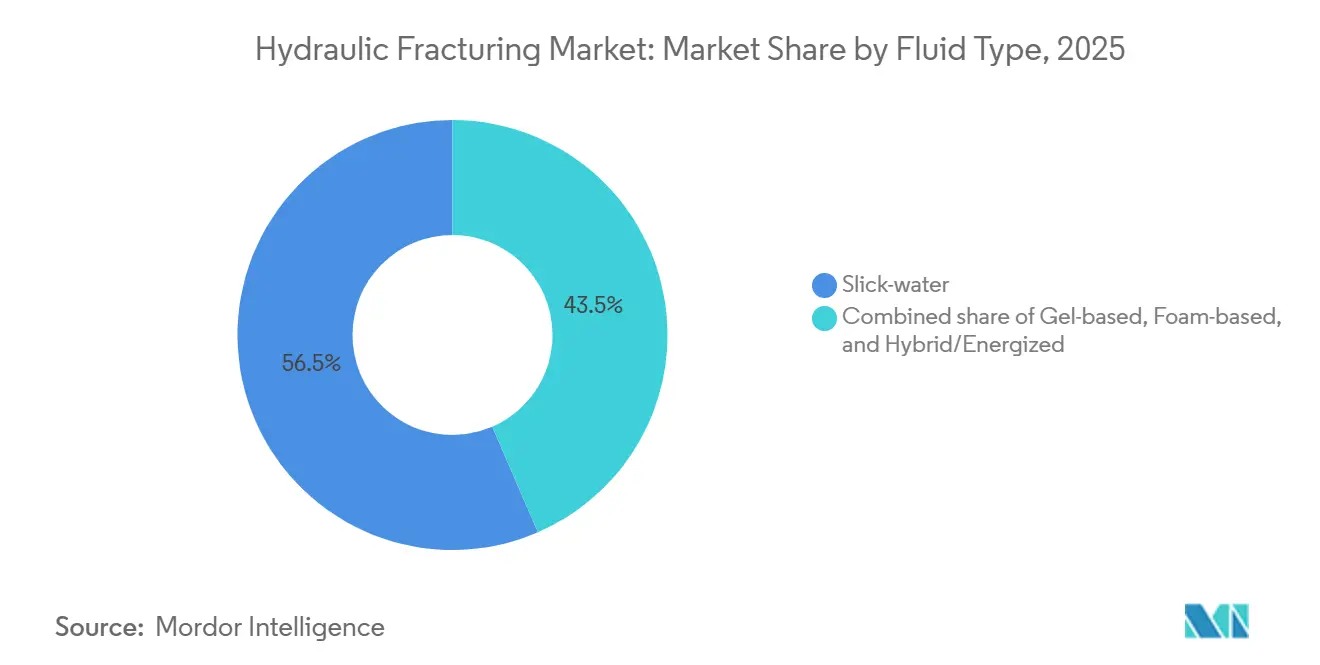
- By fluid type, slick-water retained 56.5% share in 2025; hybrid and energized fluids are expected to advance at 9.3% CAGR during 2026-2031.
- By proppant type, frac sand captured 83.4% share in 2025, whereas ceramic proppants are expected to advance at 8.8% CAGR to 2031.
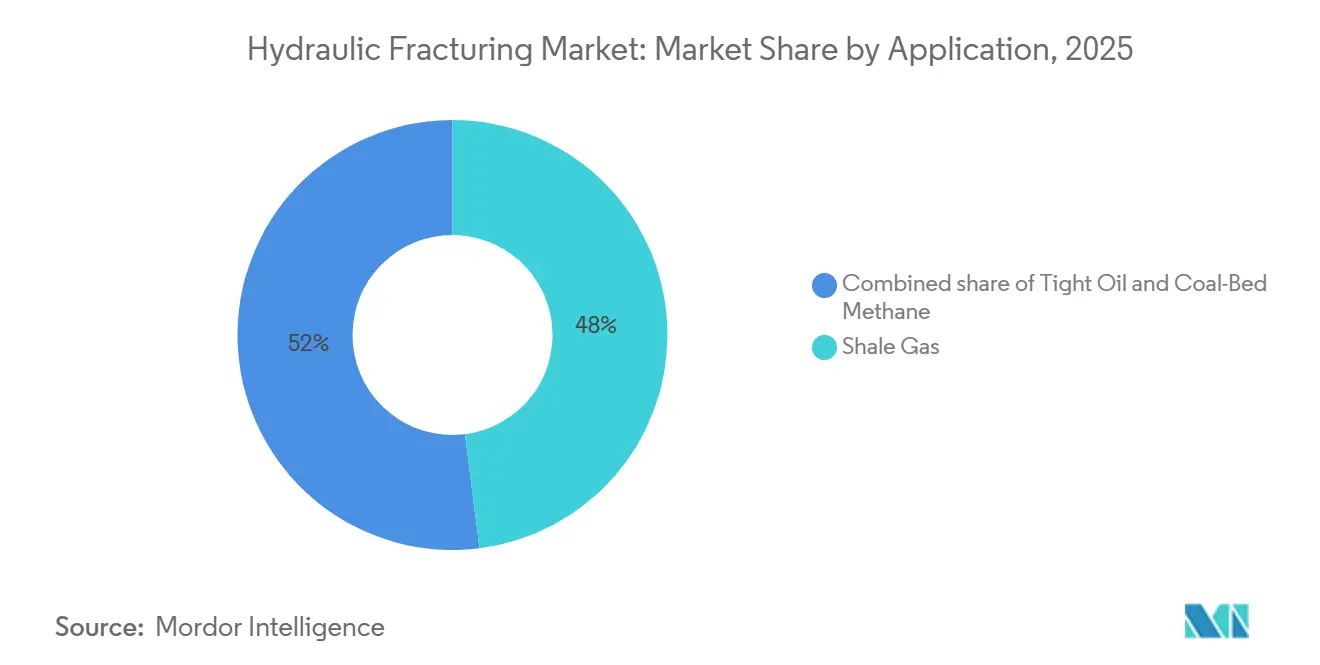
- By application, shale gas dominated with 48.0% share in 2025; tight oil is projected to advance at 7.7% CAGR out to 2031.
- By geography, North America contributed 67.7% revenue in 2025, while Asia-Pacific is projected to expand at a 10.1% CAGR over 2026-2031.
Note: Market size and forecast figures in this report are generated using Mordor Intelligence’s proprietary estimation framework, updated with the latest available data and insights as of 2026.
Global Hydraulic Fracturing Market Trends and Insights
Drivers Impact Analysis*
| Driver | (~) % Impact on CAGR Forecast | Geographic Relevance | Impact Timeline |
|---|---|---|---|
| Shale gas and tight-oil development boom | +1.8% | North America core, spillover to Argentina (Vaca Muerta) and China (Sichuan Basin) | Long term (≥ 4 years) |
| Rising global gas demand and fuel-switching | +1.5% | Global, with peak demand in Asia-Pacific (coal-to-gas switching) and Europe (LNG imports) | Medium term (2-4 years) |
| Advances in multi-stage horizontal fracturing | +1.2% | North America, Asia-Pacific (China, Australia), Middle East (Saudi Arabia, UAE) | Medium term (2-4 years) |
| Government incentives in China and Argentina | +0.8% | China (Sichuan, Ordos basins), Argentina (Vaca Muerta formation) | Short term (≤ 2 years) |
| Real-time fiber-optic and AI-driven frac optimization | +0.6% | North America, early adoption in Middle East (ADNOC, Aramco projects) | Medium term (2-4 years) |
| Rapid adoption of electric frac fleets (e-Frac) | +0.5% | North America (Permian Basin focus), pilot projects in Middle East | Short term (≤ 2 years) |
| Source: Mordor Intelligence | |||
Shale Gas and Tight-Oil Development Boom
United States shale operators drilled 11,200 horizontal wells during 2025, a 12% increase from 2024, while Argentina’s Vaca Muerta added 340 wells that tripled prior output.[2]U.S. Energy Information Administration, “Short-Term Energy Outlook,” EIA.GOV China approved 28 new shale blocks targeting 30 billion m³ annual output by 2030 to displace LNG imports. Liquids-rich zones now contribute up to 50% of wellhead revenue, insulating operators from subdued Henry Hub prices that averaged USD 2.80 per MMBtu in 2025. Permian Basin breakevens fell to USD 38-42 per barrel in 2025, matching some offshore projects and redirecting capital toward onshore unconventional developments. Faster first-oil timelines of 90 days versus the 5-7 years typical for deep-water campaigns continue to reinforce the hydraulic fracturing market momentum.
Rising Global Gas Demand and Fuel Switching
Global gas use climbed to 4,150 billion m³ in 2025 as 62 GW of coal-fired capacity retired in Asia-Pacific power grids. European Union demand rebounded to 380 billion m³ with Russian pipeline imports at 8% of total supply, spurring renewed domestic unconventional activity in Poland and Romania.[3]European Commission, “EU LNG Import Statistics 2025,” EC.EUROPA.EU Industrial buyers executed long-term gas contracts at USD 6-8 per MMBtu, giving price certainty to marginal basins. Southeast Asia offered 14 unconventional exploration blocks to curb diesel import bills, although permitting for water disposal and seismicity remains in flux. Data-center load growth saw hyperscalers reserve 18 GW of gas-fired capacity in 2025, underscoring durable demand for the hydraulic fracturing market.
Advances in Multi-Stage Horizontal Fracturing
Completion designs in 2025 featured 60-80 perforation clusters per lateral, shrinking cluster spacing to 15-20 ft, and lifting effective fracture half-length by 18%. Intelligent systems adjusted pump rates in real time, cutting water use per lateral by 22%. Plug-and-perf with dissolvable plugs reduced stage time to 28 minutes and saved USD 200,000-300,000 per well. Saudi Aramco’s 48-stage carbonate wells proved the concept’s adaptability to high-temperature reservoirs. Pad drilling lowered mobilization costs by 35%, improving fleet utilization to 85%.
Real-Time Fiber-Optic and AI-Driven Frac Optimization
Distributed acoustic and temperature sensing equipped 4,800 United States wells in 2025, helping engineers identify unstimulated lateral sections. Machine learning combined with fiber-optic data predicted parent-child well interference, boosting ultimate recovery by 12-15%. ADNOC applied similar systems across 120 Middle East wells, trimming completion time by 20%. Installation costs fell to USD 95,000 in 2025, widening the hydraulic fracturing market addressable base for digital monitoring.
Restraints Impact Analysis*
| Restraint | (~) % Impact on CAGR Forecast | Geographic Relevance | Impact Timeline |
|---|---|---|---|
| Water-use restrictions and environmental opposition | -1.2% | North America (Texas, New Mexico, Colorado), Europe (UK, Germany fracturing bans) | Short term (≤ 2 years) |
| Commodity-price volatility hurting well economics | -0.9% | Global, most acute in North America (DUC inventory buildup) and South America (Argentina currency risk) | Medium term (2-4 years) |
| Sand-mining bans disrupting proppant supply chain | -0.4% | North America (Wisconsin, Minnesota restrictions), spillover to Permian Basin supply costs | Short term (≤ 2 years) |
| ESG-linked capital access constraints | -0.3% | Global, concentrated in Europe (bank lending restrictions) and North America (private equity refinancing) | Medium term (2-4 years) |
| Source: Mordor Intelligence | |||
Water-Use Restrictions and Environmental Opposition
Texas mandated 50% recycled water in Permian completions from January 2025, compelling USD 1.2 billion of investment in treatment networks and raising well costs by USD 150,000-200,000.[4]Texas Railroad Commission, “Permian Produced Water Rulemaking,” RRC.TEXAS.GOV New Mexico outlawed surface disposal of produced water, lifting operating expenses by up to 25%. European moratoria persisted, locking away 2.3 Tcf of recoverable gas. Disposal costs climbed to USD 1.20 per barrel as produced water in the Permian hit 18 million barrels daily. Large operators installed advanced oxidation units with 95% water recovery, but capital intensity restricts uptake to pad developments with at least 10 wells.[5]U.S. Environmental Protection Agency, “Produced Water Guidelines,” EPA.GOV
Commodity-Price Volatility Hurting Well Economics
West Texas Intermediate vacillated between USD 62 and USD 78 per barrel through 2025, swelling the drilled-but-uncompleted well count to 4,200 by year-end as producers deferred completions. Henry Hub averaged USD 2.80 per MMBtu, undercutting Haynesville breakevens and slicing Louisiana rig counts by 28%. Argentine peso devaluation shaved service margins, causing renegotiations with 15-20% discounting. Private-equity E&Ps grappled with 200-300 basis-point wider credit spreads that curbed completion budgets.
*Our forecasts treat driver/restraint impacts as directional, not additive. The impact forecasts reflect baseline growth, mix effects, and variable interactions.
Segment Analysis
By Well Type: Horizontal Wells Dominate Unconventional Plays
Horizontal wells held 80.1% hydraulic fracturing market share in 2025 and are forecast to post an 8.4% CAGR, cementing their role in accessing tight reservoirs that vertical wells cannot drain. The hydraulic fracturing market size attributed to horizontal designs reached USD 38.2 billion in 2025 and is projected to climb to USD 60.3 billion by 2031 as operators extend laterals past 10,500 ft and tighten cluster spacing. Vertical wells linger in legacy coal-bed methane fields and thick conventional formations, yet their share steadily erodes. Sinopec’s 180 horizontal shale wells in Sichuan averaged 420,000 m³ daily output, triple vertical equivalents.
Cost curves underscore adoption. Permian horizontal well costs slid to USD 6.2 million in 2025, down 20% from 2022, improving returns to 25-30% at USD 70 oil. International markets repeat the learning curve: Saudi Aramco imported 18 high-spec spreads for 240 horizontal wells, while Argentina drilled 340 laterals that cut spud-to-production times to 75 days. As more national oil companies mandate local content, equipment localization could lower expenses by a further 10-15% by 2028, reinforcing the horizontal paradigm within the hydraulic fracturing market.
By Fluid Type: Hybrid Systems Gain in Complex Reservoirs
Slick-water commanded 56.5% share in 2025 due to low cost, yet hybrid and energized fluids are expanding at a 9.3% CAGR to address deeper, high-pressure plays. CO₂ energized systems raised initial rates by 22% in Chevron’s 85 Spraberry wells versus slick-water, despite a USD 100,000 higher stage cost. The hydraulic fracturing market size for hybrid fluids is projected to jump from USD 9.3 billion in 2025 to USD 15.2 billion by 2031 as carbon capture growth cuts CO₂ sourcing costs.
Gel systems still hold roughly 18% share, where high-temperature carbonate reservoirs demand viscosity durability, evident in Saudi Aramco’s 2025 fluid mix. Foam fluids cater to water-sensitive coal seams, maintaining a niche 8-10% slice of spending. Falling CO₂ prices to USD 35-40 per ton, coupled with ESG pressure to limit water use, will maintain hybrid fluids as the fastest-growing sub-segment in the hydraulic fracturing market.


By Proppant Type: Ceramics Advance in High-Pressure Wells
Frac sand owned 83.4% share in 2025, given abundant in-basin supply and USD 25-35 per ton logistics economics. Yet ceramic proppants are on an 8.8% CAGR track, propelled by ultra-high-pressure environments where sand loses conductivity. The hydraulic fracturing market size for ceramics is forecast to rise from USD 3.4 billion in 2025 to USD 5.6 billion by 2031, capturing adoption in Saudi Arabia, UAE, and deep Chinese shale.
Resin-coated sand keeps a 12-14% foothold, mitigating proppant flowback at a USD 80-100 per ton premium. Northern White sand shortfalls after Midwest mining bans lifted spot prices 35% in Q2 2025, prompting Permian operators to boost brown sand usage to 65% of volumes. Ceramic capacity expansions of 420,000 tpa announced in 2025 reflect the producer's conviction that high-pressure wells will proliferate across the hydraulic fracturing market.
By Application: Tight Oil Gains on Liquids Economics
Shale gas held 48.0% share in 2025, but tight oil is the fastest riser at a 7.7% CAGR because liquids pricing shields wells from gas volatility. The hydraulic fracturing market share for tight oil is climbing as Permian output hit 5.8 mbpd in 2025 and Vaca Muerta grew to 340,000 bpd. Coal-bed methane applications slipped below 8% as gas prices sagged, except in Australia, where proximity to LNG export terminals secures a price uplift.
Saudi Aramco’s Jafurah unconventional program underscores regional divergence: it targets 2 bcf/d shale gas by 2030 for blue hydrogen feedstock. Meanwhile, North American operators intensify tight oil campaigns, extending laterals and compressing cluster spacing to lift recovery. By 2031, tight oil is projected to account for nearly 40% of the hydraulic fracturing market size.
Geography Analysis
North America yielded 67.7% of global hydraulic fracturing market revenue in 2025, underpinned by the United States crude output of 13.2 mbpd and gas production of 103 bcf/d. Canadian activity softened 8% amid sub-CAD 2.50 gas prices, while Mexico’s Burgos pilots lag under regulatory delays. Rig productivity gains let horizontal rig counts drift down to 485, yet still lift output, highlighting technological maturity across the region.
Asia-Pacific is the fastest-growing arena, set for a 10.1% CAGR as China drilled 420 wells in 2025 and lifted shale gas to 24 bcm annually, replacing 18% of pipeline imports. Australia’s coal-bed methane feeds three LNG trains totaling 22 million t, and India’s tendering of Cambay and KG blocks spreads the hydraulic fracturing market to new basins. Regulatory uncertainty around water management remains the leading adoption hurdle in Southeast Asia.
Europe retains comparatively strict policies that cap fracturing, leaving 12 Tcf undeveloped and driving LNG imports that cost nearly double forecast domestic production levels. Poland and Romania completed eight wells in 2025 but face infrastructure and service-sector cost penalties. South America’s growth centers on Argentina, where government price guarantees spur tight oil and shale gas expansion, while Middle East momentum comes from Saudi Aramco’s Jafurah and ADNOC’s Ruwais gas projects targeting 3.5 bcf/d by 2030.

Competitive Landscape
The top five service providers, Halliburton, Schlumberger, Baker Hughes, Liberty Energy, and NexTier, collectively claimed 55% of North American revenue in 2025, translating into a moderately concentrated hydraulic fracturing market. China Oilfield Services and Sinopec Oilfield Service controlled 70% of domestic Chinese contracts through state backing that enabled 20-30% lower bids versus Western peers. Competitive thrust shifted toward technology: Liberty deployed 12 electric fleets in 2025, cutting emissions 60% and attracting 8-10% price premiums.
Strategic moves emphasize vertical integration and digital partnerships. Halliburton and Chevron co-developed fracture systems that trim non-productive time by 15-20% and extend half-length by 18%. Schlumberger secured 340 active patents between 2023 and 2025, covering fiber-optic sensing and autonomous pump control that lock in customers to its platforms. Regional specialists such as ProPetro and STEP Energy Services won share through flexible contracts suiting private-equity E&Ps whose budgets react quickly to price swings. Equipment manufacturers entering turbine-powered fleets promise further disruption, but adoption remains limited to operators with a reliable field gas supply.
Looking forward, first movers in electric fleets, fiber-optic monitoring, and AI optimization may widen pricing power, while laggards face shrinking margins as ESG mandates tighten. Joint-venture requirements across the Middle East and Asia-Pacific continue to encourage local manufacturing, as seen in Baker Hughes’ USD 320 million UAE facility that halves equipment lead times.
Hydraulic Fracturing Industry Leaders
Schlumberger Limited
Baker Hughes Co.
Halliburton Company
Liberty Energy Inc.
NexTier Oilfield Solutions Inc.
- *Disclaimer: Major Players sorted in no particular order

Recent Industry Developments
- February 2026: PT Pertamina (Persero) and Halliburton have signed a memorandum of understanding (MOU) to expedite the implementation of advanced well construction and stimulation technologies in Indonesia. As part of this MOU, the two companies plan to explore opportunities for multi-stage hydraulic fracturing, acid stimulation, advanced cementing services, and the potential use of closed-loop automation and artificial intelligence to enhance drilling and fracturing performance in specific onshore fields.
- June 2025: Chevron U.S.A. and Halliburton developed a closed-loop hydraulic fracturing process that integrates automated stage execution with real-time subsurface feedback. This system enhances energy delivery into wellbores, improves operational consistency, boosts performance, and minimizes human intervention, representing a significant advancement in shale completions technology.
- March 2025: Liberty Energy acquired IMG Energy Solutions to enhance Liberty Power Innovations’ capabilities in engineering design, software, monitoring systems, and distributed power. This acquisition broadens Liberty’s technical portfolio, supporting its hydraulic fracturing services with improved automation, control, and power solutions for completions and remote operations.
- March 2025: Tenaris invested USD 110 million to introduce a third hydraulic fracturing set in Argentina’s Vaca Muerta shale. The new set, consisting of 28 pumps and auxiliary equipment, increases completion capacity and strengthens Tenaris’ position as a leading fracturing services provider in the unconventional oil and gas market of the basin.


Global Hydraulic Fracturing Market Report Scope
The hydraulic fracturing market encompasses the global industry that supplies products, services, and technologies for extracting oil and natural gas from low-permeability formations, including shale and tight reservoirs, using the hydraulic fracturing (fracking) process.
The hydraulic fracturing market report is segmented by well type (horizontal and vertical), fluid type (slick-water, gel-based, foam-based, and hybrid/energized), proppant type (frac sand, resin-coated sand, and ceramic proppants), application (shale gas, tight oil, and coal-bed methane), and geography (North America, Europe, Asia-Pacific, South America, and the Middle East and Africa). The market sizes and forecasts are provided in terms of value (USD).
By Well Type
| Horizontal |
| Vertical |
By Fluid Type
| Slick-water |
| Gel-based |
| Foam-based |
| Hybrid/Energized |
By Proppant Type
| Frac Sand |
| Resin-Coated Sand |
| Ceramic Proppants |
By Application
| Shale Gas |
| Tight Oil |
| Coal-Bed Methane |
By Geography
| North America | United States |
| Canada | |
| Mexico | |
| Europe | Germany |
| United Kingdom | |
| Italy | |
| Russia | |
| Norway | |
| Rest of Europe | |
| Asia-Pacific | China |
| India | |
| South Korea | |
| ASEAN Countries | |
| Australia | |
| Rest of Asia-Pacific | |
| South America | Argentina |
| Brazil | |
| Rest of South America | |
| Middle East and Africa | Saudi Arabia |
| United Arab Emirates | |
| South Africa | |
| Nigeria | |
| Rest of Middle East and Africa |
| By Well Type | Horizontal | |
| Vertical | ||
| By Fluid Type | Slick-water | |
| Gel-based | ||
| Foam-based | ||
| Hybrid/Energized | ||
| By Proppant Type | Frac Sand | |
| Resin-Coated Sand | ||
| Ceramic Proppants | ||
| By Application | Shale Gas | |
| Tight Oil | ||
| Coal-Bed Methane | ||
| By Geography | North America | United States |
| Canada | ||
| Mexico | ||
| Europe | Germany | |
| United Kingdom | ||
| Italy | ||
| Russia | ||
| Norway | ||
| Rest of Europe | ||
| Asia-Pacific | China | |
| India | ||
| South Korea | ||
| ASEAN Countries | ||
| Australia | ||
| Rest of Asia-Pacific | ||
| South America | Argentina | |
| Brazil | ||
| Rest of South America | ||
| Middle East and Africa | Saudi Arabia | |
| United Arab Emirates | ||
| South Africa | ||
| Nigeria | ||
| Rest of Middle East and Africa | ||


Key Questions Answered in the Report
What is the projected value of the hydraulic fracturing market by 2031?
The market is forecast to reach USD 72.14 billion by 2031.
Which region is expected to grow fastest in hydraulic fracturing activity through 2031?
Asia-Pacific is projected to advance at a 10.1% CAGR as China, Australia, and emerging Southeast Asian plays expand.
How dominant are horizontal wells in recent completions?
Horizontal wells held 80.1% share in 2025 and are set to grow 8.4% annually through 2031.
Why are hybrid and energized fluids gaining share?
They improve proppant transport in deeper, high-pressure wells and are expanding at a 9.3% CAGR from 2026-2031.
What technology trend is most reducing completion emissions?
Electric fracturing fleets cut emissions by about 60% and fuel costs up to 40%, driving rapid fleet replacement among major service providers.
Page last updated on:


