
South Africa Lime Market Analysis by Mordor Intelligence
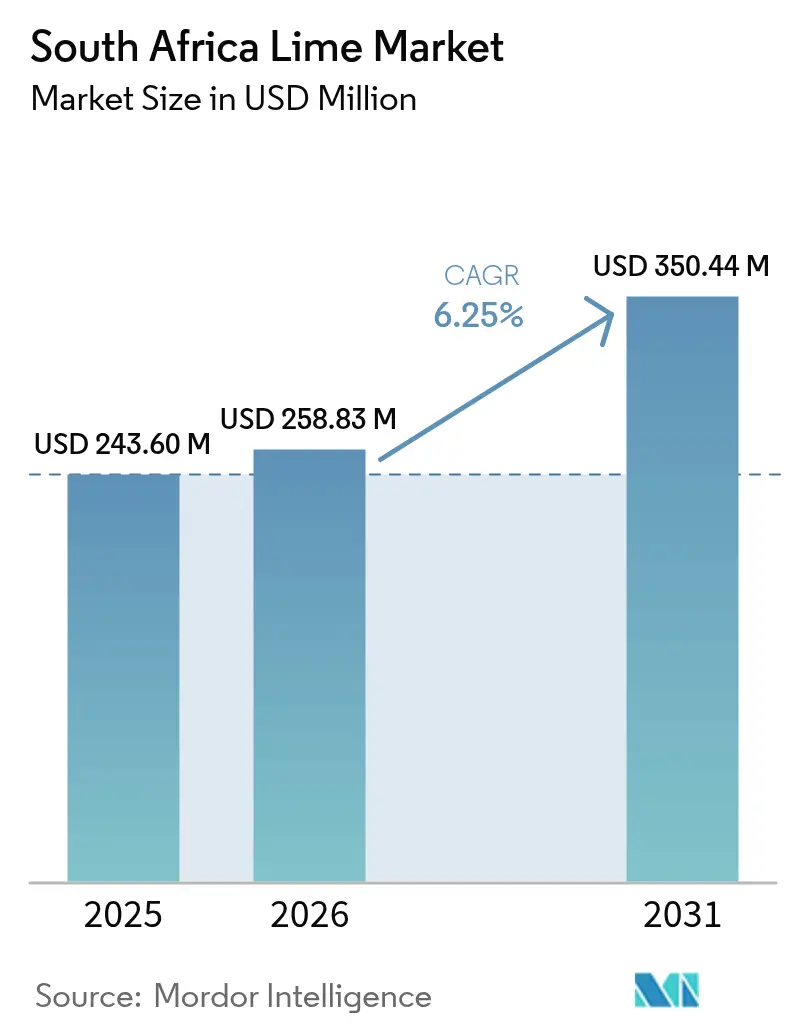
The South Africa lime market size is expected to grow from USD 243.60 million in 2025 to USD 258.83 million in 2026 and is forecast to reach USD 350.44 million by 2031 at 6.25% CAGR over 2026-2031. Growth is anchored by expanding commercial orchards in Limpopo and Mpumalanga, rising counter-seasonal demand from European and Middle Eastern buyers, and a vibrant domestic beverage sector that favors fresh limes for premium cocktails and ready-to-drink infusions. Infrastructure built for South Africa’s broader citrus trade supplies pack-house capacity, cold-chain links, and route-to-market expertise that fresh-lime producers can leverage. Technology adoption, most visibly shade-netting, regenerative cultivation, and integrated pest management, improves yields while supporting the sustainability credentials buyers in export markets increasingly demand. Competitive intensity is rising as large citrus groups widen varietal portfolios and smaller growers upscale to capture niche opportunities in specialty grades and organic-certified fruit.
Key Report Takeaways
- The combined top five exporters controlled just under 50% of export-oriented volume in 2024, indicating moderate concentration.
Note: Market size and forecast figures in this report are generated using Mordor Intelligence’s proprietary estimation framework, updated with the latest available data and insights as of 2026.
South Africa Lime Market Trends and Insights
Drivers Impact Analysis*
| Driver | (~) % Impact on CAGR Forecast | Geographic Relevance | Impact Timeline |
|---|---|---|---|
| Expanding commercial lime orchards in Limpopo & Mpumalanga | +1.8% | Core production provinces | Medium term (2-4 years) |
| Rising European Union & Middle-East export demand | +1.5% | European Union and Middle-East destinations | Short term (≤ 2 years) |
| Growing local beverage & cocktail culture | +1.2% | Urban South Africa | Medium term (2-4 years) |
| Retailer private-label push for fresh citrus | +0.9% | National supermarket chains | Short term (≤ 2 years) |
| Adoption of shade-netting boosting yield & quality | +0.8% | Major grower clusters | Long term (≥ 4 years) |
| Carbon-credit revenues from regenerative lime groves | +0.6% | Early adopters in South Africa | Long term (≥ 4 years) |
| Source: Mordor Intelligence | |||
Expanding Commercial Lime Orchards in Limpopo & Mpumalanga
Commercial lime cultivation is experiencing targeted expansion in South Africa's premier citrus-producing provinces, where established infrastructure and favorable growing conditions support year-round production with peak harvests from January to May. Limpopo province alone accounts for approximately 50% of South Africa's citrus plantings and hosts 42% of national citrus output across 26,960 hectares, providing existing irrigation systems, packhouse facilities, and export logistics that new lime operations can leverage. Mpumalanga’s complementary climate supports both Persian and specialty cultivars, helping the South Africa lime market respond to year-round demand spikes. Carbon-sequestration studies find that well-managed orchards act as net sinks during most of the year, adding sustainability value. Finance access is improving as banks bundle orchard-establishment loans with export contracts, reducing project payback risks which aids the expansion.
Rising European Union & Middle-East Export Demand
According to ITC Trade map, Europe lime imports increased from USD 343,036 thousand to USD 350,428 thousand in 2022-2024. Dutch traders re-export the majority to Germany, France, and the United Kingdom [1]. Brazil and Mexico dominate 90% of the trade, creating seasonal supply gaps that South African fresh lime producers can fill with seedless Persian limes. The counter-seasonal harvest periods align with low Northern Hemisphere production. Middle Eastern importers are increasing their orders due to expanding Gulf foodservice sectors. While phytosanitary compliance costs remain high, existing citrus cold-treatment infrastructure efficiently handles the additional volume rising demand of citrus fruits.
Growing Local Beverage & Cocktail Culture
South Africa’s on-premise and off-premise beverage segments increasingly feature limes in premium mixers, craft gin drinks, and fruit-infused waters. Retail chains such as Shoprite Holdings generated ZAR 200 billion (USD 11 billion) food revenue in 2024 and use fresh-produce differentiation to grow market share. The Sixty60 e-commerce app recorded ZAR 10 billion (USD 550 million) in sales by delivering fresh ingredients within 60 minutes [2]. Such channels expand immediate-use occasions for limes, stimulating steady domestic drawdown alongside export programs.
Retailer Private-Label Push for Fresh Citrus
Major grocers intensify private-label fresh-produce programs to elevate margins and brand equity. Woolworths Foods runs a ZAR 40 billion (USD 2.2 billion) premium food division anchored in traceable supply and GLOBALG.A.P.-certified growers, standards that dovetail with export-market protocols. Suppliers able to guarantee year-round volumes of consistent-grade limes secure multi-season contracts that de-risk orchard investments. The South Africa lime market benefits as supermarkets extend category space and promotional activity timed to local harvesting peaks.
Restraints Impact Analysis*
| Restraint | (~) % Impact on CAGR Forecast | Geographic Relevance | Impact Timeline |
|---|---|---|---|
| Citrus psyllid & greening disease risk | −2.1% | Major lime regions | Long term (≥ 4 years) |
| Farm-gate price volatility vs. input inflation | −1.4% | National | Medium term (2-4 years) |
| Port congestion disrupting cold-chain integrity | −1.0% | Export corridors | Short term (≤ 2 years) |
| Scarcity of phytosanitary-compliant carton suppliers | −0.7% | Export hubs | Medium term (2-4 years) |
| Source: Mordor Intelligence | |||
Citrus Psyllid & Greening Disease Risk
African greening, vectored by Trioza erytreae, compromises fruit size, juiciness, and flavor, rendering limes unmarketable for fresh export. Infestation already spans Limpopo, Mpumalanga, Gauteng, KwaZulu-Natal, and parts of the Cape. Research demonstrates psyllid infection rates track spring flush cycles, necessitating precisely timed insecticide and biological controls. Should Asian citrus psyllid enter via imported ornamentals, disease pressure would escalate further, threatening the long-term growth trajectory of the South Africa lime market.
Scarcity of Phytosanitary-Compliant Carton Suppliers
European Union buyers require specific lime cartons that support cold treatment and end-to-end traceability. During May–September peak, large orange and grapefruit programs consume most certified cartons, leaving lime pack-houses scrambling for supply. Blockchain-ready labels further narrow the vendor pool. Capacity expansions are planned as citrus export targets climb to 260 million cartons by 2032, but short-term shortages constrain the near-term scaling of the South Africa lime market[3].
*Our forecasts treat driver/restraint impacts as directional, not additive. The impact forecasts reflect baseline growth, mix effects, and variable interactions.
Geography Analysis
Lime production clusters around proven citrus belts, with Limpopo contributing more than half of planted area and leveraging integrated irrigation networks that underpin year-round supply reliability. Mpumalanga follows with extensive orchards accessing the N4 export corridor to Maputo Port, a route that shortens transit to Asian destinations by several days. The Western Cape hosts smaller acreages focused on premium organic and niche varieties that benefit from cooler nights that intensify rind color.
Export geography positions the South Africa lime market to capitalize on established citrus channels. The European Union absorbs nearly 37% of South African citrus, a gateway that simplifies phytosanitary compliance as lime producers piggyback on standard operating procedures for oranges and grapefruit. Asia claims 18% and the Middle East 21%, each valuing counter-seasonal supply that avoids competition with Mexico and Brazil. Proposed United States tariffs of 31% could divert volume toward Europe and Asia, and tariff-free access initiatives under the African Continental Free Trade Area open new intra-Africa corridors.
Regional production advantages include year-round harvest capability with peak seasons from January to May that complement Northern Hemisphere production cycles, providing natural market timing benefits for export sales. Research shows 28.2% of growers have introduced drought-tolerant scions, 92.3% adopted integrated pest management, and 78.6% run drip systems, signaling capacity to manage intensifying heat and water scarcity. Public-sector investments in satellite-based pest surveillance and portable cold units further support sustained growth of the South Africa lime market.
Regulatory Landscape
In South Africa, agricultural lime products fall under the Fertilizers, Farm Feeds, Agricultural Remedies and Stock Remedies Act, 1947 (Act No. 36 of 1947) and are administered through the Department of Agriculture, Land Reform and Rural Development (DALRRD) Directorate of Agriculture Inputs Control. Market participation hinges on product registration as a fertilizer and compliance with prescribed label and quality requirements that remain enforceable through inspection and surveillance up to the point of retail sale.
Quality compliance is anchored by defined chemical and physical specifications used for registration and market monitoring, including a minimum Calcium Carbonate Equivalent (CCE) of 70% and fineness thresholds tied to sieve tests. For example, ordinary agricultural lime requires 100% passing a 1.7 mm sieve and at least 50% passing a 0.25 mm sieve, while microfine grades are set to higher fineness. While not lime-specific, the October 2024 publication of amended regulations for agricultural remedies under the same Act underscores active updates to the broader agriculture-input compliance environment that lime suppliers and distributors operate within.
Value Chain Analysis
The South Africa lime value chain starts with limestone and dolomite quarrying and mining, followed by crushing, screening, and grading into registered agricultural lime products that meet Act 36 of 1947 requirements, notably CCE and fineness. A significant portion of supply is delivered through vertically integrated mine-to-customer models, where producers control extraction, processing, quality testing, and dispatch to keep product consistency within regulated specifications.
Downstream, logistics and distribution are central cost and service differentiators because lime is bulky and relatively low value per tonne, which makes proximity to farming belts and efficient transport critical. Suppliers such as Afrimat, KP Lime, Lime-Chem, P&B Lime Works, and Lime Sales Ltd support delivery into diverse end-user regions and crop systems, including orchards and broadacre farming. On-farm service is shaped by soil testing and application practices, where particle size, moisture limits, and incorporation depth influence realized agronomic outcomes.
Market Opportunities and Future Outlook
Supply-chain localization for fresh limes is a visible opportunity lever in South Africa, supported by corporate procurement programs that have moved beyond pilots into measurable output. AB InBev's South African Breweries (SAB) invested in lime farming in northern Limpopo to address local shortages and reduce reliance on imports for beverage use. Reporting around the Moletele Lime Project indicates production is sold predominantly into the local market, which points to a defined offtake channel that can underwrite additional orchard establishment and pack-out capability.
On the agricultural-input side of the market, opportunities concentrate in standardized, compliance-led product positioning and service models rather than branding alone. The Act 36 of 1947 registration regime and its defined minimum CCE and fineness thresholds create whitespace for suppliers that can reliably certify quality, secure compliant packaging, and pair product supply with farm-level soil analysis and correct application guidance, particularly in regions managing soil acidity constraints. Operational bottlenecks in the sector, such as constrained availability of phytosanitary-compliant cartons for export programs during peak citrus packing months, also create room for packaging and traceability solutions aligned with the export cold-chain requirements used across South Africa's broader citrus ecosystem.
Recent Industry Developments
- June 2026: A BBC StoryWorks feature highlighted a South African lime farm model centered on rural economic participation and structured market access for smallholder-linked production. The coverage reinforced the role of community-linked projects and commercial partnerships in scaling dependable local supply for beverage and fresh-use channels.
- July 2025: South African Breweries (SAB) reported updated performance for the Moletele Lime Project in Limpopo, including a harvest of 2.5 million limes and predominantly local sales. The disclosed output and commercialization metrics supported the case for beverage-led localization programs as an anchor buyer pathway for new lime orchards.
- February 2024: SAB confirmed its lime farming investment in northern Limpopo to expand domestic supply and reduce shortages impacting local consumption patterns and brand requirements. The move demonstrated a shift from reliance on imported fruit toward dedicated local sourcing, with implications for grower partnerships, agronomy support, and long-term procurement structures.
Research Methodology Framework and Report Scope
Market Definition and Coverage
For this methodology, the South Africa lime market is treated as the total value of lime fruit supplied for domestic consumption and export, captured through production, trade, and price signals in the country.
Scope exclusions: We exclude lemon and other citrus fruits, and we also exclude industrial lime products such as quicklime, hydrated lime, and hydraulic lime.
Segmentation Overview
- By Geography
- Production Analysis
- Consumption Analysis
- Import Analysis
- Export Analysis
- Price Trend Analysis
Data Sources, Market Sizing, and Validation
Desk Research
Desk work starts by assembling the core supply and demand picture for limes in South Africa, then cleaning the time series so like is compared with like across years. We rely on public agriculture and trade statistics to anchor volumes and direction of change, and we use them to sanity-check whether the market behaves like an agricultural fresh produce category.
Sources used include, such as FAOSTAT for production and harvested area, UN Comtrade and national customs releases for import and export values and volumes, Statistics South Africa and the South African Reserve Bank for macro context and inflation, and agriculture and phytosanitary publications from government departments and industry bodies for crop conditions and export requirements. Company annual reports, investor presentations, and reputable press help us interpret pricing, seasonality, and channel shifts. We also use paid subscriptions for company financial intelligence, shipment-level trade visibility, and patent landscaping when a data gap cannot be closed through public sources. The desk sources listed here are illustrative, and many additional public documents were used for cross-checking and clarification.
Primary Interviews and Surveys
Primary work is used to validate the desk-built model and to pressure test assumptions that are not consistently visible in public data, especially farm-gate versus export pricing spreads and pack-out rates by season. We spoke with growers, exporters, fresh produce traders, and downstream buyers, and inputs were balanced across major producing and consumption hubs. Follow-up calls were used where any number did not reconcile with trade or production signals.
Distribution of primary research fieldwork respondents
| Company type | Respondent position |
|---|---|
| Top tier: 39% | CXOs: 19% |
| Mid tier: 42% | Functional/Unit leaders: 38% |
| Smaller Players: 19% | Managers: 43% |
Market-Sizing & Forecasting
Sizing is built using a top-down flow where production, imports, exports, and price trends are used to reconstruct the value of limes available to the market, and then the results are checked against selective bottom-up approximations. Those bottom-up checks are done through sampled price per kilogram by channel, typical pack-house throughput ranges, and exporter sell-through conversations. This helps adjust for years where volumes move but pricing does not track cleanly.
Key inputs used in the model include harvested area and yield direction, export volume by destination mix, import volumes for off-season balancing, average unit values and local price movements, and observed seasonality patterns that influence pack-out and realized prices. Where a data series breaks or is delayed, we bridge gaps using nearby-period trends and interview-based ranges, and then we flag the sensitivity so it can be reviewed. Forecasting is carried out using scenario analysis supported by simple multivariate relationships, where export demand signals and expected supply expansion are varied within ranges that industry participants considered realistic.
Data Validation & Update Cycle
Results are triangulated by comparing modeled totals against independent signals such as export unit values, production direction, and any major changes in planted area or weather-driven supply outcomes. When a variance looks too large, the assumptions are re-checked, the arithmetic is re-run, and targeted re-contacts are made to confirm whether the shift was real or data-related.
Each report goes through multi-step analyst review before sign-off, including checks for currency consistency, year-to-year jumps, and alignment between volume and value movements. The study is refreshed annually, and we also do interim updates when material events occur, such as sharp price movements, trade disruptions, or major crop issues. Before delivery, a final pass is completed so clients receive the latest updated view based on the most recent information available.
Mordor Intelligence's South Africa Lime Market Size Compared With Other Published Estimates
It is normal to see different market sizes published for the same market because groups often mix up product scope, use different base years, and apply different price points or currency timing. In this category, differences also show up when sources treat exports as part of the market value versus focusing only on domestic consumption.
The table shows a wide spread largely because some estimates blend lime fruit with industrial lime categories or apply broad end-use segmentation that does not match an agriculture trade-flow model. In Mordor Intelligence's model, only lime fruit value tied to production, consumption, and import-export flows is counted, with price trends used to align value across years.
Benchmark comparison
| Source | Market Size | Gaps in Research Methodology |
|---|---|---|
| Mordor Intelligence | USD 243.60 M (2025) | |
| Syndicated Publisher A | USD 223.25 M (2024) | Uses an earlier base year and can land on a lower value if pricing is captured at a different point in the season and export unit values are averaged differently across destinations. |
| Industry Research Group B | USD 0.90 B (2023) | Likely includes industrial lime products and related end uses (such as construction and mining), which inflates the total versus a fruit-only market built from crop and trade flows. |
Taken together, the comparison suggests the biggest drivers are scope boundaries and how value is translated from volumes using prices and currency timing. Our approach stays repeatable because each step ties back to observable production and trade signals, and then the few softer inputs are validated directly with market participants before finalizing totals.
Key Questions Answered in the Report
How large is the South Africa lime market in 2026?
The South Africa lime market size reached USD 258.83 million in 2026 and is set to grow to USD 350.44 million by 2031.
What is the projected growth rate through 2031?
The market is forecast to expand at a steady 6.25% CAGR over the 2026-2031 period.
What is the main biological threat to lime orchards?
African citrus greening spread by Trioza erytreae is the principal disease threat, capable of reducing fruit quality below export standards.
How are growers improving resilience to climate risks?
Adoption of shade-netting, regenerative soil practices, and drought-tolerant scions is rising, supported by integrated pest management programs.