Market Overview
| Study Period | 2020 - 2031 |
|---|---|
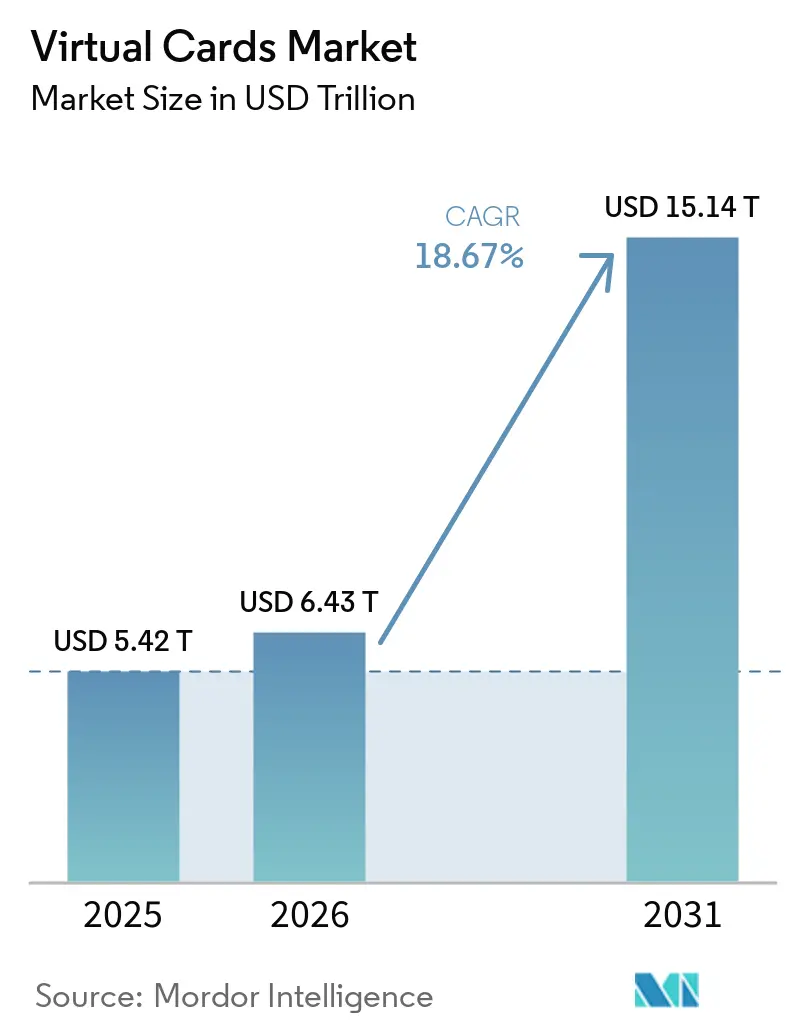
| Market Size (2026) | USD 6.43 Trillion |
| Market Size (2031) | USD 15.14 Trillion |
| Growth Rate (2026 - 2031) | 18.67% CAGR |
| Fastest Growing Market | Asia-Pacific |
| Largest Market | North America |
| Market Concentration | Medium |
Major Players *Disclaimer: Major Players sorted in no particular order Image © Mordor Intelligence. Reuse requires attribution under CC BY 4.0. | |
Virtual Cards Market Analysis by Mordor Intelligence
The Virtual Cards Market size is projected to expand from USD 5.42 trillion in 2025 and USD 6.43 trillion in 2026 to USD 15.14 trillion by 2031, registering a CAGR of 18.67% between 2026 to 2031.
The convergence of payments and software is driving this rapid expansion, as virtual cards increasingly deliver programmable, API-driven payment experiences. Advances in tokenization are improving transaction security and authorization rates while significantly reducing fraud across digital and in-app commerce channels. At the same time, open banking frameworks are enabling faster, more seamless funding and settlement processes by standardizing data access through APIs. Enterprise treasurers are accelerating adoption as virtual cards offer automated reconciliation, tighter spend controls, and measurable working capital efficiencies. These benefits are driving a structural shift in B2B payments away from checks and other paper-based methods toward card rails. Payment networks are also expanding tokenization and virtual card capabilities across e-commerce and embedded finance use cases, broadening acceptance. Regulatory momentum, including Canada’s Consumer-Driven Banking Act implementation beginning in 2026, is also standardizing API-based data sharing that supports virtual card funding and orchestration.[1]Source: Department of Finance Canada Staff, “Canada’s Framework for Consumer-Driven Banking,” Government of Canada, canada.ca.
Key Report Takeaways
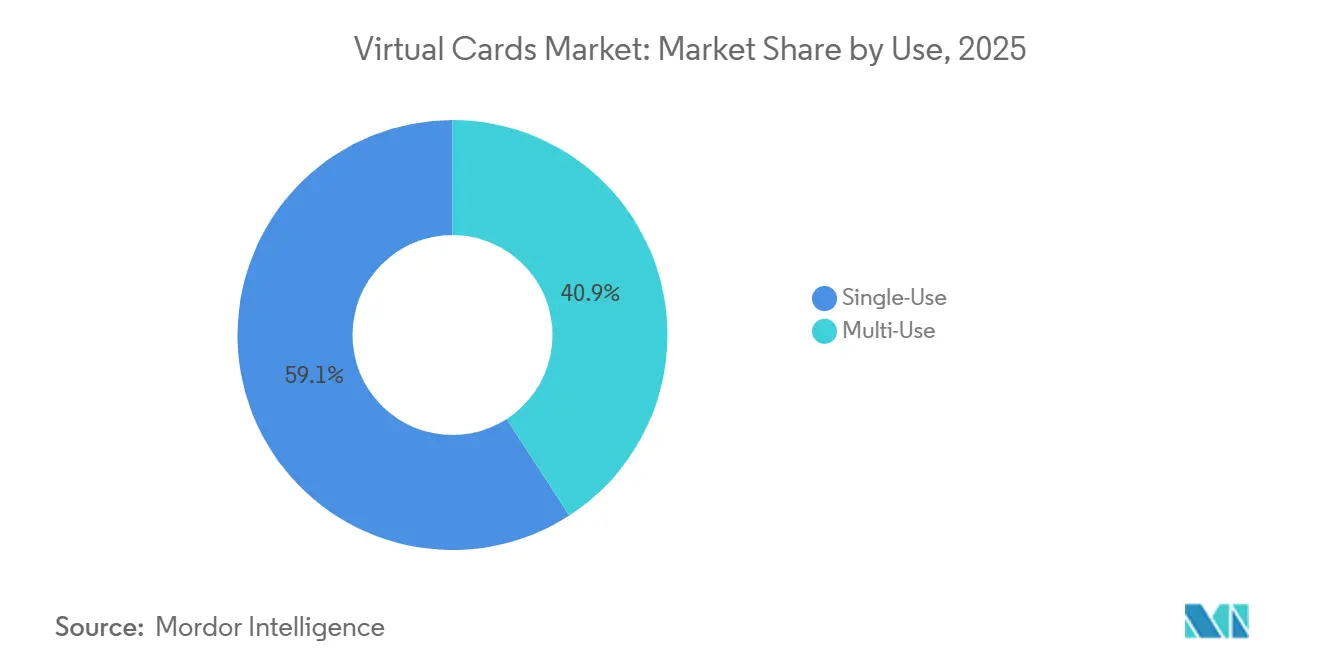
- By use, single-use virtual cards led with 59.13% of the virtual cards market share in 2025 and are projected to expand at a 20.03% CAGR through 2031.
- By payment type, remote payments accounted for 73.64% of the virtual cards market share in 2025, while POS payments are forecast to grow at a 21.22% CAGR through 2031.
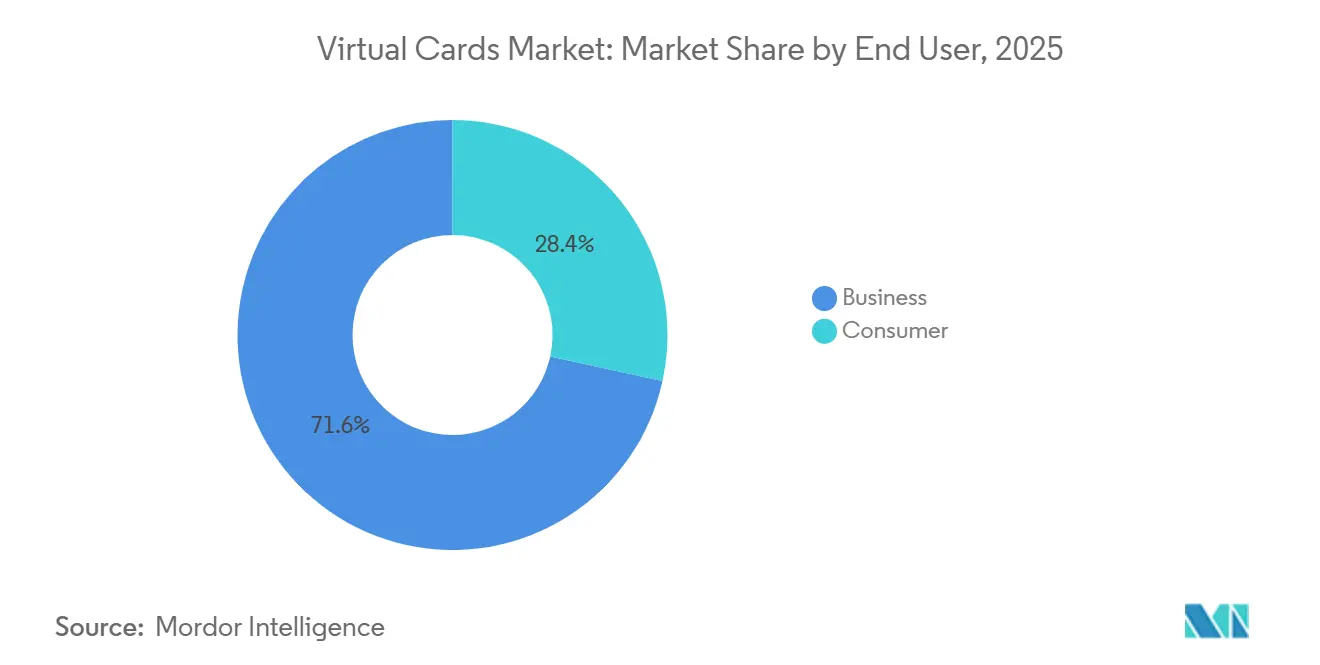
- By end user, business accounts held 71.57% of the virtual cards market share in 2025 and are projected to grow at a 22.11% CAGR through 2031.
- By card type, virtual credit cards captured 47.36% of the virtual cards market share in 2025, while virtual prepaid cards are projected to grow at a 21.39% CAGR through 2031.
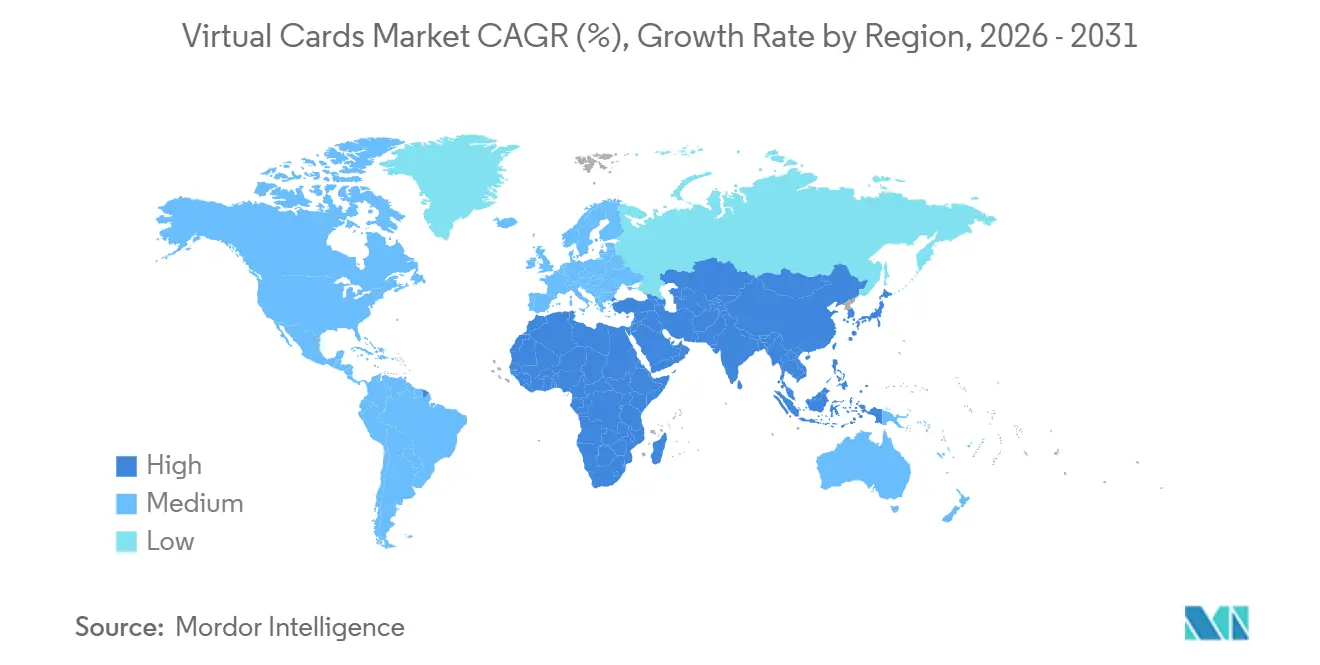
- By geography, North America led with 38.74% of the virtual cards market share in 2025, and Asia-Pacific is projected to post the fastest 23.44% CAGR through 2031.
Note: Market size and forecast figures in this report are generated using Mordor Intelligence’s proprietary estimation framework, updated with the latest available data and insights as of January 2026.
Global Virtual Cards Market Trends and Insights
Drivers Impact Analysis*
| Driver | (~) % Impact on CAGR Forecast | Geographic Relevance | Impact Timeline |
|---|---|---|---|
| Accelerating B2B adoption of virtual cards for accounts payable automation | +4.2% | Global, with early gains in North America, Western Europe, and Australia | Medium term (2-4 years) |
| Rapid growth in e-commerce and digital commerce channels | +3.8% | Global, concentrated in APAC (China, India, Southeast Asia), North America, and the EU | Short term (≤ 2 years) |
| Government and regulatory initiatives promoting cash-lite economies and open banking frameworks | +3.1% | EU, UK, Canada, India, Brazil | Long term (≥ 4 years) |
| Enhanced fraud prevention and security features compared with physical cards | +2.9% | Global, heightened relevance in high-fraud jurisdictions | Short term (≤ 2 years) |
| Expansion of embedded finance APIs that integrate virtual cards directly into SaaS and enterprise platforms | +2.5% | North America, Europe, nascent in APAC and Latin America | Medium term (2-4 years) |
| Advances in tokenization that enable machine-to-machine and IoT-based payments | +2.2% | Pilot markets in the EU, UAE, Singapore, and South Korea | Long term (≥ 4 years) |
| Source: Mordor Intelligence | |||
Accelerating B2B adoption of virtual cards for accounts payable automation
Finance leaders are moving payables from paper checks and manual ACH into virtual card workflows that integrate directly with ERP and AP automation, which shortens cycle times and supports interchange-funded rebates. In March 2025, an American Express survey of senior executives reported that 83% considered automated invoicing and payment processing important for supplier relationships, and 77% linked payments innovation to business growth[2]Source: American Express Team, “How Automation Can Help Transform B2B Payments,” American Express Business Insights, americanexpress.com. Platforms and networks are meeting this demand as Mastercard continues to expand virtual card enablement across leading procure-to-pay ecosystems. Oracle Fusion Cloud ERP users can now provision virtual cards natively through recent product integrations, which removes middleware steps for AP teams. Mid-sized and large enterprises are also signaling stronger working capital adoption of corporate and virtual cards in survey data that Visa published across global CFO and treasurer cohorts.
Rapid growth in e-commerce and digital commerce channels
Digital commerce is lifting remote and in-app transactions, with companies reporting higher usage of tokenized credentials provisioned into mobile wallets and merchant apps. Central bank statistics confirm that, in the first half of 2025, Finland recorded 1.2 billion card payments worth EUR 36.9 billion (USD 38.2 billion), reflecting strong growth in digital payment activity. Payments made via mobile applications accounted for 334 million transactions valued at EUR 8.1 billion (USD 8.4 billion), while virtual terminals represented 21 % of total card payment value, EUR 7.8 billion (USD 8.1 billion), up from 16 % three years earlier. This shift toward mobile and virtual payment channels highlights rising adoption of digital and card-not-present transactions, supporting demand for virtual card solutions[3]Source: Bank of Finland Staff, “Card Payments Increasingly Made via Virtual Terminals and Mobile Applications,” Suomen Pankki, suomenpankki.fi. Wallet-centric models are also broadening cross-border access through virtual card issuance, including a program expansion allowing Orange Money customers to pay online across the Visa network. Networks are standardizing digital wallet launches and wallet tokenization at the point of provisioning, which supports tap-to-pay and card-not-present approvals with higher security. As tokenization reaches broader coverage, virtual cards continue to anchor merchant acceptance for e-commerce and in-app use cases.
Government and regulatory initiatives promoting cash-lite economies and open banking framework
Regulators are using open banking and instant payments to reduce cash reliance and improve access to digital rails, which indirectly supports virtual card issuance and funding. Canada’s Consumer-Driven Banking Act enters implementation in 2026, mandating API-based data sharing across core financial products and defining liability and technical standards that simplify third-party connectivity[4]Source: Department of Finance Canada Staff, “Canada’s Framework for Consumer-Driven Banking,” Government of Canada, canada.ca. Brazil’s Pix system scaled real-time payments to billions of monthly transactions and continues to set merchant pricing well below card interchange, which pushes domestic transactions to A2A while preserving a role for cards in cross-border and wallet-funded purchases. The National Bank of Ethiopia’s 2026–2030 digital payments strategy mandates tokenization and security controls for online card payments, establishing a path for virtual credentials to serve as a secure bridge in low-banked markets. Europe’s ongoing payments reforms and card tokenization initiatives signal continued alignment toward digital authentication and data standards that benefit virtual card orchestration over the medium term.
Enhanced fraud prevention and security features compared with physical cards
Virtual cards enable granular controls that lower fraud exposure, including single-use numbers, merchant locking, spend limits, time windows, and dynamic credentials. Providers report extremely low gross fraud rates in virtual card programs, with internal data points indicating materially lower fraud than legacy card rails when vendor-locking and tokenization are configured[5]Source: WEX Editorial, “Reduce Fraud with Virtual Card Payments,” WEX Insights, wexinc.com. Network tokenization is also scaling across devices and channels, with Mastercard reporting rapid progress and targeting complete tokenization of e-commerce flows by 2030. As tokens increasingly replace primary account numbers in transit and at rest, merchants benefit from better approval rates and reduced exposure to credential theft. Combined with automated reconciliation of line-item data in AP platforms, virtual cards reduce manual intervention and improve financial controls in complex payables environments.
Restraints Impact Analysis*
| Restraint | (~) % Impact on CAGR Forecast | Geographic Relevance | Impact Timeline |
|---|---|---|---|
| Gaps in supplier acceptance and concerns over interchange costs | -3.4% | Global, acute in mid-market and SMB segments across all regions | Short term (≤ 2 years) |
| Complexity related to system connectivity and ERP integration | -2.1% | North America, Europe, and less pronounced in APAC, where greenfield deployments bypass legacy systems | Medium term (2-4 years) |
| Constraints in cross-border acceptance and settlement networks | -1.8% | Emerging markets in Sub-Saharan Africa, parts of Latin America, and Central Asia | Medium term (2-4 years) |
| The expansion of instant payment and account-to-account rails | -1.5% | Brazil, India, the EU, Middle East | Long term (≥ 4 years) |
| Source: Mordor Intelligence | |||
Gaps in supplier acceptance and concerns over interchange costs
Acceptance friction remains a hurdle where suppliers resist card fees on large-ticket invoices and prefer lower-cost domestic A2A rails. Surveys of finance leaders highlight operational pain points around remittance data ingestion, invoice matching, and manual workflows when handling emailed or portal-based virtual card details. Supplier education on interchange programs and large-ticket pricing can improve acceptance when the total cost of payment is weighed against speed, certainty, and data benefits. Platforms are countering objections by embedding straight-through processing that maps Level III data into ERP systems, which reduces reconciliation time for supplier AR teams. Network programs that target B2B supplier onboarding and automated acceptance continue to expand, but broad-based adoption depends on clearer ROI for suppliers and simpler data flows.
Complexity related to system connectivity and ERP integration
Real-time systems that settle in seconds at lower cost are eroding domestic card volumes in bill pay, P2P, and low-value merchant transactions. As merchants enable instant pay buttons and QR acceptance, card-on-file and CNP transactions face substitution pressure in markets where regulators cap fees and mandate parity pricing for instant transfers. Virtual cards retain advantages in cross-border corridors, fragmented supplier ecosystems, and cases needing granular spend controls that A2A rails do not natively provide. Networks and issuers are responding with tokenization, improved authentication, and embedded capabilities in software that keep virtual credentials at the top of digital wallets and checkout flows. The near-term impact is mixed by country, but the long-term path features hybrid models that route domestic low-cost flows over instant rails while preserving virtual card utility for international and high-control transactions.
*Our forecasts treat driver/restraint impacts as directional, not additive. The impact forecasts reflect baseline growth, mix effects, and variable interactions.
Segment Analysis
By Use: Single-Use Credentials Drive Security-First Adoption
Single-use virtual cards commanded 59.13% share in 2025 and are projected to grow at a 20.03% CAGR through 2031, reflecting a security-first preference for ephemeral credentials in AP and travel payments, and this profile is a material driver of the virtual cards market. Single-use credentials simplify approval policies and vendor-locking, which reduces the risk of compromised numbers and makes out-of-policy spend easier to block at authorization. Online travel agencies use single-use virtual card numbers for supplier prepayments and settlement, which enhances reconciliation and reduces exposure if bookings are amended. Networks are also scaling issuer participation in virtual card programs for travel and lodging, which supports wider supplier acceptance and automated matching of detailed line items. As tokenization scales across e-commerce, the operational gap between single-use and multi-use narrows, but single-use remains the default for high-risk transactions in the virtual cards market.
Multi-use virtual cards serve recurring suppliers, subscriptions, and managed expense programs where persistent credentials reduce re-issuance overhead, though they grew more slowly than single-use variants. Recent ERP-native integrations, including Oracle Fusion Cloud ERP connectivity, are lowering deployment friction and enabling real-time policy controls across multi-use portfolios. Providers are adding PIN controls and enhanced merchant controls for international point-of-sale and online transactions to reduce fraud risk on persistent credentials. The combined effect improves the operational case for multi-use in categories like SaaS, cloud infrastructure, and logistics, where recurring billing dominates. Over time, near-ubiquitous tokenization can further close the security gap as multi-use tokens refresh dynamically, which supports broader adoption without sacrificing control.


By Payment Type: Remote Dominates, but POS Surges via Mobile Wallets
Remote payments held a 73.64% share in 2025, with e-commerce and in-app transactions capturing a rising share of card value, and this behavior is visible in payments data published by national banks that track channel mix in the virtual cards market. The Bank of Finland reported that card payments initiated via mobile applications rose in H1 2025, and virtual terminals captured a larger share of value compared to prior years. Networks and issuers are provisioning virtual credentials into digital wallets at scale, which supports tap-to-pay growth in retail and streamlines e-commerce checkouts. Tokenization and network-managed credentials reduce false declines and fraud by replacing primary account numbers in transit and at rest during remote payments. As a result, remote use cases continue to anchor growth while in-person contactless rises from a lower base in the virtual cards market.
Point-of-sale usage is projected to grow at a 21.22% CAGR through 2031 as contactless acceptance nears ubiquity and more wallets support in-store provisioning of virtual credentials. European markets demonstrate the acceleration as networks report strong contactless penetration, with wallet launches enabling consumers to tap their phones or wearables for in-store payments. Brazil’s Pix rail is capturing domestic A2A payments at scale, which adds competition at POS while virtual cards continue to serve international and wallet-funded use cases in the region. Hybrid flows are emerging where domestic instant payment rails handle small-value transactions, while virtual card tokens remain the preferred method in cross-border, travel, and controlled-spend scenarios. This dual-track evolution supports sustained growth across both channels as acceptance and wallet integration expand.
By End User: Business Segment Commands Share and Growth
Business accounts held 71.57% of the virtual cards market share in 2025 and are projected to grow at a 22.11% CAGR through 2031, reflecting enterprise focus on payables automation and working capital. Senior executives have prioritized automation and innovative payment methods to strengthen supplier relationships and drive growth, which aligns with a broader shift to digital AP. Issuers and platforms report that rebates funded by interchange meaningfully offset program costs, which strengthens the business case for card-based procurement. CFO and treasurer surveys also find increasing use of corporate and virtual cards to manage working capital in mid-market and large enterprises. Together, these factors sustain a leadership position for B2B users across geographies in the virtual cards market.
Consumer adoption trails in relative share but is gaining momentum where issuers tie virtual cards to digital wallets, loyalty programs, and flexible checkout experiences. Wallet-based issuance reduces friction by making virtual credentials the default for mobile checkouts and subscription management. As Gen Z and mobile-first users increase wallet usage frequency, retail virtual card volumes are expected to rise, especially for in-app and contactless use. Cross-border e-commerce and travel purchases also reinforce virtual card value for consumers where domestic instant payment options are not interoperable internationally. These dynamics point to continued growth on the consumer side while businesses remain the primary driver of value in the virtual cards market.
By Card Type: Credit Leads, Prepaid Gains via Gig Economy, and Benefits
Virtual credit cards captured a 47.36% share in 2025, with enterprise users prioritizing float and program rebates that strengthen treasury outcomes and reinforce card-based procurement, which supports scale in the virtual cards market size for B2B categories. Rebates help convert spend into a measurable offset against program costs, which maintains the appeal of revolving credit in corporate payables. Credit-led adoption is also supported by wide issuer participation across networks and embedded issuance through software platforms. Tokenization further improves approval rates and reduces fraud exposure for credit programs at scale. This combination of interchange economics, funding flexibility, and security keeps credit formats in a leadership position as enterprises expand virtual card programs.
Prepaid is projected to have the steepest growth at a 21.39% CAGR through 2031 as use cases expand across gig disbursements, regulated benefits, and wallet-funded purchases where bank accounts are not required. Retail issuers are deploying single-use virtual cards for installment offers at checkout, which behave like tokenized prepaid instruments with spend restrictions at approved merchants. Software-led distribution, including travel and procurement platforms, is catalyzing multi-currency issuance across regions that need controlled spend and instant credential delivery. Debit-based virtual cards continue to serve expense management and budgeting use cases where credit is unnecessary, while flexible credential products allow users to route different funding sources behind a single token. Over time, tokenization and wallet adoption support broader usage across all three card types, with routing chosen to match user preferences and merchant acceptance in the virtual cards industry.
Geography Analysis
North America led with a 38.74% share in 2025, supported by a mature commercial card infrastructure, strong adoption of AP automation, and a large enterprise base that values rebates and working capital benefits in the virtual cards market. Canada enters 2026 with an open banking implementation framework that formalizes API-based data sharing, liability, and technical standards, and this reduces connectivity friction for virtual card funding and reconciliation. Issuers and platforms are also integrating with ERP systems and procurement software to bring virtual card issuance into native workflows for corporate finance teams. Growth corporates in the region are using cards more frequently for unplanned working capital needs, as captured in Visa’s research across CFOs and treasurers. Together, these conditions strengthen share retention and support continued expansion across B2B and consumer use cases in the virtual cards market.
Asia-Pacific is projected to post the fastest 23.44% CAGR to 2031 as cash-lite programs, super-app ecosystems, and wallet-led checkouts normalize tokenized credentials across channels in the virtual cards market. Regional initiatives that emphasize instant payments and digital identity are increasing the utility of wallets, while virtual cards backstop cross-border purchases where domestic instant rails do not interoperate. Issuers and platforms are also expanding into APAC to capture growth in B2B and travel categories, supported by vendor partnerships that embed card creation into software. Cross-regional efforts that link wallets to global networks are broadening access for consumers and SMBs, including partnerships designed to allow online shopping across international merchants. These factors position Asia-Pacific to add share as deployments scale and digital credentials become the default in mobile-first markets, which further enlarges the virtual cards market.
Europe continues to expand on the back of regulatory convergence and strong contactless habits, with networks reporting broad wallet launches and high in-person tap rates that lift POS usage alongside e-commerce in the virtual cards market. Tokenization initiatives are improving approval rates and reducing online fraud, and the region is investing in data center capacity and digital infrastructure for payments resilience. In parallel, regulators are moving toward harmonized rules on instant payments and API access, which complements the adoption of virtual cards by creating interoperability and clear liability regimes. These steps encourage issuers, acquirers, and software vendors to build to common standards that simplify deployment across multiple markets in the region. As the regulatory and technology foundations mature, Europe remains a core demand center with balanced growth across B2B and consumer use cases in the virtual cards market.

Competitive Landscape
The Virtual Cards Market shows a moderately fragmented competitive structure in which leading payment networks exert influence, but value creation is spread across issuers, processors, banks, and embedded finance platforms. Competition increasingly spans networks, issuer-processors, financial institutions, and fintechs as these players converge on embedded issuance, orchestration, and data-rich reconciliation capabilities. Visa is advancing its Intelligent Commerce initiative, highlighting secure agent-driven transaction flows that are expected to support broader commercialization in the near term. Mastercard continues to expand virtual card enablement while investing in tokenization, wallet provisioning, and developer platforms to simplify issuance for software vendors. Together, these initiatives signal a shift from passive network roles toward active orchestration of embedded credentials across travel, procurement, and digital commerce.
Virtual Cards Market participants among issuer-processors and vertical specialists are scaling through partnerships and targeted acquisitions to broaden geographic reach and product depth. WEX and Sabre have introduced embedded virtual card capabilities for travel agency workflows, addressing long-standing challenges in reconciliation and cross-border settlement. Worldline and Visa have also collaborated on a virtual card issuing solution for online travel agencies that combines issuing and acceptance strengths. Banks and regional leaders are piloting ERP-embedded issuance to integrate virtual cards directly into corporate payment workflows. These deployments highlight how distribution through vertical software platforms accelerates adoption in specialized use cases.
The Virtual Cards Market growth is further supported by fintech platforms that are expanding embedded issuance and enterprise connectivity to reduce integration complexity. Brex has integrated with Oracle Fusion Cloud ERP to enable accounts payable teams to issue virtual credentials directly within existing systems. Stripe continues to scale issuing capabilities that allow businesses to create and manage cards natively inside their own applications. PayPal has refreshed its offering in select markets with virtual and physical cards linked to loyalty features that enhance consumer engagement across channels. Collectively, these strategies reflect a broader shift toward simple APIs, wallet-native credentials, and embedded compliance aligned with modern software deployment models.
Virtual Cards Industry Leaders
American Express Company
JPMorgan Chase & Co.
Mastercard Incorporated
Visa Inc.
Marqeta Inc.
- *Disclaimer: Major Players sorted in no particular order

Recent Industry Developments
- December 2025: Orange Money Group and Visa announced a strategic partnership to roll out virtual card capabilities for up to 49 million active users across select African and Middle Eastern markets, enabling online purchases on local and international websites.
- November 2025: PayPal relaunched its UK market presence with a comprehensive suite including virtual and physical PayPal Credit cards, a new PayPal+ loyalty program offering cashback and purchase protections, and a standalone debit card, targeting 6 million UK consumers and aiming to recapture share from incumbent digital wallets.
- June 2025: WEX partnered with Sabre Direct Pay to embed its virtual card payment technology across 210 countries and 20 currencies, targeting travel agencies, tour operators, and corporate travel managers with real-time virtual card generation and Level III data for automated reconciliation.
- May 2025: First Abu Dhabi Bank (FAB) piloted the Oracle-Mastercard virtual card solution for B2B finance and payments, becoming the first MENA institution to embed virtual card issuance directly into Oracle Fusion Cloud ERP workflows.


Research Methodology Framework and Report Scope
Market Definitions and Key Coverage
Our study defines the virtual cards market as the total transaction face value of single-use and multi-use digital card credentials, issued by licensed banks or fintech processors, that are provisioned through tokenization and used for remote or point-of-sale payments by consumers and businesses worldwide.
Scope Exclusions: Physical plastic cards, standalone mobile wallets without card credentials, and crypto-only payment tokens are not counted.
Segmentation Overview
- By Use
- Single-Use
- Multi-Use
- By Payment Type
- Remote Payments
- POS Payments
- By End User
- Consumer
- Business
- By Card Type
- Virtual Debit Card
- Virtual Credit Card
- Virtual Prepaid Card
- By Region
- North America
- United States
- Canada
- Mexico
- South America
- Brazil
- Argentina
- Chile
- Peru
- Rest of South America
- Europe
- United Kingdom
- Germany
- France
- Spain
- Italy
- Benelux (Belgium, Netherlands, and Luxembourg)
- Nordics (Sweden, Norway, Denmark, Finland, and Iceland)
- Rest of Europe
- Asia-Pacific
- China
- India
- Japan
- South Korea
- Australia
- South-East Asia (Singapore, Indonesia, Malaysia, Thailand, Vietnam, and Philippines)
- Rest of Asia-Pacific
- Middle East and Africa
- United Arab Emirates
- Saudi Arabia
- South Africa
- Nigeria
- Rest of Middle East and Africa
- North America
Detailed Research Methodology and Data Validation
Primary Research
Mordor analysts held structured interviews and short surveys with global card networks, issuing banks, SME treasurers, travel-agency platforms, and accounts-payable software vendors across North America, Europe, Asia-Pacific, and Latin America. These conversations tested preliminary penetration rates, refined average ticket values for B2B and consumer use cases, and clarified regulatory timelines influencing adoption.
Desk Research
We began with wide-ranging desk work that pulled annual transaction data, card issuance volumes, and interchange rules from sources such as the Bank for International Settlements, the European Central Bank's Statistical Data Warehouse, the U.S. Federal Reserve Payments Study, and regional payment associations. Company filings, investor decks, and select articles in peer-reviewed journals supplied benchmarks on average spend per virtual card. Our team also mined proprietary dashboards from D&B Hoovers and Dow Jones Factiva for issuer revenue splits and new contract wins. Because reliable public figures on virtual card chargeback ratios or cross-border share are scarce, these were gathered primarily through the expert interviews noted below. The secondary source list is illustrative; many additional materials informed the analysis and validation stages.
Market-Sizing & Forecasting
A top-down reconstruction of total spend used central-bank payment totals and virtual-card penetration ratios by region, which are then cross-checked with sampled bottom-up rollups of issuer statements and gateway API call volumes. Key model inputs include: 1) number of active virtual accounts, 2) average tickets by use case, 3) share of online retail sales paid by virtual cards, 4) B2B accounts-payable automation growth, and 5) regulatory mandates such as PSD3 strong-customer-authentication deadlines. Forecasts through 2030 rely on a multivariate regression that links penetration to e-commerce value, smartphone subscriptions, and real-time payments coverage, with scenario adjustments vetted by primary experts. Gaps in issuer disclosures are bridged by applying regional interchange spreads to observed spend bands.
Data Validation & Update Cycle
Before sign-off, outputs pass a three-layer analyst review that flags anomalies versus independent payment indicators and triggers re-contact of sources when needed. The model is refreshed annually, and interim updates follow any material regulatory or macro payment shock. A final quick review is completed immediately prior to client delivery.
Why Mordor's Virtual Cards Baseline Earns Decision-Maker Trust
Published numbers differ because firms pick unlike scopes, base years, and spend versus revenue lenses.
Our disciplined choice to measure the market in transaction value, align definitions to central-bank taxonomies, and refresh data each year yields a dependable anchor.
Benchmark comparison
| Market Size | Anonymized source | Primary gap driver |
|---|---|---|
| USD 5.42 trillion (2025) | Mordor Intelligence | - |
| USD 19.02 billion (2024) | Global Consultancy A | Counts issuer revenue only; excludes B2B payables and face-value spend. |
| USD 494.57 billion (2024) | Trade Journal B | Omits POS virtual payments and applies conservative ticket assumptions. |
| USD 415.14 billion (2023) | Industry Association C | Uses mixed currency year averages and infrequent data refresh. |
In short, while others narrow the lens or rely on episodic updates, our balanced, transparent approach, rooted in authoritative transaction statistics and routinely validated with industry practitioners, delivers the clearest, most actionable baseline for planning.


Key Questions Answered in the Report
What is the current size and growth outlook for the virtual cards market?
The global virtual cards market size reached USD 6.43 trillion in 2026 and is projected to reach USD 15.14 trillion by 2031 at a CAGR of 18.67%, supported by tokenization, embedded finance, and AP automation.
Which use category is growing fastest within virtual cards?
Single-use credentials led with 59.13% share in 2025 and are projected to grow at a 20.03% CAGR through 2031 as enterprises emphasize vendor-locking and fraud controls in supplier and travel payments.
How are instant payment rails impacting virtual card adoption?
Real-time systems like Pix are shifting domestic low-cost flows to A2A, while virtual cards retain advantages in cross-border transactions and controlled-spend use cases that require merchant locking and tokenization.
Which regions will drive the next wave of growth for virtual cards?
Asia-Pacific is projected to post the fastest 23.44% CAGR through 2031 as cash-lite agendas, super-apps, and wallet-first behaviors make virtual credentials the default, particularly for e-commerce and travel.
What are the main operational barriers to supplier acceptance of virtual cards?
Suppliers cite fee sensitivity and manual steps for remittance data ingestion and reconciliation, though ERP-native integrations and automated Level III data mapping are easing onboarding.
Page last updated on:


