Market Overview
| Study Period | 2020 - 2031 |
|---|---|
| Forecast Data Period | 2026 - 2031 |
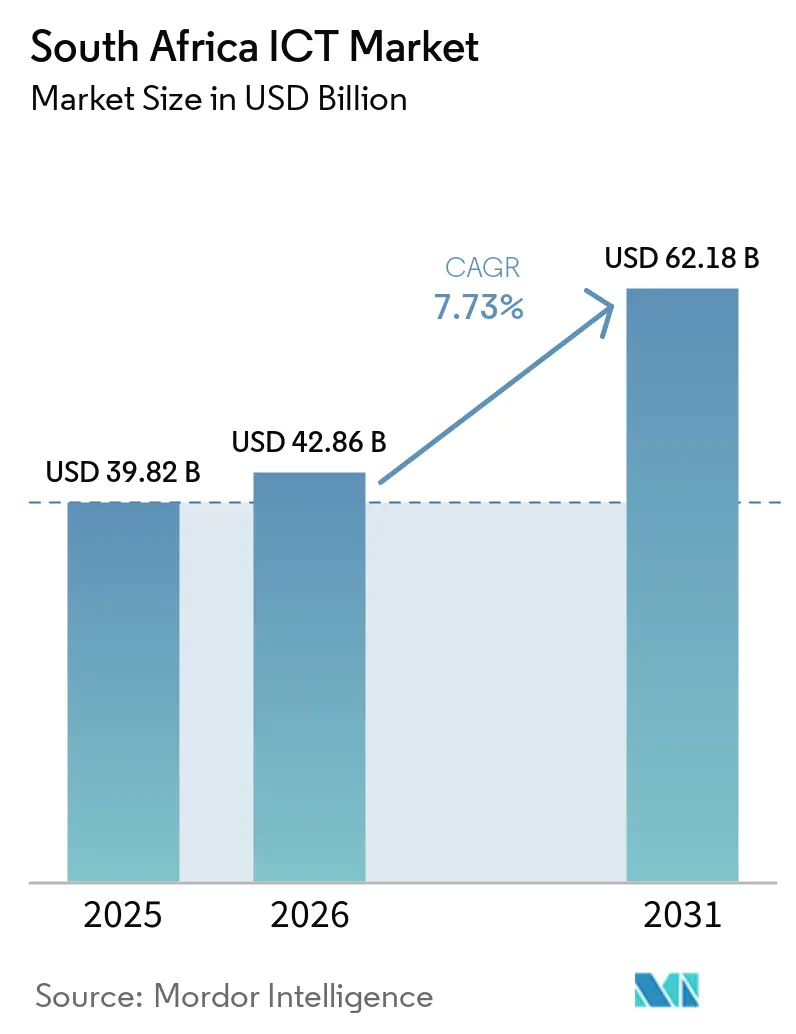
| Base Year Market Size (2025) | USD 39.82 Billion |
| Market Size (2026) | USD 42.86 Billion |
| Market Size (2031) | USD 62.18 Billion |
| Growth Rate (2026 - 2031) | 7.73% CAGR |
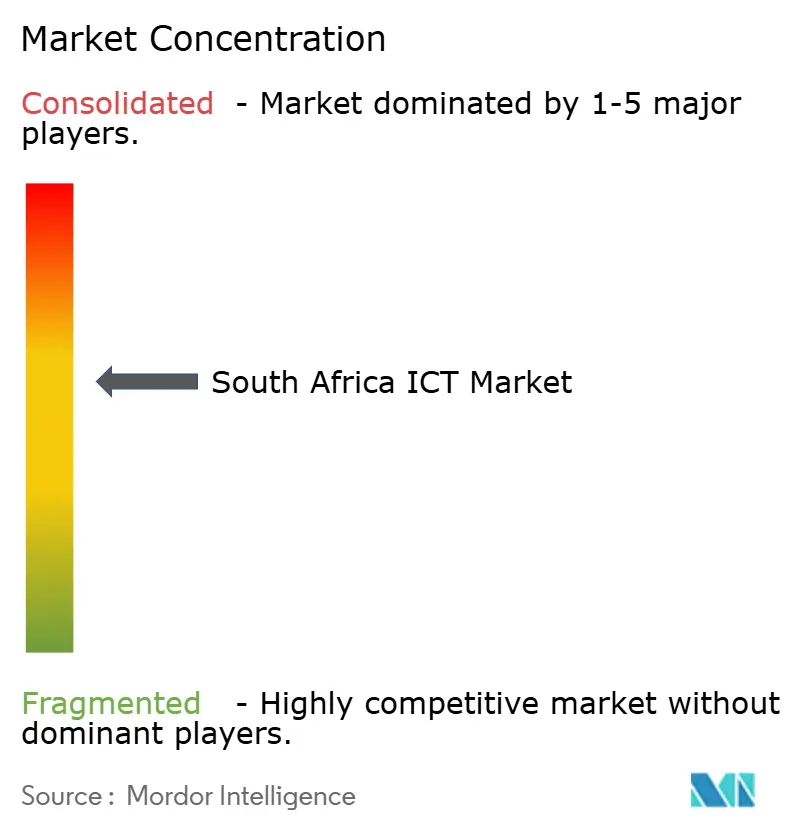
| Market Concentration | Medium |
Major Players
*Disclaimer: Major Players sorted in no particular order Image © Mordor Intelligence. Reuse requires attribution under CC BY 4.0. |
|
South Africa ICT Market Analysis by Mordor Intelligence
The South Africa ICT Market size was valued at USD 39.82 billion in 2025 and is estimated to grow from USD 42.86 billion in 2026 to reach USD 62.18 billion by 2031, at a CAGR of 7.73% during the forecast period (2026-2031). Digital infrastructure has shifted from discretionary spend to strategic insulation against power and connectivity shocks, and enterprises now design budgets around business-continuity rather than pure cost efficiency. Momentum stems from real-time payments mandates, hyperscale data-center launches, and edge-computing nodes that keep critical applications live during Stage 6 load-shedding. Telcos are repurposing 5G assets for fixed-wireless broadband, fintechs are embedding bank-grade services through open APIs, and cloud-security outlays are rising as cyber-insurance underwriters tighten terms. Hybrid deployments balance data-residency compliance with elastic compute, while government vouchers help small firms leapfrog legacy systems and close the digital divide within the South Africa ICT market.
Key Report Takeaways
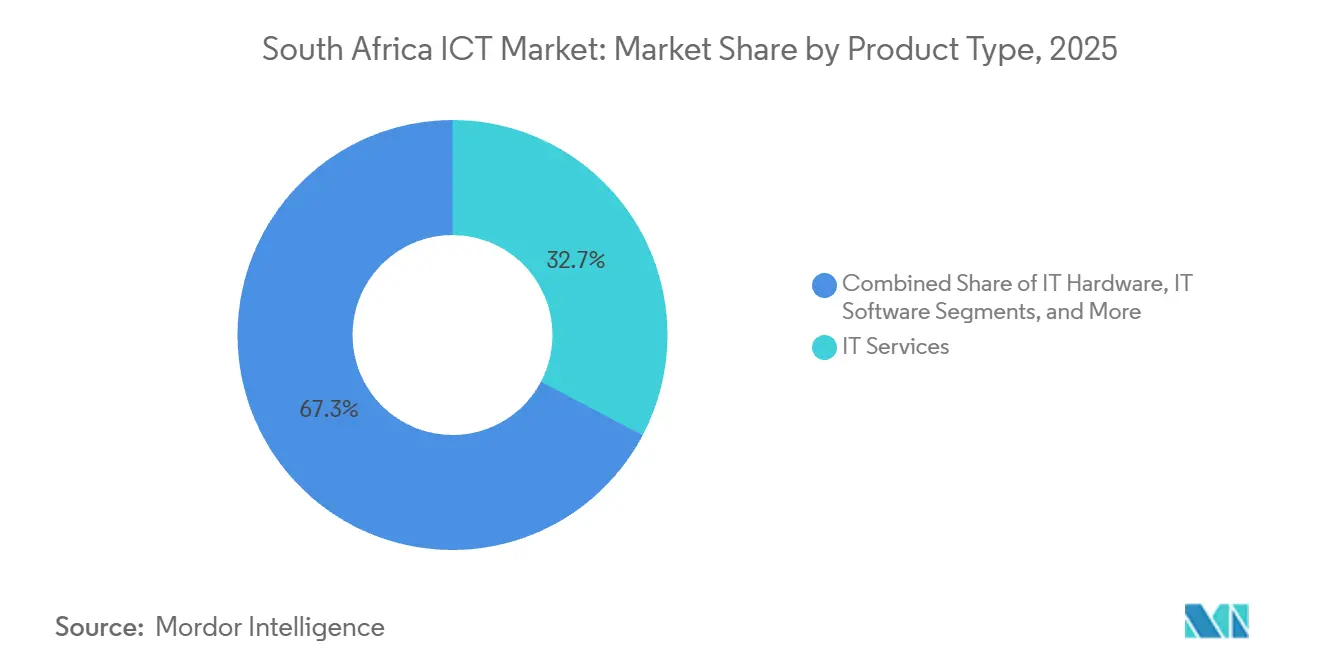
- By product type, IT services led with 32.73% of the South Africa ICT market share in 2025, while IT security and cybersecurity are advancing at an 8.33% CAGR through 2031.
- By enterprise size, large enterprises captured 62.84% of spending in 2025 in the South Africa ICT market; small and medium enterprises are on track for an 8.78% CAGR to 2031.
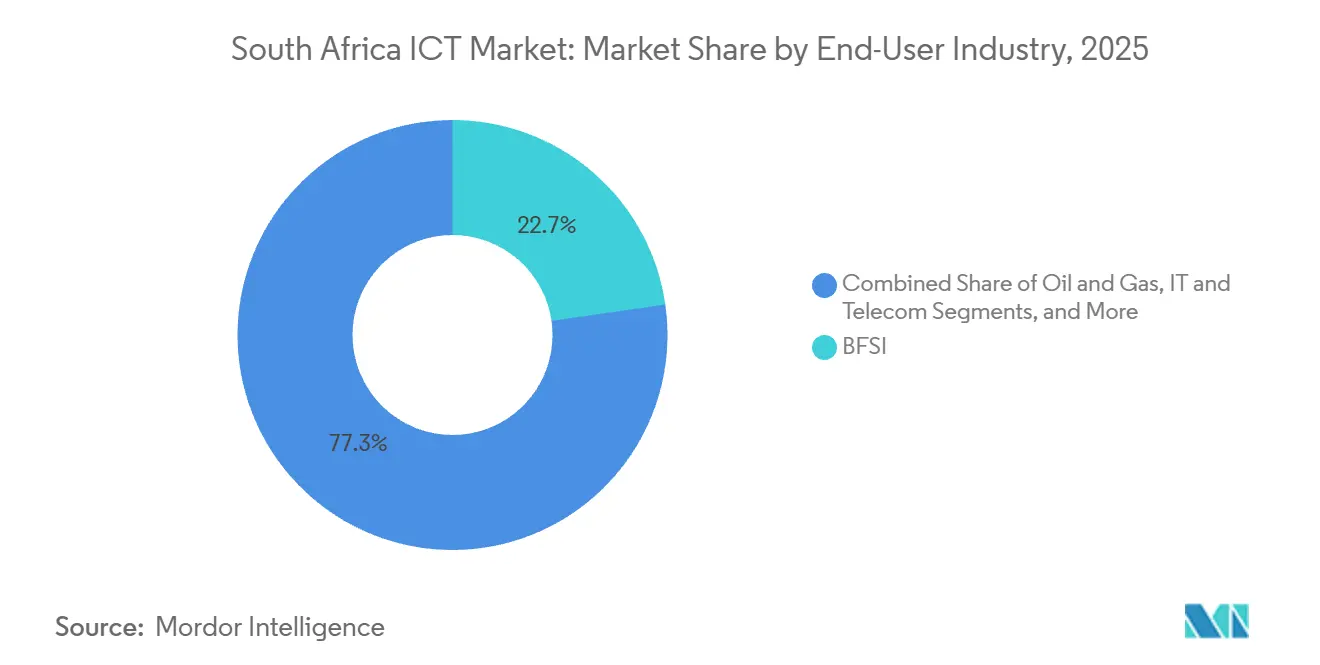
- By end-user vertical, BFSI commanded a 22.74% share of the South Africa ICT market size in 2025, yet healthcare is forecast to expand at an 8.43% CAGR to 2031.
- By deployment model, cloud accounted for 46.83% of revenue in 2025 in the South Africa ICT market, whereas hybrid architecture is projected to post an 8.67% CAGR through 2031.
Note: Market size and forecast figures in this report are generated using Mordor Intelligence’s proprietary estimation framework, updated with the latest available data and insights as of January 2026.
South Africa ICT Market Trends and Insights
Drivers Impact Analysis*
| Driver | (~) % Impact on CAGR Forecast | Geographic Relevance | Impact Timeline |
|---|---|---|---|
| Rapid digital transformation in BFSI | +2.1% | National, concentrated in Gauteng and Western Cape financial hubs | Medium term (2-4 years) |
| Robust 5G rollout and spectrum auctions | +1.8% | National, with early coverage in Johannesburg, Cape Town, Durban metro areas | Short term (≤ 2 years) |
| Government SA Connect and National Broadband plans | +1.5% | National, prioritizing underserved rural and township areas | Long term (≥ 4 years) |
| Enterprise cloud and hyperscale data-center investments | +1.9% | National, anchored by Cape Town and Johannesburg data-center clusters | Medium term (2-4 years) |
| Surge in fintech-led open-banking API adoption | +1.2% | National, with higher penetration in urban centers | Short term (≤ 2 years) |
| PV-powered micro-edge data-centers amid load-shedding | +0.9% | National, critical in regions with frequent grid instability | Short term (≤ 2 years) |
| Source: Mordor Intelligence | |||
Rapid Digital Transformation In BFSI
Core-system renewal has become a competitive weapon for banks rather than a periodic upgrade. Standard Bank’s multi-year cloud program is migrating 80% of transactional workloads to microservices, cutting card-not-present fraud by 22% in 2025. Absa completed a hybrid-cloud refactor that slashed product launch cycles from nine months to six weeks. The real-time payments mandate effective 2027 compels tier-two lenders to adopt cloud orchestration because legacy cores cannot hit sub-second settlement. FirstRand’s machine-learning credit model now approves SME loans in 15 minutes. Challenger TymeBank’s branchless playbook reached 10 million customers, proving that digital-only scale is viable even in fee-sensitive segments.
Robust 5G Rollout And Spectrum Auctions
The 2022 auction unlocked 3.6 GHz and 700 MHz bands, enabling 5G to cover half the population by end-2024.[1] Independent Communications Authority of South Africa, “Spectrum Auction Report 2022,” icasa.org.za Vodacom’s 500-site grid delivered 1.2 Gbps bursts in Johannesburg, allowing enterprises to swap MPLS lines for fixed-wireless. MTN launched a standalone core with network slicing for telemedicine, lowering packet loss below 1% on rural video consults. Rain’s unlimited 5G plan priced at ZAR 599 (USD 36.93) per month won 250,000 users by mid-2025. Broadcasters have contested the next mid-band auction slated for late-2026, a dispute that may constrain IoT latency targets if unresolved.
Government SA Connect And National Broadband Plans
The 2025/26 budget earmarked ZAR 710 million (USD 43.77 million) to extend fiber backhaul to 1,800 public sites. Rollout hinges on Broadband Infraco, whose 2024 rescue process exposed funding risks for rural links. Municipalities must issue wayleaves within 60 days, yet 40% of township projects still exceeded yearlong delays in 2025. The MyMzansi digital ID pilot aims to onboard 5 million citizens, reducing in-person government visits by 60%. Smart-city pilots in Cape Town, Johannesburg, and Durban remain siloed, limiting cross-municipal analytics.
Enterprise Cloud And Hyperscale Data-Center Investments
Microsoft’s Azure regions cut latency from 180 ms via Europe to under 5 ms locally, unlocking real-time trading workloads. Google Cloud’s Johannesburg site added a direct interconnect to the Johannesburg Stock Exchange for sub-millisecond execution. AWS Local Zones in Cape Town let firms keep sensitive data on-shore while tapping full service catalogs. Solar-backed campuses from Teraco and Africa Data Centres guarantee uptime during Stage 6 load-shedding, a differentiator that lured new tenants. Local solar capacity trims diesel costs by ZAR 15 million (USD 0.92 million) annually at one Cape facility.
Restraints Impact Analysis*
| Restraint | (~) % Impact on CAGR Forecast | Geographic Relevance | Impact Timeline |
|---|---|---|---|
| High spectrum and device costs | -0.8% | National, disproportionately affecting rural and low-income urban areas | Medium term (2-4 years) |
| Load-shedding-induced network downtime | -1.1% | National, most severe in provinces with aging grid infrastructure | Short term (≤ 2 years) |
| Escalating cyber-insurance premiums squeezing SME budgets | -0.6% | National, concentrated among enterprises with revenues below ZAR 50 million | Short term (≤ 2 years) |
| Fragmented municipal right-of-way rules delaying fiber | -0.9% | National, most acute in Gauteng, KwaZulu-Natal, and Eastern Cape municipalities | Long term (≥ 4 years) |
| Source: Mordor Intelligence | |||
Load-Shedding-Induced Network Downtime
Stage 6 blackouts struck 120 days in 2024 and 95 days in 2025, knocking out 18% of Vodacom’s mobile sites for more than four hours at a time. MTN spent ZAR 1.2 billion outfitting 3,000 towers with lithium batteries, extending runtime but raising opex 15%. Telkom’s aging copper lines failed during outages, affecting 200,000 ADSL users. One bank lost six hours of mobile-app access, forfeiting ZAR 8 million (USD 0.49 million) in fees. Nationwide ICT losses from fuel, batteries, and downtime exceeded ZAR 12 billion (USD 0.074 billion) in 2024.
Escalating Cyber-Insurance Premiums Squeezing SME Budgets
Premiums jumped 35% in 2025 after ransomware losses hit ZAR 2.2 billion (USD 0.14 billion). Insurers now demand MFA, EDR, and quarterly scans, adding ZAR 180,000 (USD 11,097.07) to annual compliance for 50-to-200-employee firms. Fifty-eight percent of SMEs below ZAR 50 million (USD 3.08 million) revenue dropped coverage in 2025, relying on free antivirus that barely thwarts credential-stuffing responsible for 72% of breaches.[2]Small Enterprise Development Agency, “SME Digitalization Fund 2025,” seda.org.za New SAIA guidelines penalize firms without ISO 27001, a ZAR 350,000 (USD 21577.63) undertaking. The rift leaves large corporates adopting zero-trust while small firms remain exposed.
*Our forecasts treat driver/restraint impacts as directional, not additive. The impact forecasts reflect baseline growth, mix effects, and variable interactions.
Segment Analysis
By Product Type: Services Dominance Masks Security Surge
South Africa IT services held a 32.73% slice of the South Africa ICT market in 2025, powered by outsourced transformations and business-process contracts. Global integrators scaled local headcount as cost arbitrage against European delivery centers, and domestic firms capitalized on cloud migrations that required advisory, refactoring, and managed support. Communication services revenue eroded when enterprises replaced MPLS with software-defined WANs at half the cost, prompting carriers to exit low-margin voice contracts. IT hardware demand softened as device-as-a-service shifted laptops to operating leases, compressing vendor margins. In contrast, IT security and cybersecurity are pacing at an 8.33% CAGR, the fastest among product lines, as POPIA fines spur identity management and cloud posture tools. Software spend bifurcates between ERP upgrades and cloud-native development, especially with SAP users migrating to S/4HANA Cloud. Infrastructure sales to hyperscalers muted on-prem volumes, yet rugged edge appliances for predictive maintenance buoyed niche hardware sales.
The compliance landscape amplified the South Africa ICT market size for security suites as insurers demanded stricter controls. Identity, privilege, and zero-trust modules now bundle with managed detection subscriptions targeting SMEs that lack in-house analysts. Services revenue tethered to multiyear cloud contracts remains sticky, ensuring predictable annuity flows. Vendors that integrate security into service catalogs defend margins better than pure-play resellers. Hardware suppliers courting edge-computing opportunities pitch low-power, fanless gateways that withstand dust and heat in mines and retail warehouses. Growth leaders embed renewable-energy backup to guarantee uptime, a feature critical during Stage 6 grid disruptions.


By Enterprise Size: SME Acceleration Driven By Vouchers
Large enterprises generated 62.84% of 2025 spending, reflecting their deep transformation budgets for hybrid-cloud cores and analytics pipelines. Banks, retailers, and mining majors signed nine-figure, multiyear contracts that anchor predictable vendor revenue. Yet small and medium enterprises trailblazed an 8.78% CAGR, aided by government vouchers that subsidize cloud apps and security suites. The South Africa ICT market responds with pay-as-you-go pricing, letting SMEs swap lumpy capex for steady opex. Digital-native startups launch directly in SaaS, avoiding legacy lock-in, and POS fintechs couple hardware with free software to soften subscription resistance.
Skill shortages constrain SME cloud journeys, so managed-service bundles at ZAR 8,000 (USD 493.20) per month attract firms lacking certified staff. Volume discounts let corporates negotiate 40% off license lists, widening the affordability gap. Government funds target this divide by co-financing ERP and supply-chain systems for manufacturing SMEs, enabling integration with corporate buyers. Large enterprises meanwhile channel savings from cloud elasticity into customer-facing innovation rather than infrastructure upkeep. Vendors that tier portfolios by firm size sustain wallet share across segments, and public-sector procurement increasingly mirrors enterprise frameworks, tightening standards for all suppliers within the South Africa ICT market.
By End-User Industry: Healthcare Outpaces BFSI On Digital Records Mandate
BFSI retained a 22.74% cut of spending in 2025, yet healthcare is sprinting ahead with an 8.43% CAGR, the highest vertical pace through 2031. Public-hospital upgrades flow from the National Health Insurance Digital Health Strategy, which funds interoperable EMR rollouts. Private groups deployed cloud EMRs across 54 sites, achieving tangible savings by curbing duplicate tests. BFSI budgets remain compliance-heavy, allocating a quarter of IT outlays to anti-money-laundering analytics, but growth moderates as core modernization peaks. Retailers intensify omnichannel projects, mining leverages digital twins for maintenance, and the public sector migrates ministries to hybrid architectures, broadening opportunity pockets inside the South Africa ICT market.
Healthcare’s ascent hinges on telemedicine platforms that extend specialist care to remote provinces via 5G and edge nodes. Hospitals integrate AI triage tools, reducing ER bottlenecks, while cloud imaging archives lower storage costs. Banks pursue fraud analytics and open-banking ecosystems, yet fintech challengers siphon fee income unchecked. Manufacturing digitizes shop floors with IoT sensors, and smart-grid pilots in utilities set the stage for dynamic pricing. Education’s large-scale Teams deployment brings collaboration to 25,000 schools, reinforcing cloud familiarity among learners entering the workforce. Vendors with vertical blueprints secure cross-sell potential, lifting the South Africa ICT market size across industries.[3]Department of Basic Education, "ICT Strategy 2025," education.gov.za
By Deployment Model: Hybrid Gains As POPIA Enforces Residency
Cloud commanded 46.83% revenue in 2025, but hybrid is the faster climber at 8.67% CAGR. Banks store transaction data on-prem yet run fraud models in public cloud, satisfying residency rules while gaining elastic compute. AWS Local Zones and Google regions shorten latency, letting enterprises shift chatbots, analytics, and dev-test to cloud while anchoring sensitive records locally. On-prem persists in defense and critical infrastructure, where air-gapped setups prevail. Edge constitutes a third tier, placing servers in retail outlets for instant inventory updates and syncing overnight to cloud warehouses, a pattern that trims WAN fees by 60%.
Hybrid adoption wrestles with talent scarcity, as 54% of firms cannot source staff fluent across platforms. Managed hybrid services surge to fill the gap, blending SLA-bound uptime with regulatory guidance. During month-end peaks, banks burst compute to cloud, avoiding ZAR 200 million (USD 12.33 million) in stranded capital over three years. SMEs gravitate to full cloud, sidestepping server rooms entirely. Data-center operators differentiate through solar-powered uptime that shields workloads from Eskom instability, appealing to compliance-sensitive clients. As data-sovereignty conversations evolve, hybrid architectures cement themselves as the default within the South Africa ICT market.
Geography Analysis
Gauteng and Western Cape contribute roughly 65% of national spend, anchored by financial headquarters and hyperscale clusters. Fiber reached 12 million premises by mid-2025, triple penetration in Nigeria and Kenya combined, yet township wayleave disputes delayed two-fifths of projects and capped broadband uptake among lower-income households. KwaZulu-Natal’s smart-city rollout deployed 5,000 sensors for traffic and water leaks, but interoperability gaps with other metros hinder data sharing. Eastern Cape and Limpopo benefited from SA Connect backhaul extensions to schools and clinics, though last-mile fiber remains commercially unviable where incomes average below ZAR 8,000 (USD 493.20) per month.
Cross-border bandwidth improved after Liquid Intelligent Technologies shortened Johannesburg-Nairobi latency to 22 ms, enabling South African SaaS vendors to serve East Africa without local racks. Submarine cables landing in Cape Town add 40 Tbps of capacity, though streaming traffic consumes 70% of peak bandwidth, limiting headroom for enterprise workloads in evening windows. Spectrum coverage varies widely, with Gauteng achieving 60% 5G reach versus 15% in Northern Cape, reflecting operators’ focus on higher ARPU urban markets.
ICASA’s universal-service fund subsidized 200 rural towers, but contributions dipped 18% in 2024 as carrier revenue cooled, threatening sustainability. Municipal fiber rules still diverge across 257 authorities, prompting calls for a single national permitting framework. Despite these headwinds, the South Africa ICT market continues to attract foreign direct investment, reinforcing its role as a launchpad for sub-Saharan expansion.
Competitive Landscape
The South Africa ICT market exhibits moderate concentration, with the ten largest providers accounting for roughly 45% of 2025 revenue, leaving ample headroom for aggressive challengers. Competitive dynamics are shifting as hyperscalers move to direct independent software vendor alliances, cutting traditional system integrators out of high-margin implementation work. Telcos are also blurring historical boundaries, and mobile operators are buying fiber assets to defend their household connectivity share. As a result, legacy channel partners now pivot toward industry-specific managed services that bundle consulting, security, and compliance support. Price pressure is intensifying because fixed-wireless 5G can be deployed more quickly than fiber, enabling carriers to acquire customers before civil works permits are granted.
Vodacom’s purchase of a minority stake in a leading fiber wholesaler signals deeper convergence between mobile and wireline domains and challenges Telkom’s long-held position in fixed broadband. Microsoft’s local Azure expansion came with 15 exclusive ISV deals that divert integration revenue from decades-old partners and accelerate software-as-a-service adoption. New entrants like Rain use aggressive 40% price discounts on unlimited 5G plans to secure peri-urban households that fiber builders cannot reach, while Yoco’s bundled point-of-sale and inventory platform has signed up 400,000 merchants outside the traditional banking ecosystem. MTN differentiates on technology by using a standalone 5G core to offer network slices with guaranteed throughput for telemedicine and other latency-sensitive enterprise applications.
Innovation pipelines remain active, with patent filings in AI-driven network optimization rising 35% year on year; one global vendor claims its predictive algorithms can detect base-station faults three days in advance, lowering field-maintenance costs by one-fifth. Consolidation is accelerating as Telkom and MTN explore a merger that would create an operator with more than 60 million mobile lines plus a national fiber footprint, although regulators may impose divestitures to safeguard competition. Market access standards are tightening, and 72% of large enterprises now require ISO 27001 certification before awarding managed-service contracts, a bar that favors global service providers with mature governance over smaller local firms. System integrators that once thrived on perpetual-license rollouts must therefore pivot to outcome-based contracts that guarantee uptime, compliance, and threat-response times. Overall, strategic positioning now hinges on the ability to pair local data-center capacity with industry-specific solutions, creating an arms race that will redefine market share over the next five years.
South Africa ICT Industry Leaders
-
IBM Corporation
-
Microsoft Corporation
-
Dell Technologies Inc.
-
Oracle Corporation
-
SAP SE
- *Disclaimer: Major Players sorted in no particular order

Recent Industry Developments
- January 2026: MTN Group Limited announced a ZAR 4.2 billion (USD 231 million) program to deploy Open RAN across 2,000 base stations by December 2026 MTN South Africa.
- December 2025: Liquid Intelligent Technologies invested ZAR 1.8 billion (USD 99 million) in the 2Africa subsea cable, securing 20% capacity Liquid Intelligent Technologies.
- November 2025: Oracle Corporation launched a ZAR 2.1 billion (USD 116 million) cloud region in Johannesburg, offering sub-5-millisecond latency Oracle South Africa.
- October 2025: Telkom SA SOC Limited and MTN Group Limited merged their tower infrastructures into a ZAR 8.5 billion (USD 468 million) joint venture Telkom-MTN Joint Venture.


Research Methodology Framework and Report Scope
Market Definitions and Key Coverage
Our study defines South Africa's information and communication technology market as all revenues generated within the country from network services, telecom infrastructure, computer hardware, software, cybersecurity solutions, managed and cloud services, data-center capacity, and related professional services that enable the creation, storage, transmission, and analysis of digital information.
Consumer electronics such as televisions, stand-alone gaming consoles, and white-label peripherals are excluded, because they follow separate retail value chains.
Segmentation Overview
-
By Product Type
-
IT Hardware
- Computer Hardware
- Networking Equipment
- Peripherals
- IT Software
-
IT Services
- IT Consulting and Implementation
- IT Outsourcing (ITO)
- Business Process Outsourcing (BPO)
- Managed Security Services
- Cloud and Platform Services
- IT Infrastructure
-
IT Security / Cybersecurity
- Application Security
- Cloud Security
- Data Security
- Network Security
- Endpoint Security
- Infrastructure Protection
- Integrated Risk Management
- Identity and Access Management (IAM)
- Communication Services
-
IT Hardware
-
By Enterprise Size
- Small and Medium-sized Enterprises
- Large Enterprises
-
By End-user Industry Vertical
- BFSI
- Government and Public Sector
- Oil and Gas
- IT and Telecom
- Retail, E-commerce and Consumers
- Manufacturing and Industrial
- Energy and Utilities
- Healthcare
- Other End-user Industry Verticals (Transport, Logistics, Education, Hospitality)
-
By Deployment Model
- On-premise
- Cloud
- Hybrid
Detailed Research Methodology and Data Validation
Primary Research
Interviews and surveys with CIOs, telecom carriers, data-center operators, cloud resellers, and procurement heads across Gauteng, Western Cape, and KwaZulu-Natal verified pricing spreads, project pipelines, and adoption hurdles. Feedback from regulatory experts and industry consultants was critical to stress-test long-term power-supply and spectrum-availability assumptions.
Desk Research
Mordor analysts began with publicly available macro and sector datasets from Statistics South Africa, the Independent Communications Authority of South Africa, the National Treasury budget papers, the International Telecommunication Union, and the World Bank. These sources establish historic revenue pools, device shipments, broadband lines, spectrum fees, and GDP links. Company filings, provincial gazettes, trade-association notes from Business Unity South Africa, and respected business media helped us track operator capex, enterprise IT budgets, talent gaps, and policy moves. We then mined paid repositories, D&B Hoovers for local vendor financials and Dow Jones Factiva for deal flow and contract wins, to sharpen growth signals. The sources named are illustrative; many additional references were consulted to validate figures and fill information gaps.
Market-Sizing & Forecasting
A top-down model converts ICASA service-revenue disclosures and Statistics SA capital-formation data into 2024 spend pools, which are then split by segment using enterprise IT budget ratios and subscriber counts. Bottom-up checks, sampled supplier roll-ups, device imports, and average selling price × unit volumes fine-tune totals. Key drivers in the model include mobile data traffic, fixed-broadband subscriptions, enterprise cloud-migration rates, exchange-rate trends, and public-sector ICT allocations. Forecasts to 2030 rely on multivariate regression supported by ARIMA overlays, with elasticities derived from historic GDP, population, and smartphone-penetration series. Where granular shipment data are scarce, we interpolate using three-year average growth differentials observed in adjacent markets and validate directionally through dealer interviews.
Data Validation & Update Cycle
Outputs pass a two-layer analyst review that hunts for variance against external benchmarks and prior editions. Material deviations trigger call-backs with earlier respondents. The South Africa ICT model is refreshed annually, and interim updates are issued if load-shedding intensity, exchange-rate swings, or spectrum awards move more than five percent from base assumptions.
Why Mordor's South Africa ICT Baseline Stands Up to Scrutiny
Published estimates often diverge because firms pick different segment baskets, convert currencies at dissimilar dates, or apply optimistic device-penetration curves.
Key gap drivers center on scope choices, some studies fold consumer devices in, others drop telecom service revenue, the depth of primary validation, and update frequency. Mordor reports use a balanced ICT definition, annual refreshes, and dual-method modeling, which keeps our 2025 value of USD 39.72 billion both current and reproducible.
Benchmark comparison
| Market Size | Anonymized source | Primary gap driver |
|---|---|---|
| USD 39.72 bn (2025) | Mordor Intelligence | - |
| USD 47.92 bn (2025) | Global Consultancy A | Includes consumer electronics and uses broader Africa comparables with limited in-country expert interviews |
| USD 21.60 bn (2024) | Trade Journal B | Excludes telecom-service revenue and relies mainly on desktop reviews without supplier roll-ups |
| USD 3.03 bn (2024) | Industry Association C | Focuses on IT hardware only; omits software, services, and connectivity segments |
These comparisons show that once scope and validation rigor are equalized, Mordor's disciplined, openly documented baseline offers decision-makers the most dependable starting point for strategic planning.


Key Questions Answered in the Report
What is the projected value of the South Africa ICT market in 2031?
The South Africa ICT market is forecast to reach USD 62.18 billion by 2031.
Which segment is growing fastest within South African ICT spending?
IT security and cybersecurity is projected to expand at an 8.33% CAGR through 2031.
Why are hybrid deployments gaining traction among South African firms?
Hybrid models satisfy POPIA data-residency rules while offering cloud elasticity and lower peak-capacity costs.
How will 5G influence enterprise connectivity strategies?
5G fixed-wireless and network slicing let companies replace MPLS or enable low-latency services such as telemedicine.
What factors are driving SME technology adoption in South Africa?
Government vouchers, pay-as-you-go cloud pricing, and bundled security services lower entry barriers for small firms.
How does load-shedding impact ICT infrastructure investment?
Frequent Stage 6 outages push enterprises toward solar-backed edge and data-center solutions that guarantee uptime.
Page last updated on:


