Market Overview
| Study Period | 2021 - 2031 |
|---|---|
| Forecast Data Period | 2026 - 2031 |
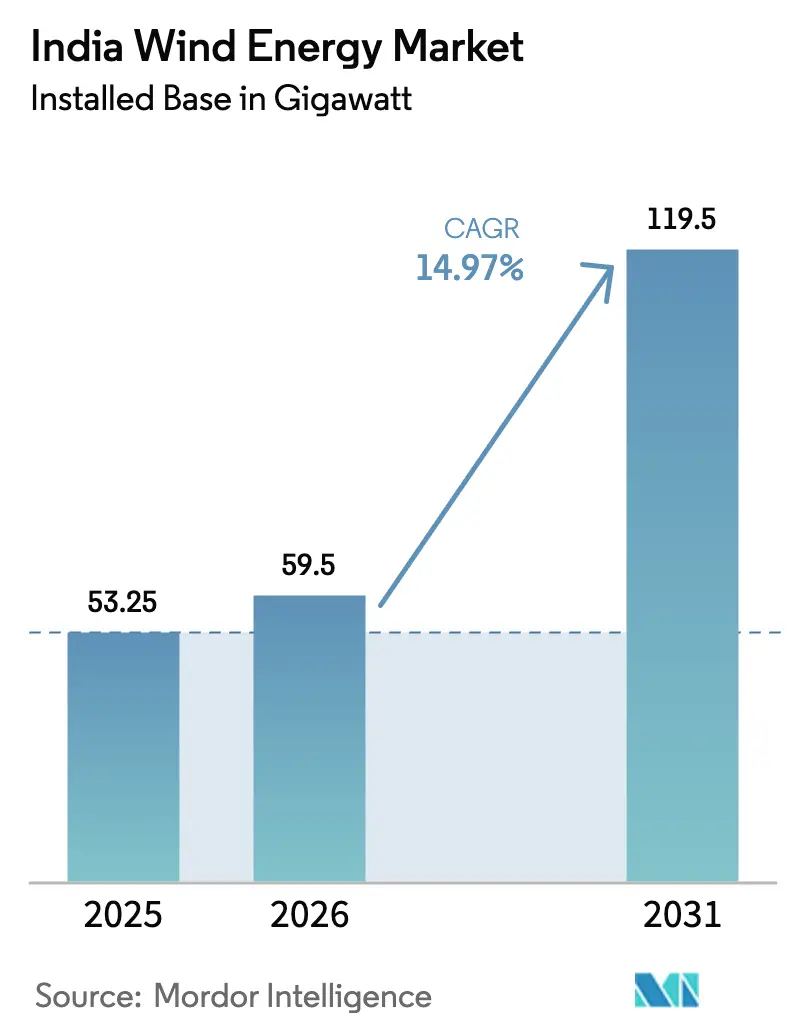
| Base Year Market Size (2025) | 53.25 gigawatt |
| Market Volume (2026) | 59.5 gigawatt |
| Market Volume (2031) | 119.5 gigawatt |
| Growth Rate (2026 - 2031) | 14.97% CAGR |
| Market Concentration | Medium |
Major Players *Disclaimer: Major Players sorted in no particular order Image © Mordor Intelligence. Reuse requires attribution under CC BY 4.0. | |
India Wind Energy Market Analysis by Mordor Intelligence
The India Wind Energy Market size in terms of installed base is projected to be 53.25 gigawatt in 2025, 59.5 gigawatt in 2026, and reach 119.5 gigawatt by 2031, growing at a CAGR of 14.97% from 2026 to 2031.
A clear policy push, rapid hybrid tendering, and steady grid upgrades are rebuilding the momentum that was lost during the 2017-2019 auction lull. Hybrid auctions that bundle wind with solar have already raised project capacity-utilization factors above 35% in Gujarat and Tamil Nadu, outperforming the 25% norm for standalone wind. Developers now face fewer offtake risks thanks to 25-year power-purchase agreements and interstate transmission charge waivers that lift internal rates of return by up to 100 basis points. Simultaneously, the offshore segment has moved from concept to capital commitment, as viability-gap funding worth USD 820 million covers the 40% cost premium versus onshore projects. On the supply side, domestic original equipment manufacturers (OEMs) retain cost leadership in sub-3 MW turbines, while international OEMs pivot to the higher-rated machines required for offshore and repowering projects.
Key Report Takeaways
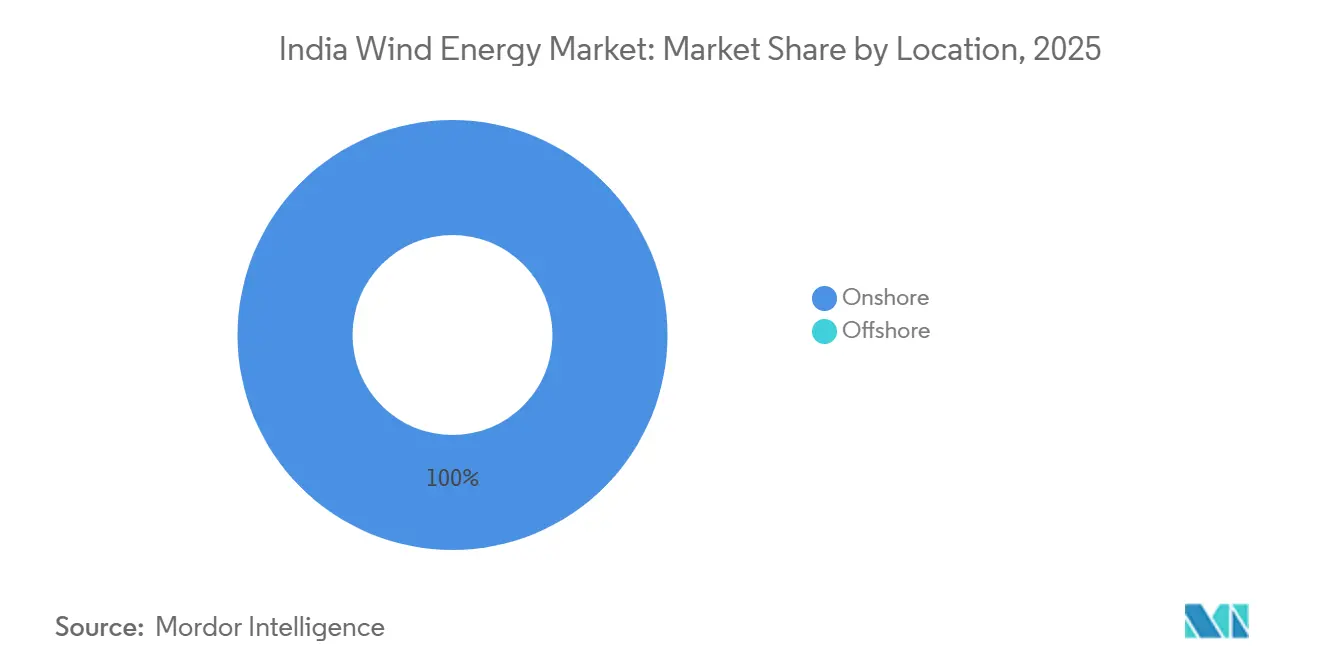
- By location, onshore installations held 100% of the India wind energy market share in 2025 and will maintain a 14.9% CAGR through 2031.
- By turbine capacity, units rated up to 3 MW captured 59.5% of the India wind energy market in 2025, whereas the 3 MW–6 MW class is projected to grow at a 21.4% CAGR through 2031.
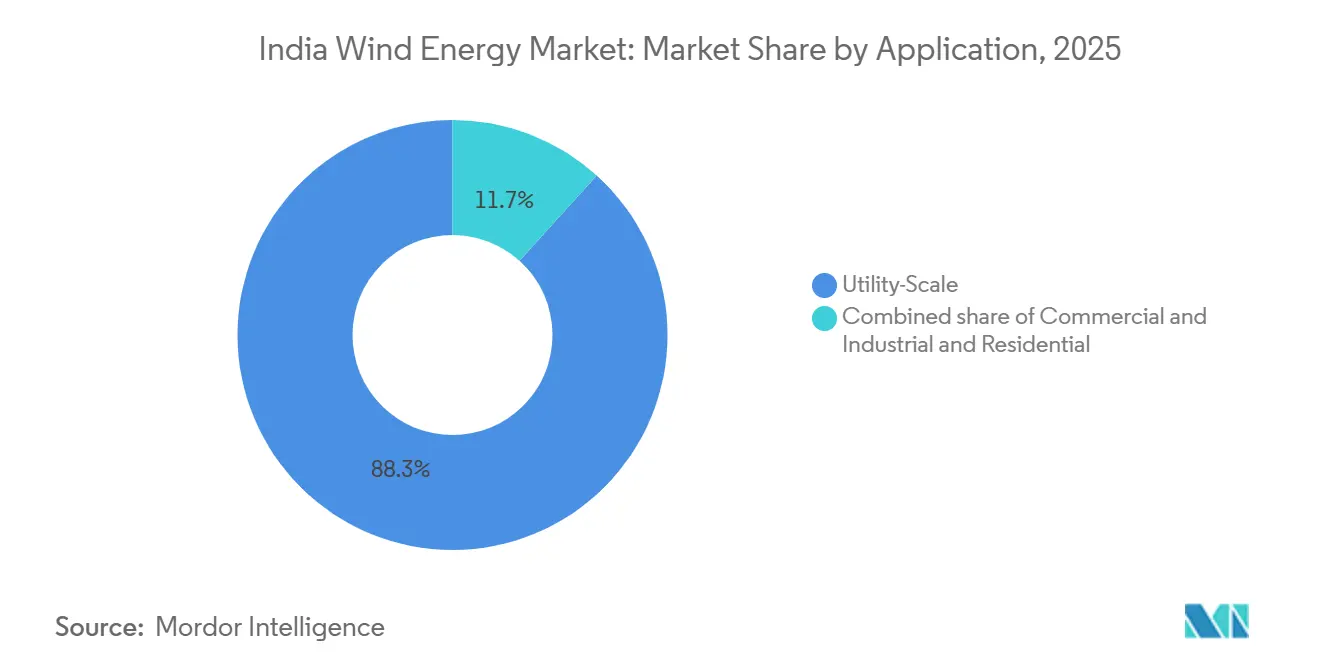
- By application, utility-scale projects commanded 88.3% of the India wind energy market size in 2025 and are poised for a 17.0% CAGR to 2031.
Note: Market size and forecast figures in this report are generated using Mordor Intelligence’s proprietary estimation framework, updated with the latest available data and insights as of January 2026.
India Wind Energy Market Trends and Insights
Drivers Impact Analysis*
| Driver | (~) % Impact on CAGR Forecast | Geographic Relevance | Impact Timeline |
|---|---|---|---|
| Accelerated hybrid renewable auctions bundling wind with solar | 3.2% | Tamil Nadu, Gujarat, Karnataka | Medium term (2-4 years) |
| Viability-gap funding for offshore wind in Gujarat | 2.1% | Gujarat (Gulf of Khambhat), Tamil Nadu (Gulf of Mannar) | Long term (≥ 4 years) |
| Repowering scheme for ageing wind farms | 2.8% | Tamil Nadu, Gujarat, Maharashtra, Karnataka | Medium term (2-4 years) |
| Green hydrogen policy driving high-load-factor wind demand | 2.5% | Gujarat, Rajasthan, Andhra Pradesh (industrial clusters) | Long term (≥ 4 years) |
| ISTS charge waivers boosting project IRRs | 1.9% | Gujarat, Rajasthan, Karnataka (resource-rich states) | Short term (≤ 2 years) |
| Corporate PPAs from data-center operators | 1.8% | Pan-India, concentrated in Maharashtra, Karnataka, Tamil Nadu | Medium term (2-4 years) |
| Source: Mordor Intelligence | |||
Hybrid Renewable Auctions Accelerate Capacity Utilization
Hybrid tenders awarded 1,200 MW in Tamil Nadu and Gujarat in fiscal 2025, lifting combined plant-load factors above 35% and permitting developers to secure debt at 9.5% interest, 150 basis points below standalone wind benchmarks.[1]Solar Energy Corporation of India, “ISTS Hybrid Tranche-VIII Results,” seci.co.in The Solar Energy Corporation of India’s eighth ISTS hybrid tranche cleared at tariffs between Rs 2.99 and Rs 3.04 per kWh (USD 0.036–0.037 per kWh), confirming that colocating wind and solar slashes balancing-of-system costs. Tamil Nadu’s 34.75 MW repowering-to-hybrid pilot doubled annual generation by replacing fifteen 1.5 MW turbines with five 3 MW machines paired with 10 MW of solar on the same site. Gujarat’s Kutch region benefits further because nocturnal wind peaks dovetail with strong daytime solar irradiation, which averages 5.5 kWh/m²/day, reducing curtailment risk. Moreover, hybrid structures sidestep state-level energy-banking caps that typically force generators to curtail during monsoon months, protecting revenue streams.
Viability-Gap Funding Unlocks Offshore Supply Chains
The Ministry of New and Renewable Energy earmarked Rs 6,853 crore (USD 820 million) to de-risk the first 1 GW of offshore capacity, split evenly between Gujarat’s Gulf of Khambhat and Tamil Nadu’s Gulf of Mannar, by fixing tariffs at Rs 4.5 per kWh (USD 0.054 per kWh). This subsidy persuaded Siemens Gamesa and Vestas to announce new blade and nacelle factories in Gujarat aimed at a 4 GW tender pipeline through 2028. Seabed surveys by the National Institute of Wind Energy indicate 70 GW of technical potential in 30 m–60 m depths, but evacuation remains critical.[2]National Institute of Wind Energy, “Offshore Wind Potential,” niwe.res.in Power Grid Corporation of India is designing a 2,000 MW HVDC link from the Gulf of Khambhat to Saurashtra, yet land acquisition for converter stations delays commissioning until late 2027.[3]Power Grid Corporation of India, “HVDC Corridor DPR,” powergrid.in Without that corridor, the 500 MW Gujarat pilot cannot reach financial close even though developers already hold seabed leases, underscoring the grid’s gatekeeper role.
Repowering Scheme Targets 5 GW–15 GW of Ageing Assets
India commissioned 25.4 GW of wind before 2010 using sub-2 MW turbines, creating an opportunity to add 5 GW–15 GW by replacing them with 3 MW–5 MW platforms. Tamil Nadu alone hosts 7.3 GW of repowering potential in districts such as Coimbatore and Tirunelveli, where land and grid access are intact. The December 2023 repowering policy mandates at least a 1.5× generation uplift, nudging developers toward 120 m hubs with 140 m rotors. Suzlon’s modular 3.15 MW S144 turbine, designed for narrow rural roads, emerged as the preferred repowering choice and already holds a 1,084 MW backlog. Still, forcing developers to decommission legacy turbines within six months of new-plant commissioning causes a revenue hiatus that smaller independent power producers struggle to finance without bridge facilities.
Green Hydrogen Policy Drives Industrial Wind Demand
The National Green Hydrogen Mission targets 5 million tons per year by 2030, spurring industrial buyers to secure high-load-factor wind power. NTPC reserved 1,320 MW of hybrid wind-solar capacity for its Pudimadaka ammonia plant in Andhra Pradesh, aiming for 70% annual availability. JSW Energy is committed to 3.8 GW of renewables, focusing on Gujarat and Rajasthan sites where wind capacity factors exceed 38%. Constant-load electrolyzers push developers to pair wind with four-hour batteries, as seen in SJVN’s 4,000 MW Rajasthan park that integrates 2,400 MW of wind, 1,600 MW of solar, and 800 MWh of storage. Twelve coastal hydrogen hubs are planned, with Mundra and Dahej alone expected to absorb 6 GW of dedicated wind by 2030. The willingness of industry buyers to sign 20-year contracts above Rs 3.5 per kWh (USD 0.042 per kWh) diminishes exposure to reverse-auction price compression.
Restraints Impact Analysis*
| Restraint | (~) % Impact on CAGR Forecast | Geographic Relevance | Impact Timeline |
|---|---|---|---|
| Land allotment freeze in Karnataka and Maharashtra | -1.7% | Karnataka, Maharashtra (high-wind districts) | Short term (≤ 2 years) |
| Delayed grid evacuation for offshore wind | -1.3% | Gujarat (Gulf of Khambhat), Tamil Nadu (Gulf of Mannar) | Medium term (2-4 years) |
| Rising GST on turbine components | -1.1% | Pan-India | Short term (≤ 2 years) |
| Banking restrictions by state DISCOMs | -0.9% | Tamil Nadu, Karnataka, Rajasthan | Short term (≤ 2 years) |
| Source: Mordor Intelligence | |||
Land Allotment Constraints in Karnataka and Maharashtra
Karnataka and Maharashtra contributed 2.1 GW of 2024 installations, yet now face forest-clearance backlogs that extend project schedules by 18–24 months. Karnataka’s Forest Department demands compensatory afforestation at double the diverted acreage, inflating per-megawatt land cost by up to Rs 10 lakh (USD 12,000). Maharashtra halted approvals in five talukas of Satara after title disputes with tribal communities froze roughly 800 MW of capacity. Developers pivot to Rajasthan and Gujarat, but lower wind speeds of 6.5 m/s at a 100 m hub height shave capacity-utilization factors by 8-10% compared with Karnataka’s 7.2 m/s profile. Repowering projects also stall because contiguous plots large enough for 140 m rotors are fragmented across multiple smallholders, elevating transaction complexity.
Grid Evacuation Delays for Offshore Wind
The 2,000 MW HVDC corridor from the Gulf of Khambhat to Saurashtra has yet to clear land-acquisition hurdles, pushing commissioning to 2027 and suspending financial close on the 500 MW Gujarat offshore pilot. Despite fixed tariffs and seabed leases, developers cannot finalize debt packages without grid visibility. Tamil Nadu’s Gulf of Mannar faces a similar bottleneck: the state transmission utility has not committed to a 765 kV onshore line, leaving bidders for the 4 GW offshore tender unable to model connection costs. Offshore’s capital intensity, Rs 12-14 crore/MW (USD 1.44-1.68 million/MW), magnifies delay risk because equipment and lease payments begin well ahead of revenue realization. Unless central planners fast-track grid links, offshore wind will remain a late-decade, rather than mid-decade, growth lever.
*Our forecasts treat driver/restraint impacts as directional, not additive. The impact forecasts reflect baseline growth, mix effects, and variable interactions.
Segment Analysis
By Location: Onshore Dominance Persists, Offshore Emerges
Onshore capacity accounted for the entire India wind energy market in 2025, expanding by 3.4 GW that year and heading toward a 14.9% CAGR through 2031, underpinned by robust state PPA demand. Gujarat led 2024 installations with 1,250 MW, followed by Karnataka at 1,135 MW and Tamil Nadu at 980 MW, as these states maintained clear land and grid processes. Offshore contributes none of the installed base today, yet a 1 GW funded pilot, 500 MW each in Gujarat and Tamil Nadu, targets commissioning by 2028 once the Power Grid evacuation link activates. National seabed surveys suggest 70 GW of technical potential at moderate depths, highlighting a long-run expansion vector for the India wind energy market.
Domestic OEMs dominate the onshore supply chain from blade fabrication in Gujarat to nacelle assembly in Himachal Pradesh, enabling six-month delivery cycles.[4]Suzlon Energy, “Q2 FY25 Investor Deck,” suzlon.com Projects in Rajasthan and Andhra Pradesh now serve dedicated green-hydrogen complexes, pairing 2,400 MW of wind with solar and storage to guarantee 70% annual availability. Offshore’s higher capacity factors, 45-50% compared with 25-30% onshore, could unlock premium tariffs once grid bottlenecks clear, but developers remain wary of the 40% capex premium and limited installation vessel availability. Consequently, most capital will continue to favor onshore repowering and hybrid assets until 2027.


By Turbine Capacity: Migration Toward 3 MW–6 MW Platforms
Machines up to 3 MW held 59.5% of the India wind energy market in 2025 because earlier-generation models populate the legacy fleet. Yet turbines rated 3 MW–6 MW are accelerating at a 21.4% CAGR through 2031, driven by independent power producers seeking superior economics in Gujarat’s Kutch and Tamil Nadu’s Tirunelveli districts. Inox Wind’s 3.3 MW model with a 137 m rotor offers 15% higher annual energy production than its 3 MW predecessor while fitting the same foundation footprint, easing permitting.
Repowering rules mandating a 1.5× uplift effectively push developers to 3 MW–5 MW units with 120 m hubs, and Suzlon’s S144 turbine sells briskly into this niche. Corporate PPA buyers, such as data-center operators, prefer larger turbines that raise capacity factors enough to cut battery storage requirements. Goods-and-services tax adds up to USD 12,000/MW to these larger machines, but higher energy yields still raise internal rates of return by 50–100 basis points in Class II wind regimes. Turbines beyond 6 MW remain the preserve of offshore tenders that will not come online until grid links are ready, limiting near-term volume.
By Application: Utility-Scale Dominates, C&I Gains Momentum
Utility-scale projects made up 88.3% of the India wind energy market size in 2025 and are forecast to grow at a 17.0% CAGR to 2031 on the back of 25-year state PPAs and SECI’s 1,200 MW hybrid auctions. Tamil Nadu’s distribution company inked an 800 MW order at Rs 3.1 per kWh (USD 0.037 per kWh), and Gujarat’s state utility bought 600 MW at Rs 2.99 per kWh (USD 0.036 per kWh), providing tariff visibility. Hybrid rules that stipulate 80% annual availability lifted utility-scale internal rates of return to 12-13% compared with 10-11% for legacy standalone wind.
Commercial and industrial (C&I) off-takers, though smaller, are scaling quickly as firms sign 10-15 year corporate PPAs for round-the-clock green power. CleanMax manages a 1.4 GW PPA book that includes 400 MW of wind for pharmaceutical and automotive clients who prize fixed tariffs. Amazon’s Karnataka contract pairs 150 MW of wind with 100 MW of solar and 50 MWh of storage, achieving 85% availability without DISCOM banking. Community projects stay marginal because DISCOMs stipulate minimum PPA tranches of 25 MW, and the Central Electricity Regulatory Commission caps net-metered wind at 1 MW. That regulatory ceiling limits community economics, channeling most incremental capital to utility and C&I segments.
Geography Analysis
Tamil Nadu, Gujarat, and Karnataka collectively controlled more than 70% of installed capacity in 2025, with Tamil Nadu alone operating about 10 GW, followed by Gujarat at 9 GW and Karnataka at 7 GW. Gujarat’s Kutch district added 1,250 MW in 2024 thanks to 7.5 m/s wind speeds at 120 m hubs and a single-window process that compresses development to 18 months. Tamil Nadu’s Coimbatore and Tirunelveli districts delivered 980 MW in 2024, largely through repowering projects that swap 1.5 MW turbines for new 3 MW machines on existing pads. Karnataka installed 1,135 MW in 2024, but delays in forest clearances across Davangere and Chitradurga now redirect capital toward Rajasthan and Andhra Pradesh sites with more accessible land.
Rajasthan and Andhra Pradesh have emerged as secondary hubs driven by green-hydrogen demand. SJVN’s 4,000 MW park in Rajasthan integrates 2,400 MW of wind with 1,600 MW of solar to feed NTPC’s electrolyzers at Pudimadaka, while JSW Energy earmarked 1,200 MW in Andhra Pradesh for green steel production. Land in Rajasthan costs Rs 15-20 lakh/MW (USD 18,000-24,000/MW), substantially lower than Gujarat’s Rs 25-30 lakh/MW (USD 30,000-36,000/MW), though wind speeds are about 1 m/s weaker. Andhra Pradesh’s Anantapur and Kurnool districts, averaging 6.8 m/s, attracted 400 MW of 2024 additions despite transmission congestion that developers mitigate by on-site storage.
Offshore prospects center on Gujarat’s Gulf of Khambhat and Tamil Nadu’s Gulf of Mannar. The viability-gap funding program fixes tariffs at USD 0.054 per kWh for the first 1 GW, but without the 2,000 MW HVDC link, lenders will not release funds. Until evacuation hurdles clear, capital will favor onshore hybrids. The ministry’s transmission waiver reduced delivered tariffs in Gujarat and Rajasthan by up to Rs 0.50 per kWh (USD 0.006 per kWh), improving project IRRs by nearly 1 percentage point and reinforcing these states’ lead positions.
Competitive Landscape
The India wind energy market exhibits moderate concentration anchored by domestic OEMs. Suzlon Energy and Inox Wind seized approximately 70% of 2025 turbine contracts, benefiting from 20–25% cost advantages due to local component sourcing and lower logistics outlays. Suzlon’s 1,084 MW backlog and Inox Wind’s 654 MW underscore their lock on the sub-3 MW space. International OEMs such as Vestas and Siemens Gamesa have trimmed onshore exposure due to import-linked GST liabilities, redirecting focus to 5 MW–10 MW offshore machines better suited to funded pilot rounds.
Independent power producers are consolidating to finance repowering and hybrid storage. JSW Energy’s USD 750 million purchase of Mytrah’s 2.1 GW fleet created the country’s third-largest wind operator and unlocked 800 MW of repowering-eligible assets. ReNew Power operates 3.7 GW of wind, Adani Green Energy holds 1.4 GW, and Greenko surpasses 3 GW, collectively steering turbine procurement toward larger 4 MW–5 MW models that reduce capex per MW. Data-center PPAs have encouraged innovative combinations such as Amazon’s 250 MW hybrid in Karnataka and Adani’s 302 MW wind-solar-storage complex in Kutch, each achieving availability metrics of 80-85%.
Technological differentiation increasingly counts. Suzlon’s digital-twin platform predicts failures 30 days ahead and has reduced unplanned downtime by 40%, preserving 5 percentage points of capacity factor across its O&M base. Inox Wind’s 3.3 MW turbine achieves 36% capacity utilization in Rajasthan, 8 points above state averages, by combining a 137 m rotor with advanced pitch control. Amp Energy’s software-enabled PPAs integrate rooftop solar and demand-response to undercut utility tariffs below Rs 4 per kWh (USD 0.048 per kWh). These moves intensify competition and raise the industry’s technology bar.
India Wind Energy Industry Leaders
Suzlon Energy Limited
Vestas Wind Systems A/S
Siemens Gamesa Renewable Energy
Inox Wind Limited
GE Renewable Energy
- *Disclaimer: Major Players sorted in no particular order

Recent Industry Developments
- May 2025: KK Wind Solutions inaugurated a 24,000 m² converter and control-system plant in Bengaluru, employing 250 staff and planning to expand to 400.
- May 2025: Suzlon Energy posted a 377% surge in Q4 FY25 net profit to ₹11.81 billion and confirmed a 4,500 MW domestic manufacturing base.
- April 2025: MNRE released draft revised guidelines granting three-year prototype-certificate validity for new turbine designs.
- March 2025: ONGC-NTPC Green acquired Ayana Renewable Power for ₹195 billion, adding 4.1 GW of assets to its portfolio.


Research Methodology Framework and Report Scope
Market Definitions and Key Coverage
Our study defines the India wind energy market as all new grid-connected onshore and offshore wind projects commissioned within the country, measured in installed megawatts and the associated capital outlay. We also regard repowering of turbines above 250 kW, when it adds fresh nameplate capacity, as part of the addressable pool.
Scope exclusion: micro and pico turbines below 10 kW and any overseas capacity owned by Indian developers are kept outside this assessment.
Segmentation Overview
- By Location
- Onshore
- Offshore
- By Turbine Capacity
- Up to 3 MW
- 3 to 6 MW
- Above 6 MW
- By Application
- Utility-scale
- Commercial and Industrial
- Community Projects
- By Component (Qualitative Analysis)
- Nacelle/Turbine
- Blade
- Tower
- Generator and Gearbox
- Balance-of-System
Detailed Research Methodology and Data Validation
Primary Research
Mordor analysts interviewed turbine manufacturers, EPC contractors, state transmission planners, and large corporate off-takers across Gujarat, Tamil Nadu, Rajasthan, and Karnataka. The conversations clarified real project lead times, typical capacity-utilization factors, land-lease costs, and emerging offshore tariff expectations, letting us refine assumptions that pure desk work leaves open.
Desk Research
We started with public datasets that anchor capacity and investment trends, such as MNRE monthly renewable dashboards, CEA Generation Mix books, IRENA Renewable Statistics, and state nodal-agency tender logs. Trade-body briefs from GWEC, National Institute of Wind Energy studies, and peer-reviewed papers on turbine class performance supplied resource factors and repowering ratios. Company filings, stock-exchange releases, and news archives inside Dow Jones Factiva allowed us to benchmark project costs and corporate pipelines. To cross-verify flows of imported towers, nacelles, and blades, our team accessed Directorate General of Commercial Intelligence and Statistics shipment codes through Volza and drew on D&B Hoovers for balance-sheet clues of tier-1 OEMs. These sources illustrate the breadth, not the totality, of references consulted; many more publications informed our fact-base.
Market-Sizing & Forecasting
Our capacity model begins with MNRE state-level installation data and augments it through a top-down production and trade reconstruction for imported major components, which is then checked with selective bottom-up supplier roll-ups. Key variables like annual auction awards, average turbine rating, capacity-utilization factors, tariff ceilings, grid-evacuation milestones, and repowering take-up drive yearly additions. Forecasts lean on multivariate regression that links those drivers to commissioning patterns and are stress-tested against expert consensus gathered above. Gap pockets, like incomplete data from open-access projects, are bridged using sampled ASP × volume evidence from corporate disclosures.
Data Validation & Update Cycle
Outputs pass a two-step review where senior analysts probe anomalies and variance against historical curves; material deviations trigger call-backs to industry respondents. Reports refresh every twelve months, and an interim sweep is issued if policy, currency, or tender shocks shift the baseline.
Why Mordor's India Wind Energy Baseline Inspires Investor Confidence
Published figures often differ because firms pick varying scopes, currency bases, and refresh cadences. By anchoring on MNRE-verified installations and layering only observable investment signals, we keep our starting line realistic.
Benchmark comparison
| Market Size | Anonymized source | Primary gap driver |
|---|---|---|
| 58 GW installed capacity (2025) | Mordor Intelligence | - |
| 49.8 GW (2024) | Global Consultancy A | counts legacy micro units and stops at FY-24, limiting forward view |
| 122 GW (2030) | Industry Association B | projects technical potential under optimistic policy uptake, omits grid bottleneck risk |
Differences show that when scope or scenario shifts, numbers swing widely. Mordor's disciplined variable selection and annual reality checks give decision-makers a balanced, transparent baseline they can retrace with ease.


Key Questions Answered in the Report
How large is the India wind energy market in 2026?
The installed capacity reaches 59.5 GW in 2026 and is projected to double to 119.5 GW by 2031.
Which states add the most new wind capacity?
Gujarat, Tamil Nadu, and Karnataka led 2024 additions, together accounting for more than 70% of incremental installations.
What CAGR is expected for onshore wind through 2031?
Onshore installations are forecast to post a 14.9% CAGR during 2026-2031.
When will offshore wind projects come online?
The first 1 GW, split between Gujarat and Tamil Nadu, is expected to reach commercial operation after the 2027 grid link is commissioned.
What drives the shift to 3 MW–6 MW turbines?
Repowering mandates and the need for higher capacity factors push developers toward larger machines that lower levelized energy costs.
How are data centers procuring renewable power?
Operators sign 10-15 year corporate PPAs for wind-solar hybrids paired with storage, ensuring 80-85% annual availability without reliance on DISCOM banking.
Page last updated on:


