
Home Audio Market Size and Share
Market Overview
| Study Period | 2020 - 2031 |
|---|---|
| Market Size (2026) | USD 43.2 Billion |
| Market Size (2031) | USD 71.69 Billion |
| Growth Rate (2026 - 2031) | 10.66 % |
| Fastest Growing Market | Asia-Pacific |
| Largest Market | North America |
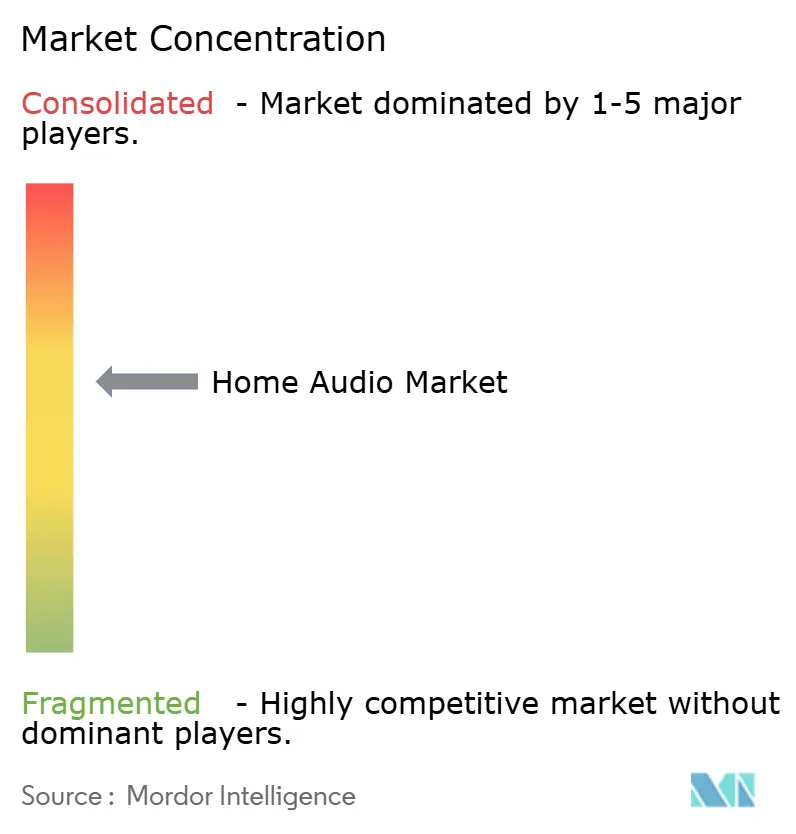
| Market Concentration | Medium |
Major Players *Disclaimer: Major Players sorted in no particular order Image © Mordor Intelligence. Reuse requires attribution under CC BY 4.0. | |
Home Audio Market Analysis by Mordor Intelligence
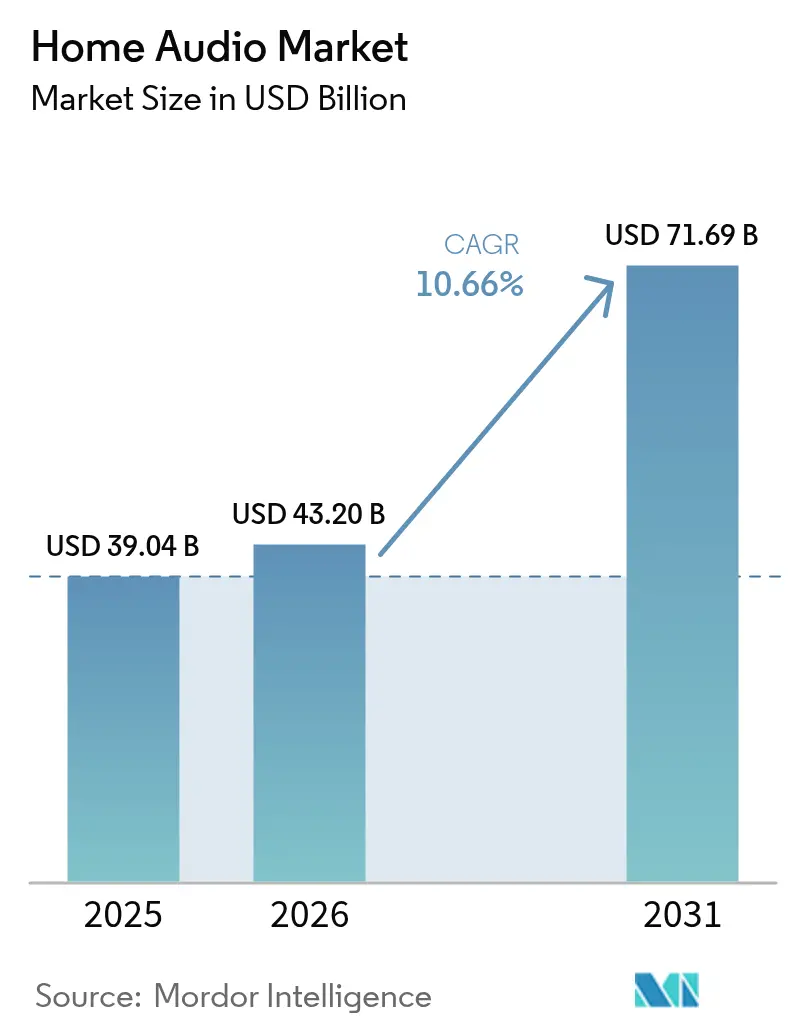
The home audio market size is expected to grow from USD 39.04 billion in 2025 to USD 43.2 billion in 2026 and is forecast to reach USD 71.69 billion by 2031 at 10.7% CAGR over 2026-2031. Strong demand for richer, more immersive listening experiences, the rapid integration of generative AI into voice-enabled devices, and wider availability of spatial-audio formats are the main growth engines. Wireless connectivity improvements, particularly Bluetooth LE Audio and Wi-Fi 6E, are closing historic quality gaps with wired systems while simplifying installation. Brands are fast-tracking direct-to-consumer strategies to capture higher margins and gather usage data that can refine product roadmaps. Meanwhile, semiconductor supply-chain turbulence and emerging privacy mandates around always-on microphones challenge production planning, especially for smaller manufacturers.
Key Report Takeaways
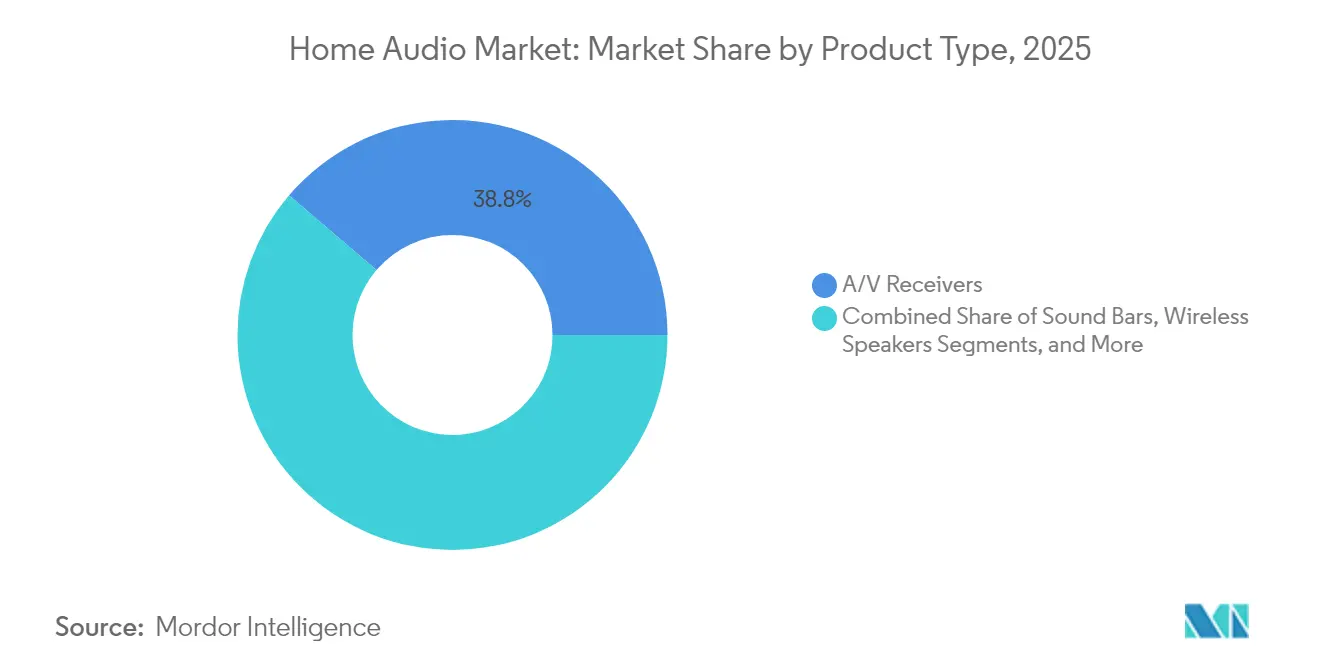
- By product type, A/V receivers held the largest 38.75% home audio market share in 2025, while wireless speakers are expanding at an 11.1% CAGR through 2031.
- By technology, wireless solutions accounted for 65.85% of the home audio market size in 2025 and are projected to grow at a 11.85% CAGR.
- By distribution channel, online e-commerce commanded 51.95% revenue share in 2025, while direct-to-consumer sales recorded the fastest 11.55% CAGR.
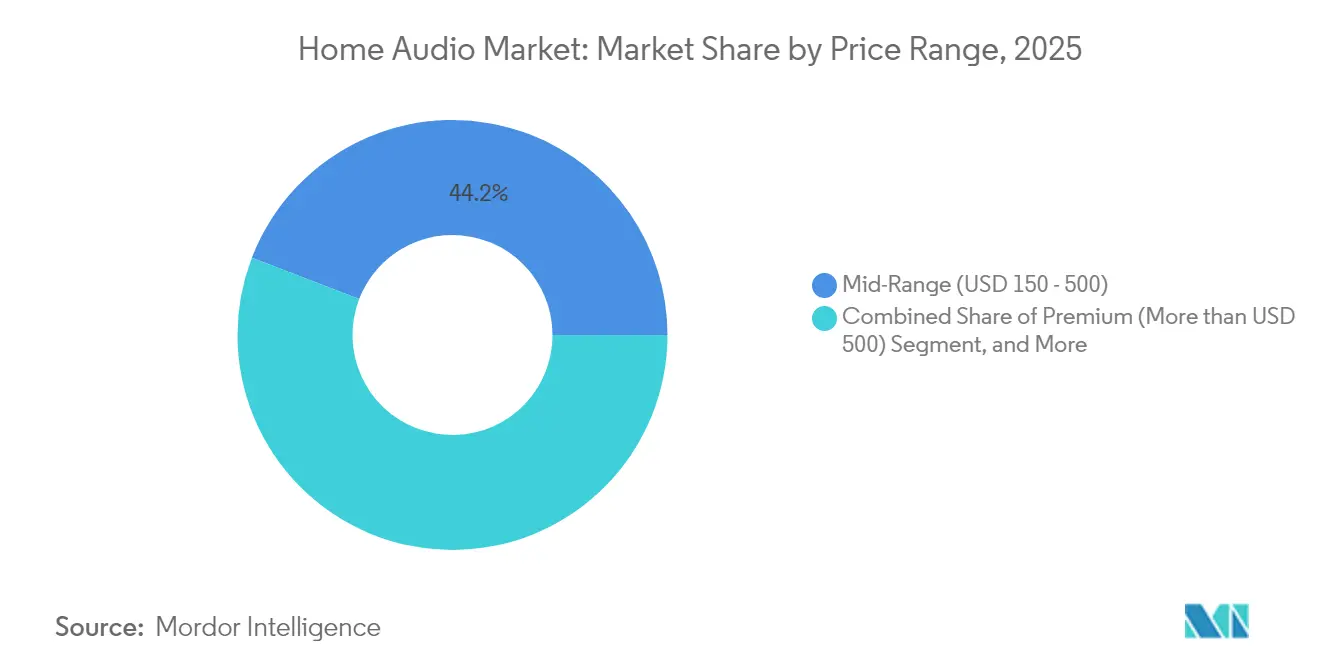
- By price range, mid-range systems dominated with 44.15% share in 2025; the premium tier above USD 500 is set to rise at a 12.05% CAGR.
- By end user, residential applications accounted for 75.55% of the home audio market size in 2025 and are advancing at a 11.95% CAGR.
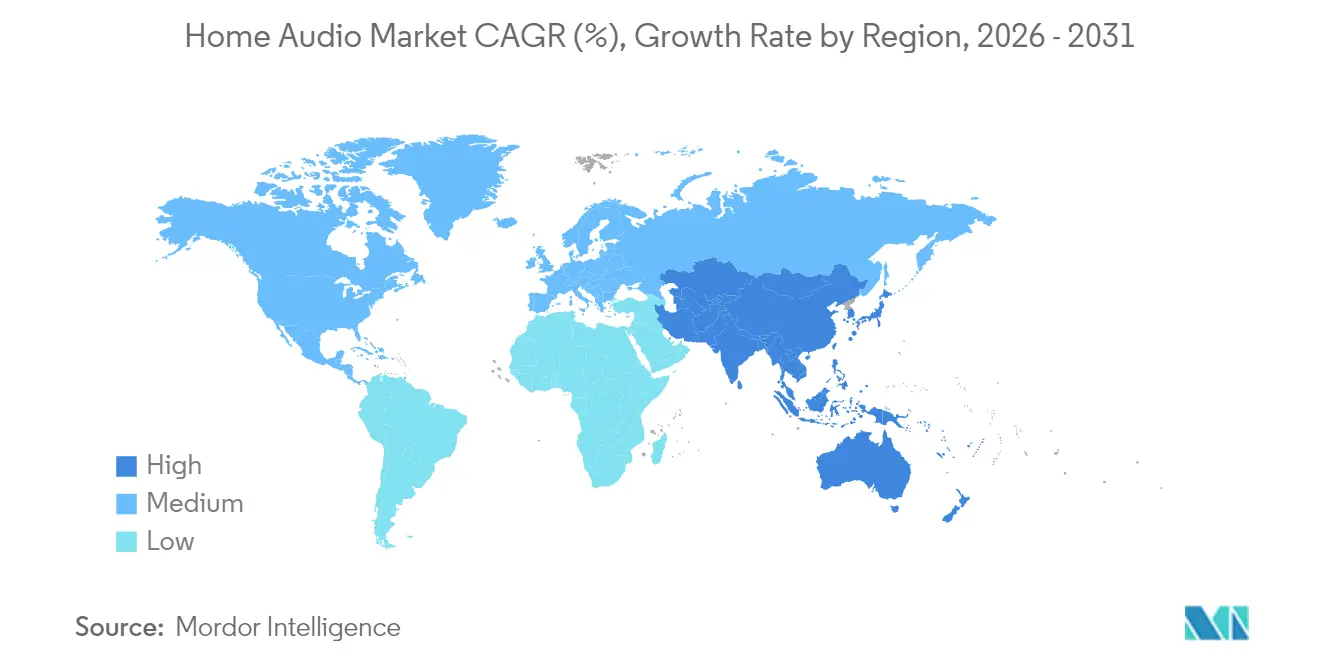
- By geography, North America led with a 31.35% share in 2025, but Asia-Pacific is growing quickest at an 11.35% CAGR through 2031.
Note: Market size and forecast figures in this report are generated using Mordor Intelligence’s proprietary estimation framework, updated with the latest available data and insights as of 2026.
Market Trends and Insights
Drivers Impact Analysis of Home Audio Market*
| Driver | (~) % Impact on CAGR Forecast | Geographic Relevance | Impact Timeline |
|---|---|---|---|
| AI-enabled smart speakers | +2.8% | Global; strongest in North America and Asia-Pacific | Medium term (2-4 years) |
| Immersive spatial-audio formats | +2.1% | North America and EU today; expanding into Asia-Pacific | Long term (≥ 4 years) |
| Declining MEMS microphone pricing | +1.4% | Global manufacturing; largest benefit in Asia-Pacific | Short term (≤ 2 years) |
| Bundled music-streaming and hardware plans | +1.6% | North America and Europe; emerging in Asia-Pacific | Medium term (2-4 years) |
| Smart-home interoperability mandates | +1.2% | Global; regulatory leadership in EU and California | Long term (≥ 4 years) |
| Gaming and e-sports audio demand | +1.7% | North America, Europe, and East Asia | Medium term (2-4 years) |
| Source: Mordor Intelligence | |||
Proliferation of AI-Enabled Smart Speakers
Generative AI shifts voice control from scripted commands to contextual conversation, raising replacement demand in the home audio market as users seek devices that understand intent and nuance. Amazon’s Alexa Plus showcases this transition yet still reveals accuracy gaps that limit full trust.[1]Jay Peters, “24 Hours with AChris Welch, “A First Look at Dolby FlexConnect,” The Verge, theverge.comlexa Plus,” The Verge, theverge.com Google’s migration from Assistant to Gemini underscores a broader recognition that legacy stacks lack the processing muscle for multimodal AI. Device makers now integrate more powerful edge-AI chips, which increase bill-of-materials cost but unlock premium pricing and recurring revenues from AI feature subscriptions. Competitive intensity accelerates as ecosystem giants leverage vast data assets to personalize audio experiences. Consumers respond favorably, evidenced by a steady rise in smart-speaker replacement cycles across North America and East Asia.
Integration of Immersive Spatial-Audio Formats
Dolby Atmos and DTS:X are no longer confined to high-end home theaters; their support now appears in mid-priced TVs, sound bars, and even true wireless earbuds, broadening mass-market exposure. Eight of every ten domestic box-office releases in 2024 shipped with Dolby mixing, setting new consumer expectations for cinematic sound quality at home. Dolby’s FlexConnect, debuting in TCL’s 2024 televisions, auto-calibrates wireless speakers to eliminate historical setup pain points.[2] Yet manufacturers face difficult codec-licensing decisions, highlighted by LG’s move to drop DTS support to trim royalties. Automotive deployments, such as Cadillac’s 2026 electric lineup, further normalize spatial audio, indirectly boosting residential demand as consumers grow accustomed to 3D sound on daily commutes.
Rapid Decline in Component Pricing for MEMS Microphones
Volume production and design advances have pushed MEMS microphone prices down, letting even entry-level devices add far-field voice pickup without breaking cost targets. Infineon’s XENSIV line demonstrates higher signal-to-noise ratios while meeting ever-smaller footprint demands. SonicEdge’s integrated speaker-microphone module, sampled in late 2024, hints at true wireless earbuds that balance active noise cancellation and battery life. Lower component pricing coincides with edge-AI inference engines, encouraging always-on listening modes that support hands-free controls. The combined effect widens adoption in the home audio market, especially in Asia-Pacific where device manufacturers leverage regional supply-chain strengths.
Bundled Music-Streaming and Hardware Subscription Models
Retailers and service platforms view high-fidelity audio as a churn-reduction lever. Walmart+ added Apple Music access for members, aligning with bundled strategies that lock households into broader service ecosystems. Spotify’s pending HiFi tier, expected near USD 19.99 monthly, shows how lossless audio can justify premium pricing even when rivals offer similar quality at baseline plans.[3]Chris Welch, “Spotify HiFi Tier Details Surface,” The Verge, theverge.com Research reveals bundled subscribers interact less frequently than music-only users but still generate reliable recurring revenue that offsets higher acquisition costs. Hardware makers seize the model by spreading device payments across multi-year service contracts, easing premium-price resistance in the home audio market.
Restraints Impact Analysis of Home Audio Market*
| Restraint | (~) % Impact on CAGR Forecast | Geographic Relevance | Impact Timeline |
|---|---|---|---|
| Semiconductor supply-chain volatility | −1.8% | Global; acute in Asia-Pacific manufacturing hubs | Short term (≤ 2 years) |
| Fragmented licensing for next-gen codecs | −0.9% | Global; highest cost for premium equipment makers | Medium term (2-4 years) |
| Privacy concerns around always-on mics | −1.1% | EU and California lead regulation; global consumer awareness | Long term (≥ 4 years) |
| Rising e-waste compliance costs | −0.7% | EU leadership; expanding to Asia-Pacific | Long term (≥ 4 years) |
| Source: Mordor Intelligence | |||
Global Semiconductor Supply-Chain Volatility
Extended lead times for critical chips force design revisions that delay product launches in the home audio market, especially for smaller firms that lack purchasing clout. Component cycles stretched beyond six months during 2024, and single-source raw materials such as high-purity quartz remain vulnerable to climate events. China’s rare-earth export limits put magnet supplies at risk, threatening over 21,000 jobs in India’s audio sector and sparking interest in lower-performance ferrite substitutes. Companies hedge by multi-sourcing silicon and stockpiling, but the result is higher working-capital needs that compress margins.
Consumer Privacy Concerns Around Always-On Microphones
Legislative scrutiny intensifies as consumers question continuous listening devices, with researchers proposing on-device speech filtering to keep private conversations from cloud servers. Legal scholars frame passive eavesdropping as a modern public nuisance, implying potential class-action risks that could alter device architectures.[4]Vanderbilt Law Review Editors, “Eavesdropping: The Forgotten Public Nuisance,” vanderbilt.edu Manufacturers counter with local AI processing and LED indicators that clarify when mics are live, yet trust gaps persist. The home audio market must therefore juggle user convenience with robust privacy assurances, a balance that adds engineering cost and can slow adoption in highly regulated regions.
*Our forecasts treat driver/restraint impacts as directional, not additive. The impact forecasts reflect baseline growth, mix effects, and variable interactions.
Home Audio Market Segment Analysis
By Product Type:
A/V Receivers Hold Ground While Wireless Speakers SurgeA/V receivers accounted for 38.75% of the home audio market size in 2025, making them the single largest category. Enthusiasts value their calibration features, multiple HDMI inputs, and high-current amplification that anchors dedicated surround systems. Growth trends, however, favor wireless speakers that post an 11.1% CAGR through 2031 as households opt for compact, cable-free setups. Voice-assistant integration, automatic room tuning, and easier multi-room pairing help wireless units reach casual buyers who previously avoided complex installations.
The coexistence of both segments signals bifurcation in the home audio market. Audiophile consumers still embrace receivers for flexibility, while mainstream users gravitate toward sound bars and smart speakers. Newer sound bars incorporate upward-firing drivers for Dolby Atmos, blurring lines with entry-level surround systems. Shelf systems and docks now serve niche listeners, yet their inclusion of lossless streaming, phono inputs, and high-quality DACs keeps them relevant. Accessory DACs and headphone amplifiers in the “Others” sub-segment cater to hobbyist tinkerers seeking audible gains from existing gear.



By Technology:
Wireless Dominance Becomes StructuralWireless solutions represented 65.85% of the home audio market share in 2025 and will grow at a 11.85% CAGR. Bluetooth LE Audio cuts latency and enables synchronized playback on multiple speakers, meeting the demands of gamers and party hosts alike. Wi-Fi 6E delivers higher bandwidth and less congestion, important for lossless and spatial streams. Brands also explore Ultra-Wideband for precise speaker positioning that enhances auto-calibration routines.
Wired systems retain loyalists among studio engineers and purist listeners who prioritize low jitter and zero compression. These users often pair balanced connections with external DACs to drive reference headphones or passive speakers. Even so, hybrid platforms now let wired speakers receive wireless signals via hub adapters, bridging convenience and fidelity. Multi-protocol chips reduce bill-of-materials and simplify firmware updates, facilitating future-proof designs across the home audio market.
By Distribution Channel:
E-Commerce Leads, D2C AcceleratesOnline e-commerce captured 51.95% of 2025 revenue as shoppers appreciate broad catalogs, transparent pricing, and fast delivery. Video reviews and virtual try-on tools further lift conversion rates. Direct-to-consumer storefronts, while still smaller in absolute terms, expand at an 11.55% CAGR on the promise of richer margins and direct data pipelines. Subscription bundles, combining speakers, streaming access, and service warranties, anchor many D2C strategies.
Traditional big-box chains lean on in-store demos to remain relevant, especially for premium systems where sonic audition matters. Specialty audio dealers pivot toward concierge services like room acoustics consultation and custom installation, building loyalty with enthusiast segments. An omnichannel approach that fuses quick online checkouts with post-sale calibration visits emerges as the winning blueprint in the home audio market.
By Price Range:
Premium Tier Pulls Ahead Despite Mid-Range DominanceMid-range devices priced USD 150-500 controlled 44.15% of the market in 2025, but the premium bracket above USD 500 is on track for a 12.05% CAGR, outpacing all other tiers. Gamers, streamers, and work-from-home professionals consistently pay extra for spatial audio, adaptive noise cancellation, and better build materials. Hardware-service bundles reduce upfront sticker shock, letting households finance premium purchases over multi-year contracts tied to music subscriptions.
Entry-level products below USD 150 face squeezed margins due to higher feature expectations like Bluetooth 5.3 and voice integration. Brands try to preserve profitability through regional manufacturing and component commonality. The luxury niche, units above USD 5,000, grew 12% in 2023 to roughly USD 2.8 billion and attracts newcomers such as Bose following its McIntosh Group purchase. While volumes stay modest, the halo effect of flagship gear lifts brand equity across price bands in the home audio market.
By End User:
Residential Keeps Its Lead While Commercial Spend RisesResidential buyers made up 75.55% of 2025 demand and will maintain the highest 11.95% CAGR through 2031. Hybrid work trends push households to upgrade microphone clarity and speaker intelligibility for conference calls. The Matter protocol promises cross-brand interoperability, although early implementations still suffer teething challenges. Gaming chairs with embedded drivers and low-latency wireless hubs illustrate how product forms evolve to embed audio more intimately into leisure settings.
Commercial installations seek robustness and remote management over voice-assistant novelty. Hotels deploy sound bars with automatic volume leveling to avoid guest complaints, while offices invest in beamforming speakerphones for huddle rooms. Recording studios and content creators demand extreme accuracy and are willing to pay premiums for reference monitors and acoustically treated environments. Though smaller in volume, commercial upgrades often involve higher unit prices, sustaining supplier margins in the home audio market.
Geography Analysis
APAC Home Audio Market
Asia-Pacific shows the fastest 11.35% CAGR thanks to rising disposable income, smart-home enthusiasm, and a burgeoning middle class. China posted 28.4% music-market expansion in 2024, underpinned by paid streaming growth, while India targets USD 300 billion in consumer-electronics output by 2026. Local manufacturing of TWS earbuds reached a 16% unit share in Q2 2024, shortening supply chains and lowering entry-level prices. Japan contributes innovation leadership through Sony, which maintained a 27% recorded-music share and industry-leading 19.7% margins in 2024.
North America Home Audio Market
North America led with 31.35% market share in 2025, supported by high average selling prices and an entrenched home-theater culture. E-commerce maturity encourages brand experimentation with D2C portals posting 11.55% CAGR across the forecast. Gaming continues to propel premium headset and sound-bar sales, while California privacy rules shape microphone design choices nationwide. Consumers display replacement cycles of three to four years, shortened by AI-enabled features that make earlier models feel dated.
Europe Home Audio Market
Europe balances heritage audio craftsmanship with strict environmental policy. The EU’s updated Battery Regulation and broader e-waste directives push OEMs to adopt modular, repairable architectures. Circular-economy principles, already two decades in the making, gain urgency as global e-waste could hit 82 million tons by 2030. European buyers value authenticity and provenance, keeping artisanal brands like Sonus Faber relevant. These dynamics preserve premium price elasticity, supporting steady growth even as overall volumes plateau in mature Western markets.

Regulatory Landscape
Home audio equipment sits at the intersection of electrical safety, wireless/radio compliance, and cybersecurity and privacy obligations for connected devices. A key anchor is the publication of IEC 62368-1:2026 for audio/video and ICT equipment safety. That publication triggers new testing and documentation cycles across OEM portfolios and creates a compliance milestone by March 31, 2027 for exporters selling into markets that adopt the standard.
Regionally, wireless home audio products must clear radio equipment authorization regimes such as the FCC equipment authorization framework in the United States and national wireless rules elsewhere. In the EU, the Radio Equipment Directive framework has been updated via the Common Charger Directive (Directive (EU) 2022/2380), with an application date of April 28, 2026 for relevant categories of radio equipment. This shifts OEMs toward standardized charging interfaces and packaging configurations for powered wireless speakers and sound bars sold in the region.
Value Chain Analysis
The value chain begins with component suppliers (audio SoCs/DSPs, power ICs, wireless chipsets, MEMS microphones, drivers and magnets, batteries, and mechanicals). It then moves through ODM/OEM design, acoustic tuning, firmware and app development, and into certification (safety, EMC, and radio) plus final assembly. Upstream risk concentrates in semiconductors and magnet materials, since supply volatility can force redesigns and multi-sourcing, while rare-earth constraints can ripple into driver availability and pricing.
Midstream differentiation increasingly comes from software layers, including multi-room synchronization, voice and AI features, spatial-audio processing, and OTA update pipelines. These capabilities depend on interoperability profiles and home-network standards. Downstream, online e-commerce and direct-to-consumer channels make up the majority of 2025 revenue mix in the report, with D2C the fastest-growing route, which shortens launch cycles and raises the importance of reverse logistics, warranty servicing, and firmware support. Specialty retail and installers remain relevant for premium home theater bundles where demos and setup services influence conversion.
Competitive Landscape
The home audio market exhibits moderate fragmentation but shows an accelerating tilt toward consolidation as technology conglomerates buy legacy audio specialists. Samsung’s Harman sealed a USD 350 million deal for Denon, Marantz, and Bowers & Wilkins in January 2025, bolstering its premium speaker and A/V receiver lines. Bose moved into the ultra-luxury tier by acquiring McIntosh Group, gaining high-end brands like Sonus Faber and Sumiko. Gentex plans to fold Klipsch and Onkyo into its automotive mirror and sensor portfolio, highlighting cross-sector synergies.
R&D competition now revolves around spatial audio algorithms, ultra-low-latency wireless stacks, and AI personalization engines. Apple’s forthcoming HomePod 3 is expected to marry Wi-Fi 6E with enhanced beamforming for immersive playback, aiming to retain ecosystem stickiness. Amazon and Google pivot from voice commands to generative dialog systems, betting that software innovation will drive fresh hardware cycles. Patent filings show Samsung, LG, and Sony investing heavily in VVC video codec research that also influences multi-channel audio transport.
Direct-to-consumer disruptors leverage subscription bundles that merge hardware amortization with streaming access. Brands adopting this model gain granular usage data, enabling iterative firmware improvements and upsell opportunities. However, rising component costs and privacy regulations add compliance complexity, favoring well-capitalized incumbents. Net-net, competitive intensity remains high as players chase ecosystem lock-in and premium share within the evolving home audio market.
Home Audio Industry Leaders
Sonos, Inc.
Sony Corporation
Bose Corporation
Samsung Electronics, Co. Ltd.
Apple Inc.
- *Disclaimer: Major Players sorted in no particular order
Home Audio Market Companies Covered in this Report
- Amazon.com Inc.
- Google LLC
- Apple Inc.
- Samsung Electronics Co., Ltd.
- Sony Group Corporation
- Sonos Inc.
- Bose Corporation
- Yamaha Corporation
- LG Electronics Inc.
- Harman International Industries (JBL)
- Bowers & Wilkins (Sound United)
- Denon Holdings Corp.
- Klipsch Audio Technologies
- Vizio Inc.
- Bang & Olufsen A/S
- Onkyo Corporation
- Dynaudio A/S
- Polk Audio LLC
- Pioneer Corporation
- Boston Acoustics Inc.

Market Opportunities and Future Outlook
Connectivity and interoperability are creating whitespace for multi-brand, multi-room home audio systems that operate more like smart-home infrastructure than standalone speakers. A 2026 signal comes from the Connectivity Standards Alliance announcing Matter 1.6 with Joint Fabric, intended to let a single home network be managed across multiple ecosystems, notably Apple, Amazon, and Google. That approach can broaden addressability for wireless speakers and sound bars positioned as interoperable endpoints rather than locked to one platform.
Premiumization and software-led value capture also support bundled hardware plus services models. OEMs pair higher-end sound bars, speakers, and receivers with streaming access, setup tools, and ongoing feature upgrades. This direction is reinforced by market actions including Harman acquiring the Roon music-management platform in July 2025, alongside major brands shipping platforms that emphasize open streaming compatibility such as Apple AirPlay and Spotify Connect.
Recent Industry Developments in Home Audio Market
- June 2026: Bose acquired StreamUnlimited Engineering GmbH, a provider of streaming software and hardware modules used in connected audio products. The deal increases Bose's in-house control over core streaming and certification building blocks that increasingly shape time-to-market for smart speakers and sound bars. It also supports tighter integration between Bose hardware and the underlying software stack needed for multi-room and service interoperability.
- July 2025: Harman International acquired the Roon music-management platform while retaining Roon as a standalone operation. The acquisition expands Harman's software footprint in high-fidelity streaming and library management, complementing its premium home audio portfolio across receivers and speakers. It also indicates continued consolidation around platforms that can influence user experience beyond the physical device.
- February 2024: Sony WH-1000XM6 headphones with enhanced spatial processing. This release illustrates the broader shift toward spatial-audio capabilities that affect home listening expectations and content consumption across adjacent audio categories.


Home Audio Market Report Scope and Research Methodology
Market Definition and Coverage
This market covers revenue generated from home audio devices used to play or amplify sound in home entertainment setups. It includes categories such as receivers, Hi-Fi systems, sound bars, and speakers, across major regions and sales channels.
Scope exclusions: Professional audio gear for concerts and studios, automotive audio systems, and headphones or earbuds are excluded from this market sizing.
Segments Covered in This Report
- By Product Type
- A/V Receivers
- Hi-Fi Systems and Shelf-Systems
- Sound Bars
- Wireless Speakers
- Bluetooth / Wi-Fi Speakers
- Smart Speakers (with VA)
- Dedicated Docks and Audio Stations
- Others (DACs, Amplifiers)
- By Technology
- Wired
- Wireless (Wi-Fi, Bluetooth, Zigbee, UWB)
- By Distribution Channel
- Online E-commerce
- Organized Retail Chains
- Specialty Audio Stores
- Direct-to-Consumer (D2C)
- By Price Range
- Entry-Level (< USD 150)
- Mid-Range (USD 150 - 500)
- Premium (> USD 500)
- By End User
- Residential
- Commercial (Hospitality, Offices, Studios)
- By Geography
- North America
- United States
- Canada
- Mexico
- South America
- Brazil
- Argentina
- Rest of South America
- Europe
- Germany
- United Kingdom
- France
- Italy
- Rest of Europe
- Asia-Pacific
- China
- Japan
- South Korea
- India
- Rest of Asia-Pacific
- Middle East
- Saudi Arabia
- United Arab Emirates
- Rest of Middle East
- Africa
- South Africa
- Rest of Africa
- North America
Data Sources, Market Sizing, and Validation
Desk Research
Desk work starts by mapping what gets counted as home audio revenue and where it appears in public datasets, so our categories stay consistent across countries and channels. We lean on non-paywalled sources such as UN Comtrade for trade flows, the US International Trade Commission for tariff and import context, the World Bank and IMF for macro indicators tied to consumer spending, and OECD statistics for household and retail signals in key economies.
To make the model practical, we also review company annual reports and investor presentations, product launch coverage from reputed press, and retailer and e-commerce disclosures when they include category clues such as price bands and promo timing. In addition, paid subscriptions for company financials and news intelligence, along with patent databases, are used selectively to confirm product mix shifts and technology adoption direction. The examples listed here are illustrative, and many other public sources were also referenced for data collection, validation, and clarification during the work.
Primary Interviews and Surveys
Primary work was used to pressure-test desk assumptions on what buyers actually pay and how volumes move by region, with particular emphasis on wireless speakers, sound bars, and receiver based setups. We spoke with manufacturers, distributors, retailers, and installers, then followed up with product and regional leaders to validate channel split, price band mix, and replacement cycle expectations across APAC, EMEA, and the Americas.
Distribution of primary research fieldwork respondents
| Company type | Respondent position | Region |
|---|---|---|
| Top tier: 39% | CXOs: 17% | APAC: 39% |
| Mid tier: 40% | Functional/Unit leaders: 34% | EMEA: 37% |
| Smaller Players: 21% | Managers: 49% | Americas: 24% |
Market-Sizing & Forecasting
The core sizing logic uses a top-down build where consumer electronics demand signals and country level sales capacity are reconstructed into a home audio revenue pool, then filtered into the included device set and channels. To keep totals grounded, we corroborate with selective bottom-up approximations, such as sampled average selling price (ASP) by product type multiplied by indicative shipment or sell-through ranges, followed by distributor and retailer channel checks.
Inputs that typically move the model include wireless versus wired mix shifts, price range movement between entry, mid-range, and premium, online versus offline channel share, regional replacement cycles for speakers and sound bars, and macro drivers like household consumption trends and inflation-adjusted discretionary spend. Where direct signals are weak in smaller countries, gaps are handled through proxy weighting from similar markets, then rechecked through interview feedback before being rolled into regional totals.
For forecasting, we use scenario analysis supported by simple multivariate relationships between demand and variables such as income trends, consumer electronics spending direction, and premiumization indicators from the channel. Assumptions on ASP progression and mix changes are reviewed with primary respondents so the forecast reflects what is realistic for promotions, feature upgrades, and adoption timing.
Data Validation & Update Cycle
Outputs are cross-verified against independent signals such as trade movement direction, public company revenue commentary, and region level demand patterns that should align with the model. Large variances trigger a step-back review of definitions, currency conversion timing, and price band assumptions, then follow-up calls are made when a mismatch cannot be explained with desk evidence.
Before sign-off, the model and narrative go through multi-step analyst review so calculation logic, assumptions, and growth drivers stay consistent across sections. Reports are refreshed annually, and interim updates are made when material events occur, such as sharp demand shifts, major product cycle changes, or supply disruptions. Right before delivery, we run a final check to ensure the latest public developments are reflected in the numbers and commentary.
Mordor Intelligence's Global Home Audio Market Size Measured Against Other Published Estimates
Published market values for home audio can look far apart because the scope line is not always drawn in the same place, and pricing and channel coverage assumptions vary by publisher. Differences also show up when one estimate emphasizes shipments and another emphasizes retail revenue, which changes how premium categories are reflected.
Headphones and earbuds are the most common add-on that inflates some totals, and that product group sits outside Mordor Intelligence's scope for this home audio market, which keeps the count focused on in-home playback systems like sound bars, receivers, and speakers. Gaps also come from how custom installation is treated, how online discounting is normalized into ASPs, and whether currency conversion uses an average year rate or a point-in-time rate.
Benchmark comparison
| Source | Market Size | Gaps in Research Methodology |
|---|---|---|
| Mordor Intelligence | USD 43.2 B (2026) | |
| Global Consultancy A | USD 39.7 B (2025) | Uses a prior base year and a narrower counted set that leans toward packaged home theater and sound bar revenue, which can understate multi-category speaker demand and some channel spillover. |
| Industry Publisher B | USD 33.0 B (2024) | Anchors the estimate to a high-level value point with limited visibility into price band mix and online discount effects, and it may blend adjacent audio device categories depending on how retail is classified. |
The spread across sources is mainly explained by category inclusion, year basis, and how ASP and channel mix are treated when translating demand into revenue. By keeping inputs traceable to clear product definitions and by rechecking price and channel assumptions through interviews, our estimate stays repeatable and easier to reconcile with observable market signals.


Key Questions Answered in the Report
What is the current Global Home Audio Market size?
The Global Home Audio Market is projected to register a CAGR of 10.66% during the forecast period (2026-2031)
Who are the key players in Global Home Audio Market?
Sonos, Inc., Sony Corporation, Bose Corporation, Samsung Electronics, Co. Ltd. and Panasonic Corporation are the major companies operating in the Global Home Audio Market.
Which is the fastest growing region in Global Home Audio Market?
Asia-Pacific is estimated to grow at the highest CAGR over the forecast period (2025-2030).
Which region has the biggest share in Global Home Audio Market?
In 2025, the North America accounts for the largest market share in Global Home Audio Market.
What years does this Global Home Audio Market cover?
The report covers the Global Home Audio Market historical market size for years: 2019, 2020, 2021, 2022, 2023 and 2024. The report also forecasts the Global Home Audio Market size for years: 2025, 2026, 2027, 2028, 2029 and 2030.
Page last updated on:


 Your data is secure and never sold or shared.


