Soundbar Market Size and Share
Market Overview
| Study Period | 2020 - 2031 |
|---|---|
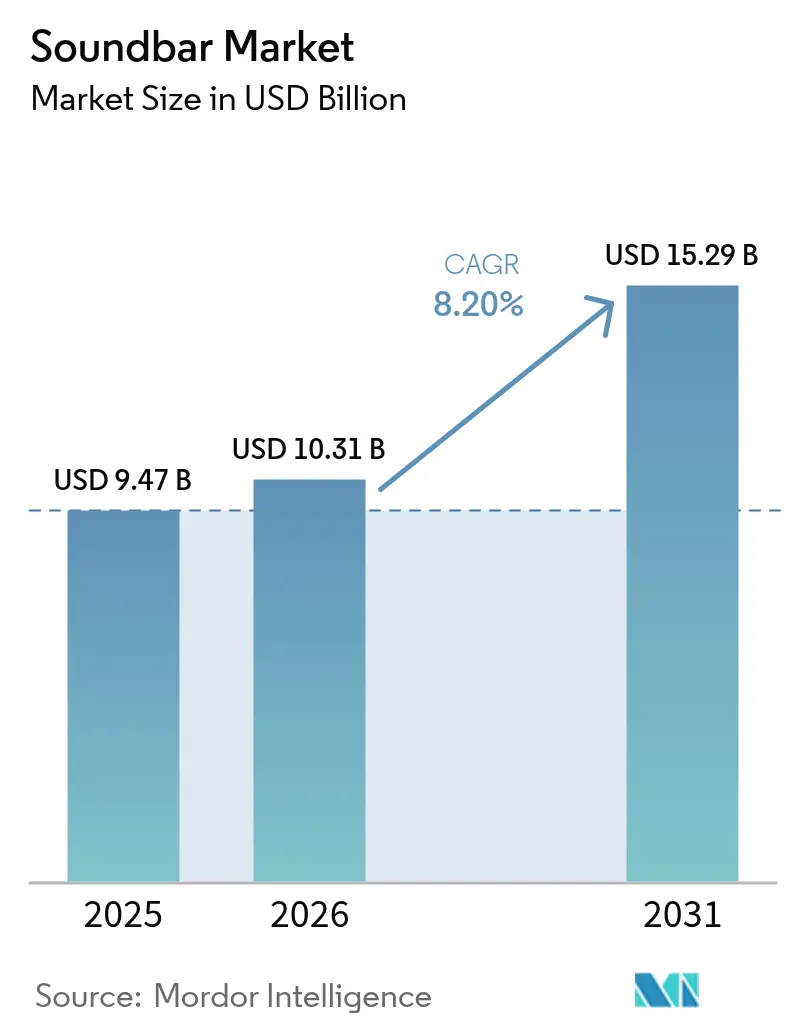
| Market Size (2026) | USD 10.31 Billion |
| Market Size (2031) | USD 15.29 Billion |
| Growth Rate (2026 - 2031) | 8.20% CAGR |
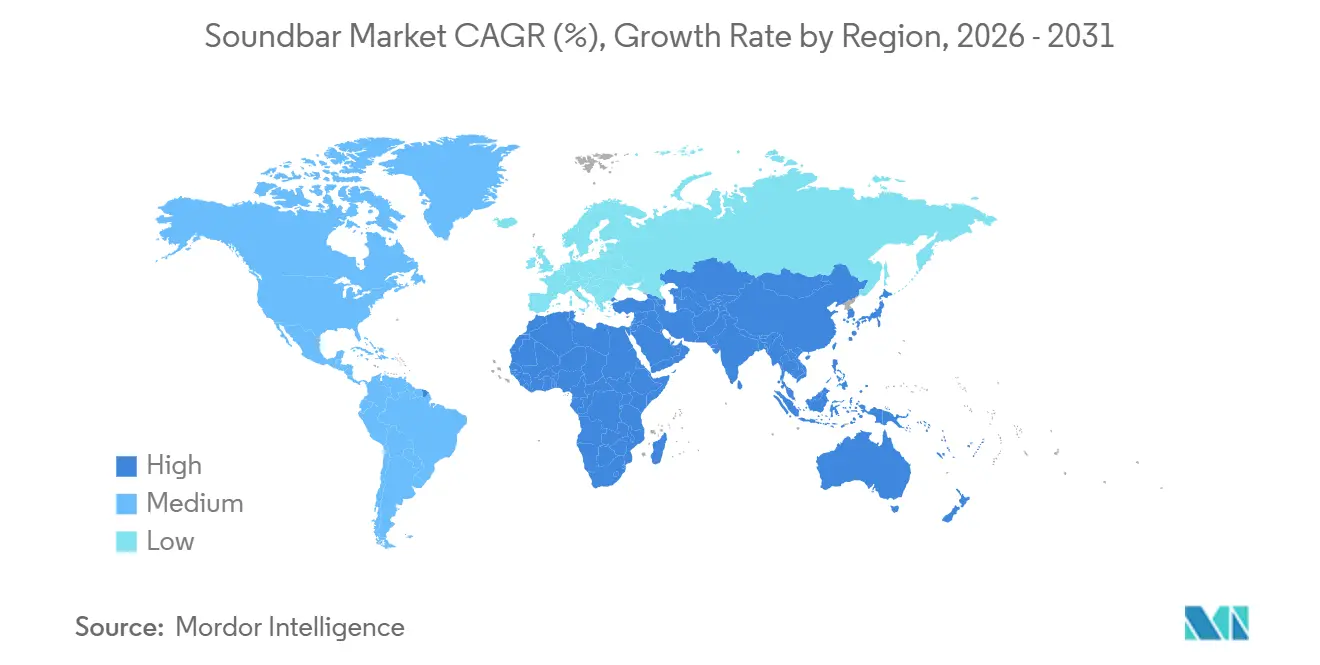
| Fastest Growing Market | Asia Pacific |
| Largest Market | North America |
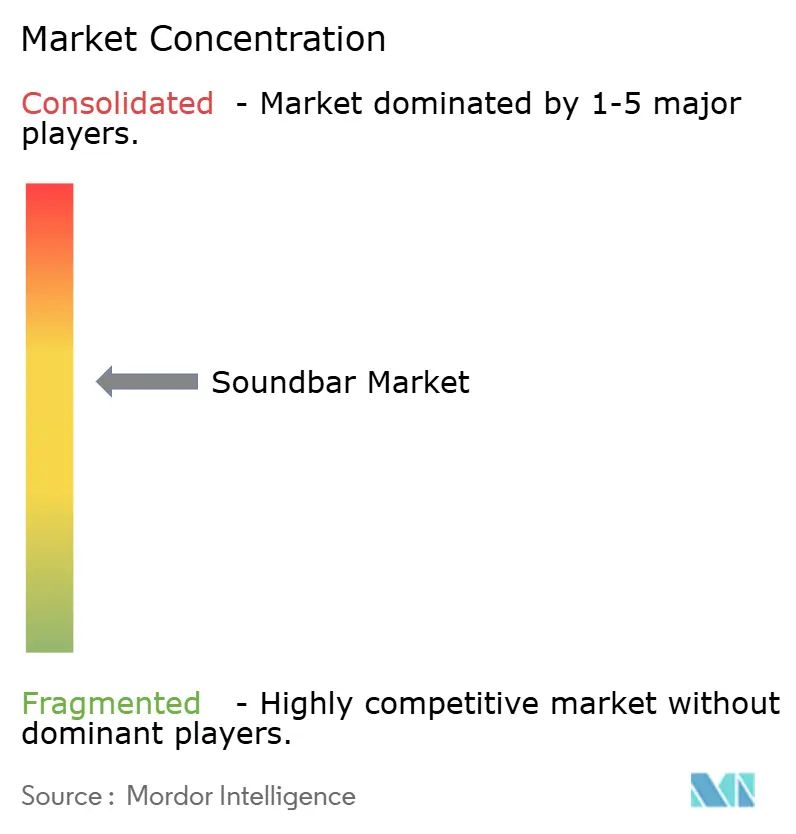
| Market Concentration | Medium |
Major Players *Disclaimer: Major Players sorted in no particular order Image © Mordor Intelligence. Reuse requires attribution under CC BY 4.0. | |
Soundbar Market Analysis by Mordor Intelligence
The soundbar market size was valued at USD 9.47 billion in 2025 and estimated to grow from USD 10.31 billion in 2026 to reach USD 15.29 billion by 2031, at a CAGR of 8.2% during the forecast period (2026-2031). Intensifying consumer migration to streaming services, rising smart-TV attach rates, and the rapid diffusion of immersive audio formats are turning the living room into a primary entertainment hub. Hardware design is evolving just as quickly: active models with integrated amplifiers reduce cable clutter, while wall-mount-friendly form factors answer minimalist décor trends. At the same time, commercial venues such as hotels, offices, and retail stores are replicating cinematic soundscapes to raise guest satisfaction, broadening the addressable base for vendors. Tariff-driven component inflation and price pressure from ultra-low-cost Asian original design manufacturers (ODMs), however, are squeezing margins and compelling established brands to lean on proprietary software and ecosystems for differentiation.
Key Report Takeaways
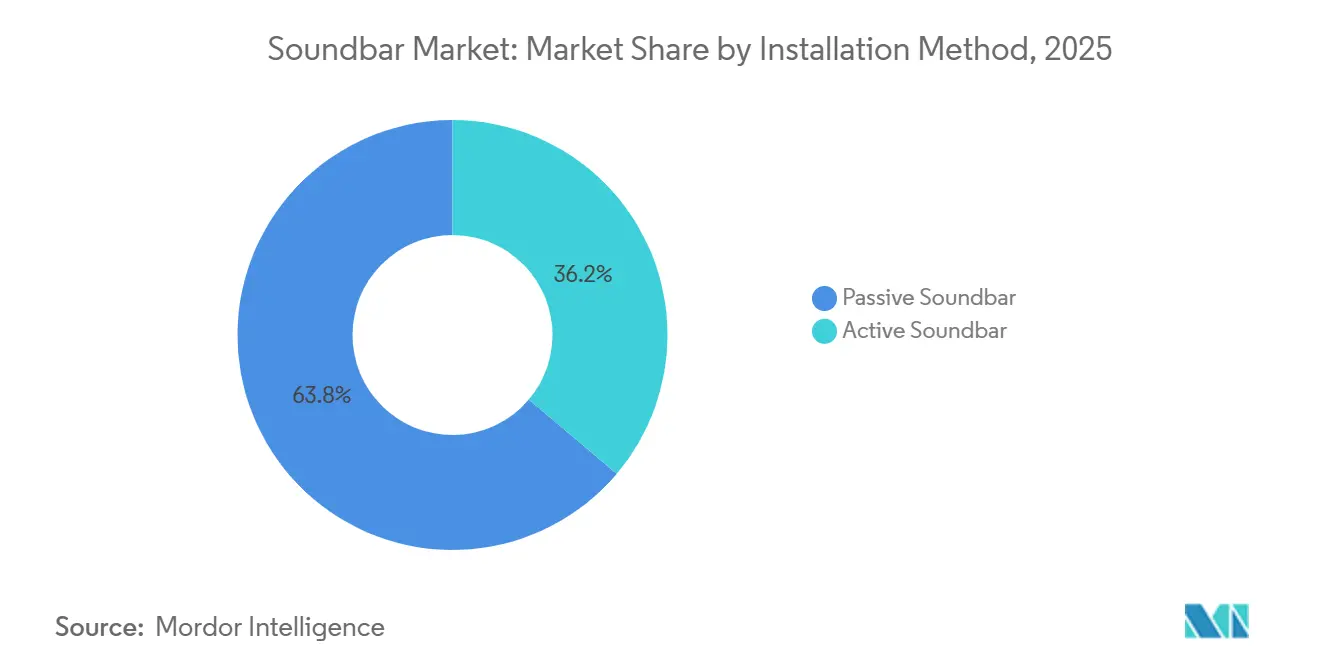
- By installation method, passive systems commanded 63.83% of the soundbar market share in 2025, while active designs are projected to expand at an 8.38% CAGR through 2031.
- By application, home audio accounted for 76.72% of the soundbar market size in 2025 and commercial deployments are forecast to advance at an 8.92% CAGR to 2031.
- By installation type, table-top units held 60.17% of the soundbar market share in 2025; wall-mounted solutions are set to grow at an 8.77% CAGR between 2026-2031.
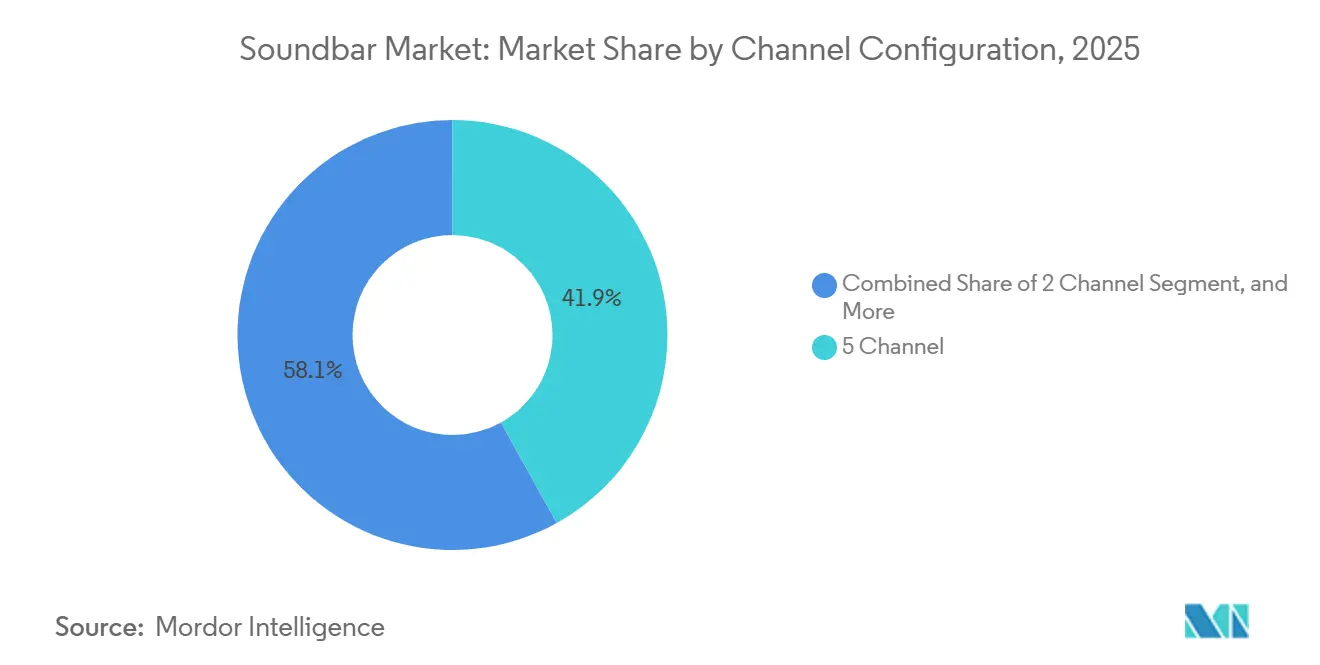
- By channel configuration, five-channel models led with 41.94% of the soundbar market size in 2025, whereas two-channel products should post the fastest 8.48% CAGR by 2031.
- By geography, North America captured 33.61% of the soundbar market share in 2025, while Asia-Pacific is poised for the highest 9.02% CAGR through 2031.
Note: Market size and forecast figures in this report are generated using Mordor Intelligence’s proprietary estimation framework, updated with the latest available data and insights as of 2026.
Global Soundbar Market Trends and Insights
Drivers Impact Analysis*
| Driver | (~) % Impact on CAGR Forecast | Geographic Relevance | Impact Timeline |
|---|---|---|---|
| Rising Demand for Wireless, Lossless Music Streaming | +1.5% | Global, early adoption in North America and Europe | Medium term (2-4 years) |
| Surge in Smart-TV Attach Rates Above 70% in Key Markets | +2.1% | North America, Europe, Asia-Pacific urban centers | Short term (≤ 2 years) |
| Preference for Minimalist Living-Room Aesthetics | +1.3% | North America and Europe, spill-over to Asia-Pacific premium segments | Medium term (2-4 years) |
| Pay-TV Operators Bundling Soundbars With Next-Gen Set-Top Boxes | +1.0% | North America and Europe | Short term (≤ 2 years) |
| Cinema Chain Upgrades to Immersive Audio | +0.9% | Global, concentrated in North America and Asia-Pacific | Long term (≥ 4 years) |
| EU Eco-Design Rules Favoring Single-Chassis Audio | +0.7% | Europe, indirect global influence | Medium term (2-4 years) |
| Source: Mordor Intelligence | |||
Rising Demand for Wireless, Lossless Music Streaming
Lossless streaming protocols are rewriting feature checklists as households expect seamless playback of Spotify, Apple Music, and Tidal directly from the television. A 2024 survey found that 61% of U.S. homes already treat smart TVs as their main streaming screen, anchoring demand for Wi-Fi-capable bars that double as networked speakers.[1]Parks Associates, “61% of U.S. Households Use Smart TVs as Primary Streaming Device,” parksassociates.com LG’s 2025 Sound Suite lineup ships with True Wireless links, eliminating the last physical connection between the bar and its surrounds, while Dolby FlexConnect lets the bar auto-calibrate any wire-free speaker location. Broadband penetration above 85% in North America and Europe amplifies these expectations for latency-free whole-home audio. Vendors thus have to market soundbars as streaming endpoints rather than mere TV accessories to win cord-cutters who already rank audio quality among the top three factors in purchase decisions.
Surge in Smart-Attach Rates Above 70% in Key Markets
Television makers now optimize industrial design and firmware around integrated audio bundles. Samsung’s 2025 soundbar family unveils new low-profile cabinets paired with advanced AI up-mixing tuned for Neo QLED and OLED panels.[2]Samsung Newsroom, “Samsung Debuts 2025 Soundbars With New Designs,” news.samsung.com LG synchronizes its 2025 OLED range with WOW Orchestra so that TV drivers and the bar create a uniform soundstage. Bundled promotions elevate attach rates above 70% on screens 55 inches and larger, driving average ticket sizes higher for retailers. Independent bar specialists must therefore carve out niches in detachable surrounds, calibration software, or audiophile tuning to stand apart from ever-tighter TV-audio ecosystems.
Preference for Minimalist Living-Room Aesthetics
Urban apartments and open-concept homes leave little space for A/V receivers and floor-standing speakers. Sonos reported that 45% of its fiscal 2025 registrations came from users adding more products to an existing household, indicating rising appetite for compact multi-room systems.[3]Sonos Investor Relations, “Sonos Reports Q1 Fiscal 2025 Results,” investors.sonos.com Philips answered this demand with a B8200 bar just 37 millimeters tall, thin enough to tuck under central TV stands while still passing 4K at 120 hertz over HDMI 2.1. Aesthetic expectations push brands to bundle mounting kits, cable-management trays, and gaming-optimized inputs so that form and function coexist without visual clutter.
Pay-TV Operators Bundling Soundbars With Next-Gen Set-Top Boxes
Telecom carriers are transforming hardware into retention tools. Dutch operator KPN rents a TV+ Soundbox for EUR 6 per month (USD 6.5) as part of its TV+ plan, encouraging subscribers to keep the service for multi-year cycles. Similar models are emerging in Canada and the United States, where operators preload branded voice control and targeted-advertising firmware. For manufacturers, such partnerships unlock high-volume distribution but force compromises on gross margin and road-map autonomy. Over time, operators may shift to white-label designs, intensifying pricing pressure on mid-tier original equipment manufacturers (OEMs).
Restraints Impact Analysis*
| Restraint | (~) % Impact on CAGR Forecast | Geographic Relevance | Impact Timeline |
|---|---|---|---|
| Price Erosion From Ultra-Low-Cost Asian ODMs | -1.4% | Global, acute in Asia-Pacific and emerging markets | Short term (≤ 2 years) |
| Perception of “Good-Enough” Speakers in Sub-45″ TVs | -0.8% | Global, focused on entry-level TV segments | Medium term (2-4 years) |
| Supply-Chain Volatility for DSP Chipsets | -0.6% | Global, acute in North America and Europe | Short term (≤ 2 years) |
| Spatial-Audio Headphone Cannibalization | -0.5% | North America, Europe, Asia-Pacific gaming communities | Medium term (2-4 years) |
| Source: Mordor Intelligence | |||
Price Erosion From Ultra-Low-Cost Asian ODMs
Chinese ODMs such as AUSMAN quote fully-built bars from USD 3.60 to USD 450, collapsing entry-level price bands and dragging down average selling prices worldwide. The effect is most pronounced in Latin America and Southeast Asia, where affordability trumps brand loyalty. Premium-focused suppliers like Sonos counter by retreating upmarket; its Arc Ultra lists at USD 999 and leverages a portfolio of 1,900 issued U.S. patents to justify the spread. Mid-tier firms such as Vizio or Edifier must instead lean on exclusive retail bundles, extended warranties, or app-based room correction to stay profitable amid commodity hardware.
Perception of “Good-Enough” Speakers in Sub-45″ TVs
Advances in panel-embedded transducers reduce the audible gap between built-in TV audio and standalone soundbars for smaller screens. Sony’s 2025 BRAVIA OLED series uses the display itself as a vibrating diaphragm, marketing “theatre-like sound” without external speakers. LG’s OLED evo G4 integrates a 60-watt 4.2-channel system that virtualizes 11.1.2 audio. As entry-level buyers decide that TV-integrated speakers suffice for dialogue-heavy streaming, vendors must redirect messaging toward 50-inch-plus displays where dynamic range and bass extension remain outside the reach of panel-mounted drivers.
*Our forecasts treat driver/restraint impacts as directional, not additive. The impact forecasts reflect baseline growth, mix effects, and variable interactions.
Segment Analysis
By Installation Method: Powered Drivers Simplify Set
Active bars integrate amplification and digital processing, allowing plug-and-play installation that resonates with novice users. Although passive units still occupied 63.83% of the soundbar market in 2025, the active subsegment is tracking an 8.38% CAGR to 2031. JBL’s flagship Bar 1300 MK2, announced at USD 1,699.95, ships with detachable surrounds that recharge on the chassis, providing a modular path from 5.1.2 to 11.1.4 channels. Premium brands increasingly market room-adaptation algorithms, AI gain control, and wireless sub pairing as software-led experiences that passive architectures cannot match. Conversely, custom installers keep favoring passive designs for ballrooms, conference centers, and luxury villas where centralized amplification, zoning, and future speaker swaps matter more than one-box convenience. This duality ensures that the soundbar market retains both architectures even as volume gradually tilts toward active units.
Software now serves as the main battleground. Samsung’s 2025 range auto-optimizes EQ curves after sampling the room via built-in microphones, while Yamaha’s True X Bar 50A leverages miniature “Sound Motion” transducers for bass without bulky cabinets. The continuous feature drop via firmware updates creates recurring engagement, anchoring brand loyalty and unlocking subscription-like revenue from voice assistants or premium calibration profiles. Passive players counter through audiophile grade components, exotic wood finishes, and driver upgrades that cater to enthusiasts who distrust algorithmic tuning. These opposing philosophies will coexist throughout the forecast horizon and keep the soundbar market vibrant across price tiers.


By Installation Type: Aesthetics Drive Wall-Mount Adoptio
Table-top placement remained the mainstream choice at 60.17% in 2025, yet wall-mounted bars are forecast to log an 8.77% CAGR to 2031. The shift aligns with the spread of ultra-slim OLED and QLED panels that float almost flush to the wall, leaving little physical depth on stands. Philips’ B8200 bar, listed at EUR 300 (USD 327), measures just 37 millimeters in height and ships with brackets, positioning itself as a ready companion for wall-hung screens. Consumer hesitancy toward drilling, especially among renters, remains the biggest hurdle. Brands now experiment with adhesive mounts, magnetic rails, and step-by-step augmented-reality apps that demystify installation.
Even so, many families prefer the plug-and-play simplicity of placing the bar on an existing cabinet. Sony’s Bravia Theatre Bar 6 sells for GBP 499 (USD 649) and bundles Voice Zoom 3 to improve dialogue clarity when paired with Bravia TVs. Table-top units still dominate impulse purchases during holiday promotions when consumers upgrade TVs and audio together. Wall-mount growth therefore pivots on manufacturer success in removing install friction and on retailer education so that consumers see mounting as a twenty-minute task rather than a risky renovation.
By Channel Configuration: Stereo Resurges for Streaming
Five-channel systems held the highest 41.94% share of the 2025 soundbar market size as home-theater enthusiasts sought Dolby Atmos and DTS:X immersion. Yet two-channel models are clocking an 8.48% CAGR through 2031 as streaming platforms increasingly optimize mixes for stereo playback and voice-assistant bars favor compact footprints. Panasonic’s SC-HTS160GWK, priced at INR 12,990 (USD 157), exemplifies this democratization by bundling Bluetooth 5.3 and a slim 2.1-channel design for first-time upgraders in India. Stereo resilience also aligns with the rise of desktop usage, where users pair small monitors with narrow bars for near-field listening.
Premium buyers, however, look beyond channel count to modularity. JBL’s Bar 1300 MK2 supports detachable surrounds so that a purchase begins at 5.1.2 and can expand when budgets allow. Three-channel models with a dedicated center speaker strike a balance, addressing dialogue intelligibility without adding rear speakers that clutter small spaces. Over the forecast period, “upgrade-ready” ecosystems will likely temper outright cannibalization among configurations, enabling entry-level buyers to grow within a brand’s portfolio rather than defect as needs evolve.

By Application: Commercial Venues Prioritize Guest Experience
Home audio still generated 76.72% of revenue in 2025, but commercial uses—from hotel guest rooms to open-plan offices—display the fastest 8.92% CAGR. Operators recognize that high-quality ambient sound increases dwell time and satisfaction scores. JBL’s Pro PSB-2 targets hospitality deployments, while Philips’ HAL5023 embeds remote diagnostics so that IT teams can monitor hundreds of rooms from a dashboard. These enterprise-grade bars carry higher list prices yet reduce total cost of ownership through centralized firmware control and longer duty cycles. Vendors also emphasize tamper-proof housings and lockable control panels to withstand daily guest turnover.
Residential demand remains a volume powerhouse as households treat bars as always-on audio hubs. Sonos measured 16.1 billion listening hours in fiscal 2025, averaging 2.6 hours per day per home, underlining that users stream music, podcasts, and ambient noise even when the TV is off. Continuous over-the-air updates—new streaming services, voice accents, gaming modes—have become table stakes to sustain engagement in the home segment. Manufacturers will likely bifurcate their catalogs: consumer lines focused on playful software features and commercial lines centered around reliability, fleet analytics, and theft deterrence.
Geography Analysis
North America led with 33.61% of 2025 revenue, buoyed by premium adoption, operator bundles, and a mature replacement cycle. Sonos booked USD 324.6 million from the Americas in Q1 fiscal 2025, remaining the region’s top premium bar vendor. Canadian and Mexican retailers increasingly bundle bars with 55-inch-plus sets, lifting average ticket sizes during holiday promotions. Yet spatial-audio headsets such as Apple AirPods Max threaten shared listening events, especially for gaming. Dolby and AMC’s plan to exceed 200 Dolby Cinema sites by 2027 is expected to rekindle demand for Atmos-capable living-room bars as moviegoers chase theater-grade immersion at home.
Asia-Pacific shows the fastest 9.02% CAGR thanks to manufacturing scale and a swelling middle class in India, China, and Southeast Asia. Panasonic places India’s bar market at USD 170.1 million in 2023 with a trajectory toward USD 395.8 million by 2032, catalyzed by smart-TV proliferation and rising disposable income. China doubles as demand and supply hub, with ODMs turning out 18,000 units daily at price points unmatchable elsewhere. Japan and South Korea lean premium; Sony’s Bravia Theatre System 6 debuted in the UK but originated in Japan, underscoring the region’s R&D prowess.
Europe exerts influence through regulation and affluent niches. Eco-design mandates cap standby power below 0.5 watts, nudging global road maps toward single-chassis efficiency. Meanwhile, hotel chains and short-stay rentals in Spain, France, and Italy adopt commercial-grade bars to elevate guest ratings. South America concentrates growth in Brazil and Argentina where OTT viewership surges, though currency swings hamper premium imports. The Middle East, especially Saudi Arabia and the UAE, specifies bars in new mega-projects, while Africa remains nascent with adoption pockets in South Africa and Nigeria. Collectively, these regions broaden the soundbar market yet depend on currency stability and broadband rollout to unlock their full potential.

Competitive Landscape
Industry concentration is moderate: the ten largest brands claimed about 52% of global revenue in 2025. Samsung, LG, Sony, and Bose exploit vertically integrated TV ecosystems, bundling bars that auto-sync with proprietary operating systems and wireless subs. Sonos follows a platform play, reporting 17 million homes in its network and citing that 45% of fiscal 2025 registrations came from repeat buyers adding extra rooms. Chinese ODMs, notably Hisense and Xiaomi, pursue a volume strategy, compressing mid-tier margins with models that undercut global averages by 20-30%. This barbell structure leaves mid-scale firms like Vizio and Edifier scrambling to maintain differentiation through software features, extended warranties, or retailer-exclusive bundles.
White space lies in commercial and modular niches. JBL’s Pro PSB-2 and Philips’ HAL5023 target hotels and offices eager for centralized monitoring, an area where consumer-centric brands have limited presence. Modular upgrade paths, exemplified by bars with detachable surrounds, allow shoppers to buy into a platform at USD 400 and later expand to premium setups without replacing the core unit. Such flexibility may deter churn toward headphones and stave off obsolescence fears.
Technology licensing and M&A activity are set to accelerate. Dirac, Dolby, and DTS license spatial-audio algorithms that smaller brands cannot develop in-house, raising switching costs for OEMs locked into a codec. Simultaneously, component tariffs introduced in April 2025 inflated digital signal processor prices by roughly 10%, incentivizing vertical integration or near-shoring among multinationals to defend gross margins. Consolidation among ODMs is also probable as scale becomes the only antidote to razor-thin entry-level pricing.
Soundbar Industry Leaders
Samsung Electronics Co., Ltd.
LG Electronics Inc.
Sony Group Corporation
Bose Corporation
Sonos, Inc.
- *Disclaimer: Major Players sorted in no particular order

Recent Industry Developments
- July 2025: Samsung Electronics reported Q2 2025 revenue of KRW 74.6 trillion (USD 62.5 billion) and highlighted AI-enhanced soundbar features aimed at maintaining premium positioning; the move signals continued R&D investment despite macro headwinds.
- June 2025: LG Electronics announced its 2025 OLED TVs received TÜV Rheinland “True Visual Experience with Indoor Lighting” certification and affirmed a 52% share of global OLED shipments in Q1 2025.
- May 2025: Samsung/Harman acquired Bowers & Wilkins, Denon, Polk, and Marantz for USD 350 million, expanding its luxury audio footprint and securing vertical control over multiple audiophile brands.
- April 2025: Samsung debuted its 2025 soundbar lineup featuring new cabinets, stronger bass, and AI audio optimization for Neo QLED and OLED screens.


Global Soundbar Market Report Scope
Soundbars are sleek forms of loudspeakers that are unobtrusive, easy to set up, and give a sound that is as impactful as the premium picture on a TV. Soundbars can be mounted on a computer monitor, TV, home theater, or other similar devices. These are used majorly for home entertainment and other applications.
The Soundbar Market Report is Segmented by Installation Method (Active, Passive), Installation Type (Table-top, Wall-mounted), Channel Configuration (2 Channel, 3 Channel, 5 Channel, Other Configurations), Application (Home Audio, Commercial), and Geography (North America, South America, Europe, Asia-Pacific, Middle East, Africa). Market Forecasts are Provided in Terms of Value (USD).
| Active Soundbar |
| Passive Soundbar |
| Table-top |
| Wall-mounted |
| 2 Channel |
| 3 Channel |
| 5 Channel |
| Other Configurations |
| Home Audio |
| Commercial |
| North America | United States |
| Canada | |
| Mexico | |
| South America | Brazil |
| Argentina | |
| Rest of South America | |
| Europe | Germany |
| United Kingdom | |
| France | |
| Italy | |
| Spain | |
| Russia | |
| Rest of Europe | |
| Asia-Pacific | China |
| Japan | |
| India | |
| South Korea | |
| South-East Asia | |
| Rest of Asia-Pacific | |
| Middle East | Saudi Arabia |
| United Arab Emirates | |
| Turkey | |
| Rest of Middle East | |
| Africa | South Africa |
| Nigeria | |
| Rest of Africa |
| By Installation Method | Active Soundbar | |
| Passive Soundbar | ||
| By Installation Type | Table-top | |
| Wall-mounted | ||
| By Channel Configuration | 2 Channel | |
| 3 Channel | ||
| 5 Channel | ||
| Other Configurations | ||
| By Application | Home Audio | |
| Commercial | ||
| By Geography | North America | United States |
| Canada | ||
| Mexico | ||
| South America | Brazil | |
| Argentina | ||
| Rest of South America | ||
| Europe | Germany | |
| United Kingdom | ||
| France | ||
| Italy | ||
| Spain | ||
| Russia | ||
| Rest of Europe | ||
| Asia-Pacific | China | |
| Japan | ||
| India | ||
| South Korea | ||
| South-East Asia | ||
| Rest of Asia-Pacific | ||
| Middle East | Saudi Arabia | |
| United Arab Emirates | ||
| Turkey | ||
| Rest of Middle East | ||
| Africa | South Africa | |
| Nigeria | ||
| Rest of Africa | ||


Key Questions Answered in the Report
How large will the soundbar market be by 2031?
The soundbar market size is projected to reach USD 15.29 billion by 2031, advancing at an 8.2% CAGR from 2026.
Which region will add the most incremental revenue through 2031?
Asia-Pacific is forecast to post the highest 9.02% CAGR, driven by mid-market demand in China, India, and Southeast Asia.
Who leads global soundbar sales?
Samsung maintained leadership for the eleventh consecutive year in 2024 with 20.1% global revenue share.
What installation type is growing the fastest?
Wall-mounted bars should expand at an 8.77% CAGR as ultra-slim TVs and minimalist décor push consumers toward off-furniture placement.
Why are two-channel soundbars resurging?
Streaming platforms now optimize audio for stereo mixes, and compact 2.1-channel designs integrate voice assistants, fueling an 8.48% CAGR.
How are telecom operators influencing hardware sales?
Pay-TV carriers bundle branded soundbars—often on subscription terms—boosting distribution volume while pressuring OEM margins.
What is driving commercial adoption of soundbars?
Hotels, offices, and retail spaces install enterprise-grade bars with remote diagnostics to enhance guest experience and reduce maintenance.
Page last updated on:


