Audio Amplifier Market Size and Share
Market Overview
| Study Period | 2020 - 2031 |
|---|---|
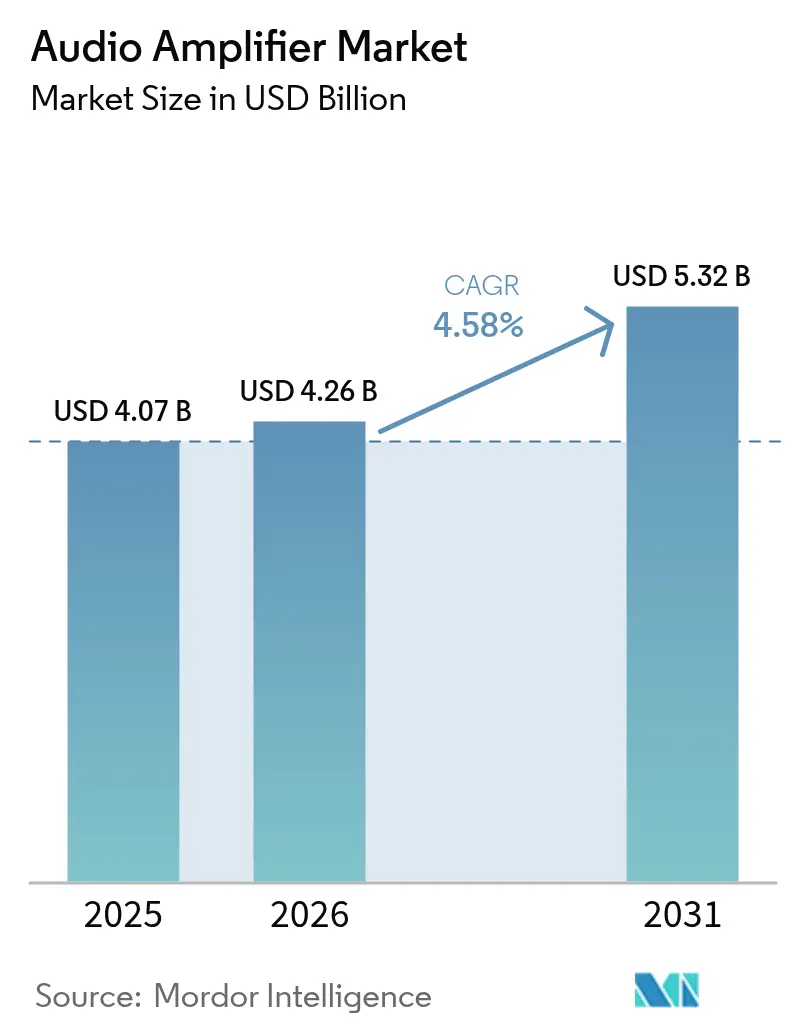
| Market Size (2026) | USD 4.26 Billion |
| Market Size (2031) | USD 5.32 Billion |
| Growth Rate (2026 - 2031) | 4.58% CAGR |
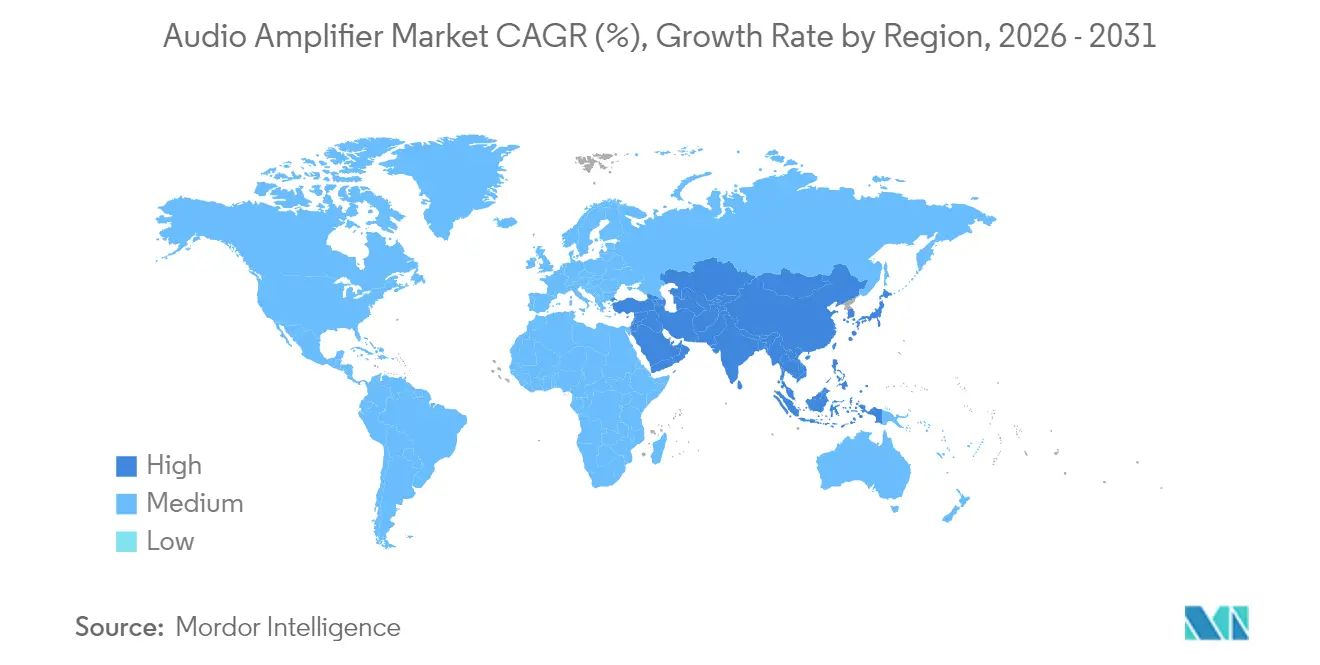
| Fastest Growing Market | Middle East |
| Largest Market | Asia Pacific |
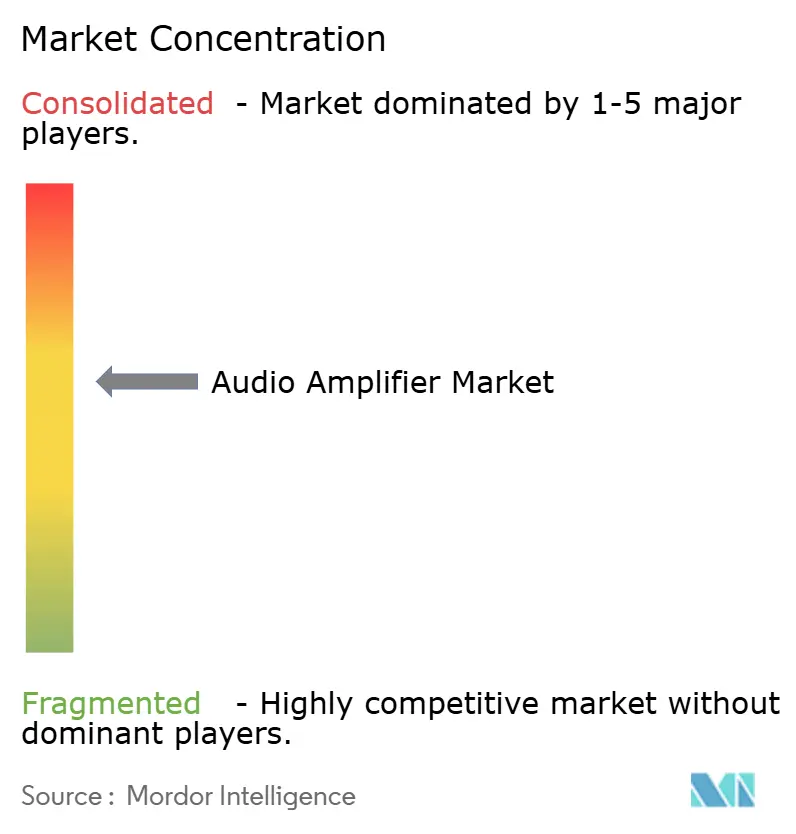
| Market Concentration | Medium |
Major Players *Disclaimer: Major Players sorted in no particular order Image © Mordor Intelligence. Reuse requires attribution under CC BY 4.0. | |
Audio Amplifier Market Analysis by Mordor Intelligence
The audio amplifier market size was valued at USD 4.07 billion in 2025 and estimated to grow from USD 4.26 billion in 2026 to reach USD 5.32 billion by 2031, at a CAGR of 4.58% during the forecast period (2026-2031). Resilient demand from electric vehicles, immersive home‐theater systems, and professional live-event venues underpins steady revenue expansion despite supply-chain volatility. Gallium-nitride (GaN) devices are raising efficiency ceilings and easing thermal design constraints, while one-inductor modulation technologies are streamlining bill-of-materials costs. Automakers are embedding multi-channel class-D amplifiers to capitalize on quieter electric cabins, and miniaturization priorities in true wireless stereo and wearables continue to steer OEMs toward highly integrated audio system-on-chip (SoC) platforms. Industry consolidation-exemplified by HARMAN’s purchase of Sound United and Bose’s acquisition of McIntosh Group-signals a race to secure premium brands and cross-vertical synergies. Meanwhile, China’s dominance in gallium refining introduces pricing uncertainty, which vendors are countering through dual-sourcing and substrate-recycling initiatives, thereby sustaining the long-term attractiveness of the audio amplifier market.
Key Report Takeaways
- By channel configuration, 2-channel models led with 41.65% revenue share of the audio amplifier market in 2025, while 8-channel and above units are advancing at a 5.71% CAGR to 2031.
- By device integration, stand-alone amplifier ICs held 54.75% of the audio amplifier market size in 2025, whereas integrated audio SoCs record the fastest 5.99% CAGR through 2031.
- By semiconductor material, silicon retained 81.05% of the audio amplifier market share in 2025, yet the GaN segment is projected to grow 7.17% annually through 2031.
- By end-user application, consumer electronics contributed 58.35% of the audio amplifier market size in 2025, while automotive EV deployments post a 5.22% CAGR over the forecast period.
- By geography, Asia accounted for 47.85% of the audio amplifier market in 2025; the Middle East stands out with a 5.03% CAGR to 2031.
Note: Market size and forecast figures in this report are generated using Mordor Intelligence’s proprietary estimation framework, updated with the latest available data and insights as of 2026.
Global Audio Amplifier Market Trends and Insights
Drivers Impact Analysis*
| Driver | (~) % Impact on CAGR Forecast | Geographic Relevance | Impact Timeline |
|---|---|---|---|
| Transition to electric and connected vehicles | +1.2% | Global (APAC & North America lead) | Medium term (2–4 years) |
| Miniaturization needs in TWS and wearables | +0.9% | Global, APAC hubs | Short term (≤ 2 years) |
| Smart-home audio ecosystem adoption | +0.8% | North America & EU, expanding to APAC | Medium term (2–4 years) |
| GaN-based switching devices in pro-audio | +0.7% | North America & EU early adoption | Long term (≥ 4 years) |
| Immersive audio (Dolby Atmos) uptake | +0.6% | North America & EU core | Medium term (2–4 years) |
| Live-events infrastructure incentives | +0.4% | Global | Short term (≤ 2 years) |
| Source: Mordor Intelligence | |||
Transition to Electric and Connected Vehicles Boosting In-Vehicle Infotainment Audio Amplifiers
Electric drivetrains eliminate engine noise, prompting automakers to enhance cabin audio experiences through multi-channel Class-D amplifiers and zone-specific sound management. BMW’s HypersonX soundscape uses 43 distinct signals to craft a branded acoustic signature for its Neue Klasse EV line. HARMAN’s SeatSonic solution further personalizes audio per passenger, harnessing dedicated amplifiers for each seating zone. As software-defined vehicles proliferate, amplifier firmware upgrades extend product lifecycles, and Texas Instruments’ one-inductor modulation cuts component count to meet automakers’ cost targets
Miniaturization Needs in TWS and Wearables Driving High-Efficiency Integrated Amplifiers
True wireless stereo earbuds and smartwatches impose severe board-space and battery-life constraints, steering vendors toward SoCs that merge DSP, connectivity, and amplification. Analog Devices’ ADAU1797 doubled DSP horsepower while integrating a class-D stage to extend battery runtime. Nordic Semiconductor’s nRF54L15 similarly packages 1.5 MB NVM, 256 KB RAM, and LE Audio support on a 22 nm node, easing system-integration overhead. Silicon Intervention’s fractal class-D topology couples buck regulation with the output stage to trim idle losses, a critical metric for all-day wearable usage.
Smart-Home Audio Ecosystem Adoption Fueling Multi-Channel Amplifier Demand
Networked households now expect amplifiers that automatically sync with streaming ecosystems and voice assistants. Yamaha’s AVENTAGE receivers gained Works with Sonos certification through a software update, confirming that firmware agility is crucial for attachment rates. In January 2025, Audioscenic Ltd., a UK-based innovator of 3D sound technology, announced its collaboration with Dell Inc. to introduce a new AI-enhanced monitor that utilizes beamforming across a 5×5 W array. This indicates how PC peripherals, not just AVRs, are adopting multi-channel amplification. Following the acquisition, Harman’s HEOS platform will be integrated into Samsung appliances, confirming that ecosystem lock-in is a key growth lever.
GaN-Based Switching Devices Enabling High-Power Professional-Audio Efficiency Gains
GaN FETs switch faster and dissipate less heat than silicon MOSFETs, permitting 500 W per channel with no mechanical heatsinks, as EPC demonstrated for class-D pro-audio modules. The resulting amplifier density lowers rack weight and augments touring-rig flexibility. Infineon projects that GaN will cross mass-market inflection points in 2025 as decarbonization imperatives tighten global energy standards. Yet China’s export curbs on gallium highlight supply-risk premiums, nudging OEMs toward strategic stockpiling and recycling.
Restraints Impact Analysis*
| Restraint | (~) % Impact on CAGR Forecast | Geographic Relevance | Impact Timeline |
|---|---|---|---|
| Smartphone SoC integration shrinking discrete market | -0.8% | Global (APAC manufacturing) | Short term (≤ 2 years) |
| GaN substrate supply constraints | -0.6% | North America & EU most affected | Medium term (2–4 years) |
| Bluetooth headphones cannibalizing traditional Hi-Fi | -0.5% | North America & EU | Long term (≥ 4 years) |
| EU Ecodesign stand-by-power limits | -0.3% | EU primary | Short term (≤ 2 years) |
| Source: Mordor Intelligence | |||
Smartphone SoC Integration Shrinking Discrete Amplifier Addressable Market
Application processors now embed class-D outputs, eroding unit demand for standalone ICs in mid-tier phones. Qorvo’s Q3 2025 revenue slid 12.4% as Android OEMs consolidated RF and audio front-ends into single die offerings. Similar design choices in tablets and thin-and-light PCs squeeze discrete suppliers, compelling them to pivot toward automotive, smart-home hubs, and pro-audio racks where thermal and output-power constraints inhibit SoC replacement.
GaN Substrate Supply Constraints Elevating BOM Costs
China refined 98% of the global gallium supply in 2022, and any export embargo would threaten USD 3.4 billion in US GDP, according to the USGS. Price spikes ripple directly into amplifier BOMs because die volumes scale with the number of channels. Diversification into recycled GaN scrap and European pilot fabs may alleviate pressure, but meaningful capacity will not be available before 2027, leaving OEMs to hedge with higher-cost silicon designs as a contingency.
*Our forecasts treat driver/restraint impacts as directional, not additive. The impact forecasts reflect baseline growth, mix effects, and variable interactions.
Segment Analysis
By Channel Configuration: Multi-Channel Systems Drive Premium Positioning
The 8-channel-and-above segment is forecast to grow at 5.71% through 2031, driven by the rollout of Dolby Atmos in both home cinema and automotive cabins. Dedicated height and surround pathways raise amplifier counts per chassis, while dynamic channel mapping inside DSP firmware supports backward compatibility with stereo content. In contrast, cost-sensitive soundbars and desktop speakers sustain the 2-channel foothold that captured 41.65% audio amplifier market share in 2025.
The audio amplifier market size for multi-channel models is expected to expand as smart-home hubs integrate AV, lighting, and security control, favoring centralized amplifier nodes. Professional touring vendors deploy modular rack amps that are configurable from monaural subwoofer duty to immersive festival rigs, optimizing asset utilization across various event scales. These architectural flexibilities favor class-D topologies, whose efficiency advantages grow with channel density.


By Device Integration: SoC Solutions Challenge Discrete Dominance
Stand-alone ICs still account for 54.75% of 2025 revenue, as automotive and pro-audio installations require higher voltage rails and greater thermal headroom. Yet SoCs are advancing at 5.99% CAGR as wearables and ultra-slim laptops prize PCB real estate and single-package bill of materials. Vendors utilize advanced process nodes to co-locate DSP cores, Bluetooth LE radios, and Class-D outputs, thereby minimizing I/O routing losses.
Audio amplifier market size gains from SoCs are evident in TWS earbuds, where envelope tracking and hybrid ANC algorithms benefit from on-die memory bandwidth. Conversely, discrete multichip modules remain viable where board-level heat spreading and replaceable stages are service requirements, notably in concert rental gear. Suppliers balance dual portfolios, leveraging shared silicon IP while offering pin-compatible discrete upgrades for legacy clients.
By Semiconductor Material: GaN Adoption Accelerates Despite Supply Constraints
Silicon maintains an 81.05% revenue foothold, yet GaN’s 7.17% CAGR reflects designers’ appetite for efficiency jumps superior to what existing silicon superjunction MOSFETs can provide. Eliminating bulky heatsinks unlocks slimmer chassis for rack amplifiers, enabling under-seat automotive mounting. The expansion of the audio amplifier market size for GaN designs also aligns with regulatory efforts to reduce standby losses.
Still, audio amplifier market share erosion for silicon is gradual due to cost differences amplified by gallium scarcity. Hybrid driver stages that pair silicon control ICs with GaN output arrays mitigate risk while familiarizing engineering teams with wide-bandgap characteristics. Silicon carbide occupies niche ultra-high-voltage broadcast transmitters but remains marginal in commercial AV due to price and switching-speed trade-offs.

By End-User Application: Automotive EV Segment Leads Growth Trajectory
Consumer electronics accounted for 58.35% of 2025 revenue, driven by refresh cycles of phones, TVs, and smart speakers. Yet electric vehicles are the fastest-rising use case, advancing 5.22% annually as OEMs embed 14-channel architectures with seat-specific drivers and engine-sound synthesis functions. Quiet cabins heighten listener sensitivity, incentivizing the use of low-noise power stages.
Audio amplifier industry suppliers, therefore, co-develop with tier-1 infotainment integrators, bundling amplifier firmware with virtual-engine sound libraries. The professional touring and installation markets rebound on event-venue renovations, although their share is less volatile due to multi-year project lead times. Industrial IoT voice-alert systems and kiosk signage add incremental volumes, often specified at lower power ratings but high durability standards.
Geography Analysis
Asia Pacific commanded 47.85% of 2025 revenue on the strength of vertically integrated consumer-electronics supply chains and surging domestic EV deliveries. Mainland China anchors volume, while Japan and South Korea push premium innovation in class-D silicon and GaN wafer processing. Local smartphone champions’ in-house SoC roadmaps heavily influence discrete-component demand swings throughout the region.
North America accounts for sizable professional-audio and home-theater consumption, with live-event touring recovering post-pandemic and driving rack-amplifier upgrades. Regulatory certainty and robust patent enforcement foster GaN start-ups that license dies to global OEMs. Europe displays similar maturity but imposes stringent Ecodesign power-budget ceilings; compliance efforts often pilot energy-saving firmware, which is later rolled out worldwide.
The Middle East, although smaller in absolute terms, is projected to post a 5.03% CAGR through 2031, underpinned by hospitality megaprojects that outfit stadiums, hotels, and entertainment districts with immersive sound systems. Government diversification agendas fund smart-city builds that integrate distributed audio for public information services, accelerating amplifier shipments in commercial AV channels. Africa and Latin America record steady single-digit growth, mostly driven by price-sensitive consumer electronics imports, supplemented by regional live-music cultures that sustain demand for portable PA systems.

Competitive Landscape
The audio amplifier market is moderately consolidated, with the top five brands controlling just under 50% of the revenue, while numerous niche players serve specialized verticals. HARMAN’s USD 350 million purchase of Sound United’s brands expands Samsung’s reach from car audio into premium home-audio ecosystems, leveraging common DSP stacks for cross-device consistency.[1]Masimo Corporation, “Masimo to Sell Consumer Audio Business to HARMAN International,” news.harman.com Bose’s acquisition of McIntosh Group brings high-end cachet and handcrafted amplifier heritage into its portfolio, positioning the company to upsell audiophile features into mainstream smart speakers.[2]Kif Leswing, “Bose Buys McIntosh,” cnbc.com
Semiconductor specialists, such as Texas Instruments and Analog Devices, pursue integration plays that embed amplification within mixed-signal SoCs, thereby circumventing standalone board vendors. Pro-audio stalwart QSC agreed to a USD 1.215 billion buyout by Acuity Brands, illustrating the convergence of adjacent markets as smart-building platforms integrate audio, lighting, and occupancy data on unified backbones.[3]Joao Martins, “QSC to Be Acquired by Acuity Brands,” audioxpress.com Smaller innovators target GaN driver IP, AI acoustic-profiling algorithms, or modular amp cards, often licensing technology to tier-1 OEMs rather than scaling full manufacturing.
Competitive strategy now hinges on three levers, efficient wide-bandgap power stages, firmware-upgradable DSP pipelines, and tight linkage to voice-assistant or smart-home ecosystems. Vendors that command both semiconductor roadmaps and branded end-points can amortize R&D across verticals, squeezing mid-tier rivals that lack similar economies. Nonetheless, open-standard initiatives such as Auracast LE Audio democratize multi-channel streaming, enabling agile newcomers to address niche segments with cloud-based tuning services.
Audio Amplifier Industry Leaders
Yamaha Corporation
Harman International
Sound United LLC
Kenwood Corporation
Sony Corporation
- *Disclaimer: Major Players sorted in no particular order

Recent Industry Developments
- May 2025: HARMAN International finalized its USD 350 million purchase of Sound United’s consumer-audio division, integrating Bowers & Wilkins, Denon, Marantz, and Polk brands.
- May 2025: Yamaha issued firmware that certifies AVENTAGE AVRs with Works with Sonos interoperability for models RX-A8A, RX-A6A, RX-A4A, and RX-A2A.
- April 2025: BMW unveiled the HypersonX 43-signal acoustic concept for Neue Klasse electric vehicles under its Operating System X platform.
- January 2025: Texas Instruments debuted the TAS6754-Q1 class-D amplifier and AM275x-Q1 MCU line at CES 2025, spotlighting one-inductor modulation and spatial-audio processing.


Research Methodology Framework and Report Scope
Market Definitions and Key Coverage
Our study defines the audio amplifier market as the annual revenue generated from newly manufactured integrated circuits, modules, and boards whose principal task is to raise low-power audio signals to a level suitable for loudspeakers or headphones across consumer electronics, automotive, professional sound, and industrial devices. Values are expressed in USD at manufacturer selling price before distributor mark-ups.
Scope exclusion: Legacy tube amplifiers used in boutique hi-fi builds and refurbished guitar amps sold in the secondary market are not counted.
Segmentation Overview
- By Channel Configuration
- Mono
- 2-Channel
- 4-Channel
- 6-Channel
- 8-Channel and Above
- By Device Integration/Form Factor
- Stand-Alone Audio-Amplifier IC
- Integrated Audio SoC/Codec
- Amplifier Modules and Boards
- By Semiconductor Material
- Silicon
- Gallium Nitride (GaN)
- Silicon Carbide (SiC)
- Others (GaAs, etc.)
- By End-User Application
- Consumer Electronics
- Smartphones and Tablets
- Laptops and PCs
- Smart TVs and Set-Top Boxes
- Wearables and Hearables
- Portable Speakers and Home Audio
- Automotive
- Passenger Vehicles
- Commercial Vehicles
- Electric Vehicles
- Professional Audio and Broadcasting
- PA Systems and Touring Sound
- Studio and Recording Equipment
- Broadcasting Equipment
- Telecommunications Infrastructure
- Industrial and IoT Devices
- Others
- Consumer Electronics
- By Geography
- North America
- United States
- Canada
- Mexico
- Europe
- Germany
- United Kingdom
- France
- Nordics
- Rest of Europe
- South America
- Brazil
- Rest of South America
- Asia-Pacific
- China
- Japan
- India
- South-East Asia
- Rest of Asia-Pacific
- Middle East and Africa
- Middle East
- Gulf Cooperation Council Countries
- Turkey
- Rest of Middle East
- Africa
- South Africa
- Rest of Africa
- Middle East
- North America
Detailed Research Methodology and Data Validation
Primary Research
Mordor analysts interviewed amplifier IC designers, tier-1 automotive infotainment engineers, specialty audio OEM buyers, and distributors across Asia, Europe, and the Americas. These conversations validated channel inventory turnover, realistic ASP erosion, and future design-in probabilities that secondary data alone could not show.
Desk Research
We began with publicly available statistics from bodies such as the International Telecommunication Union, OICA vehicle production tables, UN Comtrade customs codes for HS-8542, and JEITA semiconductor shipment indices, which anchor unit flows for phones, cars, and audio hardware. Trade journals and patents harvested through Questel helped us flag emerging GaN and SiC design wins, while D&B Hoovers company filings guided average selling price (ASP) ranges. News archives on Dow Jones Factiva rounded out near-term demand cues from OEM launch pipelines. The sources named illustrate our wider desktop pool; many further outlets were reviewed for cross-checks.
Market-Sizing & Forecasting
A top-down model converts end-product shipments (smartphones, cars, soundbars, mixing consoles) into addressable amplifier units through penetration ratios and average amplifier count per device, which are then multiplied by confirmed ASP bands. Select bottom-up checks, supplier revenue roll-ups and channel audits, calibrate totals. Core variables include smartphone production, light-vehicle output, per-capita spend on home audio, GaN device adoption rate, and regional power-efficiency mandates. Forecasts to 2030 rely on multivariate regression linked to those drivers, with scenario analysis layering in cyclical consumer-electronics swings. Gaps in channel data are bridged using three-year averaged historical trends adjusted by primary-research sentiment.
Data Validation & Update Cycle
Outputs undergo variance scans versus WSTS analog IC totals and customs trade values; anomalies trigger re-interviews before sign-off. Reports refresh each year, and material events such as factory fires or major design wins prompt interim updates. A final review one week before publication ensures clients receive the current view.
Why Mordor's Audio Amplifier Baseline Commands Reliability
Published numbers often diverge because firms choose different functional scopes, device classes, currency years, and refresh speeds. By locking the scope to dedicated audio amplification silicon, keeping currency conversions constant, and refreshing annually, Mordor reduces those drifts.
Key gap drivers include rivals bundling broader power-amplifier categories, relying on headline ASPs without regional splits, or working off older base years that miss the recent GaN uptick.
Benchmark comparison
| Market Size | Anonymized source | Primary gap driver |
|---|---|---|
| USD 4.07 B (2025) | Mordor Intelligence | - |
| USD 5.30 B (2024) | Global Consultancy A | Includes RF and Class-E power stages plus aftermarket kits |
| USD 4.10 B (2022) | Industry Portal B | Earlier base year and excludes GaN / SiC amplifier ICs |
This comparison shows that when scope creep or dated baselines are removed, the market settles near Mordor's figure, underscoring our transparent variables and repeatable steps that decision-makers can trust.


Key Questions Answered in the Report
What is the current value of the audio amplifier market?
The audio amplifier market is valued at USD 4.26 billion in 2026 and is forecast to reach USD 5.32 billion by 2031.
Which segment is growing fastest within the audio amplifier market?
Amplifiers with 8 channels and above post the highest 5.71% CAGR, driven by Dolby Atmos and immersive audio adoption.
How are gallium-nitride devices influencing amplifier design?
GaN transistors allow higher power density and eliminate bulky heatsinks, cutting enclosure size and improving efficiency, although supply-chain risks remain.
Why are electric vehicles important for future amplifier demand?
Quieter cabins in EVs create a premium on audio quality, prompting automakers to add more amplifier channels and personalized sound zones.
Page last updated on:


