Solar Tree Market Size and Share
Market Overview
| Study Period | 2020 - 2030 |
|---|---|
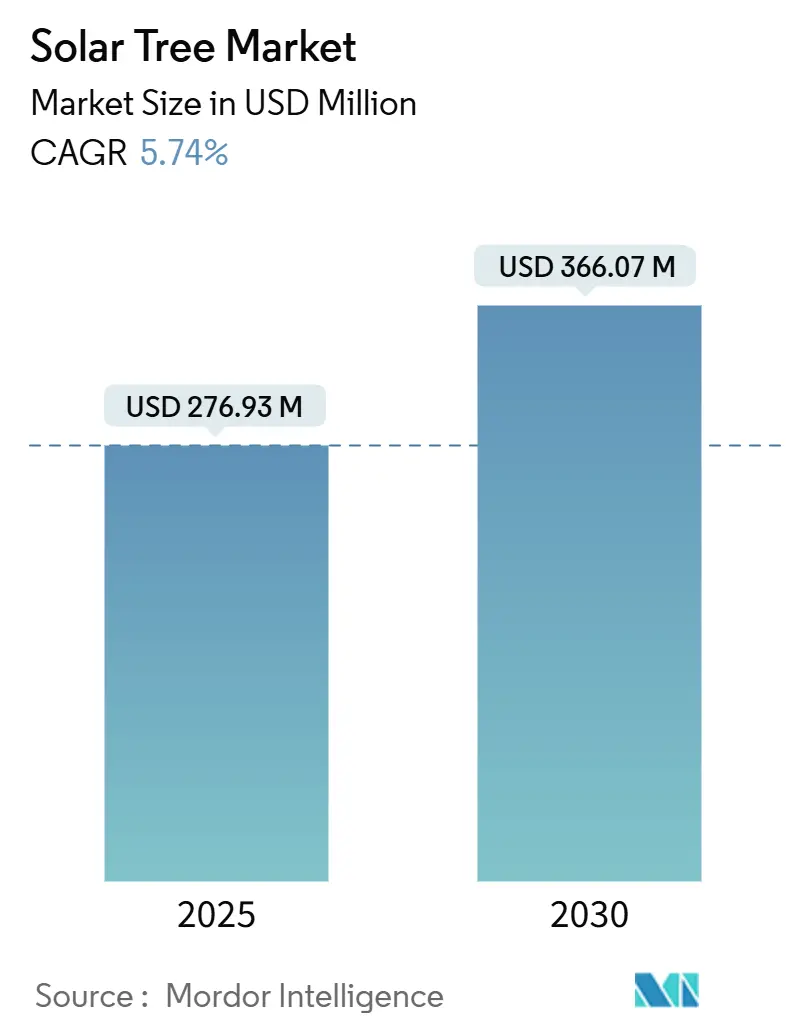
| Market Size (2025) | USD 276.93 Million |
| Market Size (2030) | USD 366.07 Million |
| Growth Rate (2025 - 2030) | 5.74% CAGR |
| Fastest Growing Market | Asia Pacific |
| Largest Market | Asia Pacific |
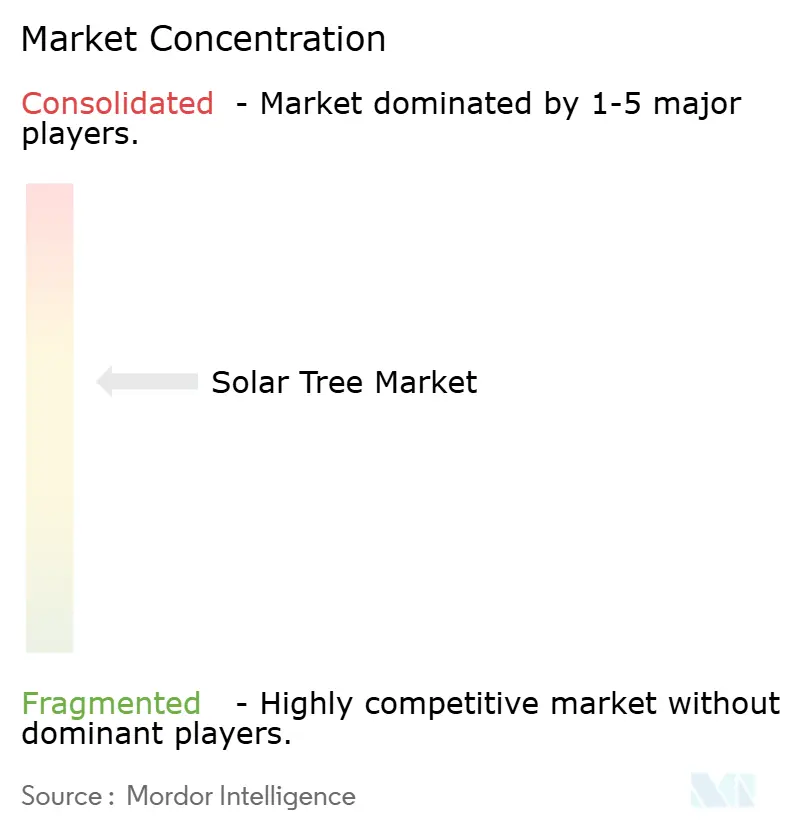
| Market Concentration | Medium |
Major Players *Disclaimer: Major Players sorted in no particular order Image © Mordor Intelligence. Reuse requires attribution under CC BY 4.0. | |
Solar Tree Market Analysis by Mordor Intelligence
The Solar Tree Market size is estimated at USD 276.93 million in 2025, and is expected to reach USD 366.07 million by 2030, at a CAGR of 5.74% during the forecast period (2025-2030).
Space-efficient designs deliver 96% land savings versus flat panels and up to 23% more energy, a performance advantage that supports widespread adoption in land-scarce cities. Expanded renewable-energy mandates in more than 70 nations, plus the surge of electric-vehicle (EV) charging nodes, create regulatory and commercial pull for solar-tree installations. Asia-Pacific anchors demand thanks to accelerating urbanization, aggressive clean-power targets, and land scarcity favoring vertical solar. North America and Europe provide stable growth through smart-city retrofits and policy incentives. Competitive intensity is moderate but rising as incumbents and new entrants race to integrate batteries, fast-charge hardware, and aesthetic features that meet the dual brief of energy generation and urban furniture.
Key Report Takeaways
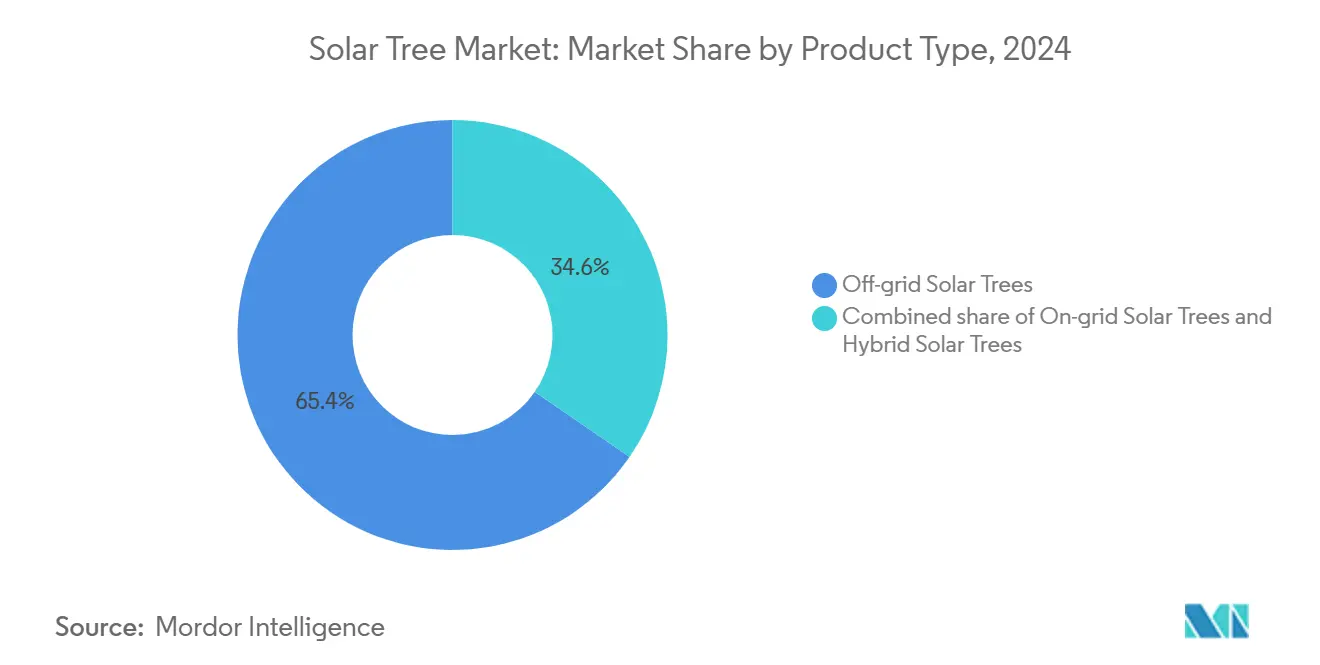
- By product type, off-grid systems held 65.4% of the solar tree market share in 2024, while hybrid configurations are forecast to expand at a 7.5% CAGR through 2030.
- By solar-panel technology, monocrystalline silicon controlled 75% share of the solar tree market size in 2024; thin-film and BIPV solutions are advancing at an 8.5% CAGR to 2030.
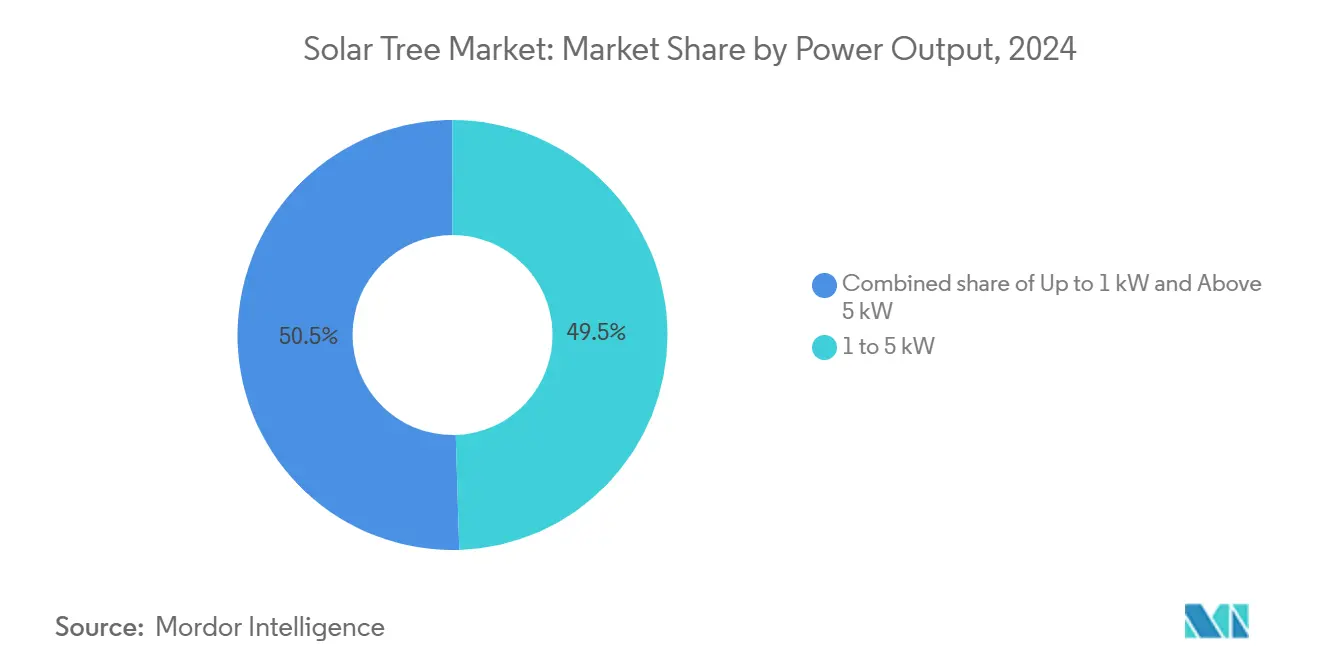
- By power output, 1–5 kW systems captured 49.5% share of the solar tree market size in 2024, with above-5 kW systems registering the fastest CAGR of 6.9% over 2025-2030.
- By installation mode, free-standing foundation units commanded 90.2% of the solar tree market share in 2024, yet modular kits and mobile units are tracking a 10.2% CAGR through 2030.
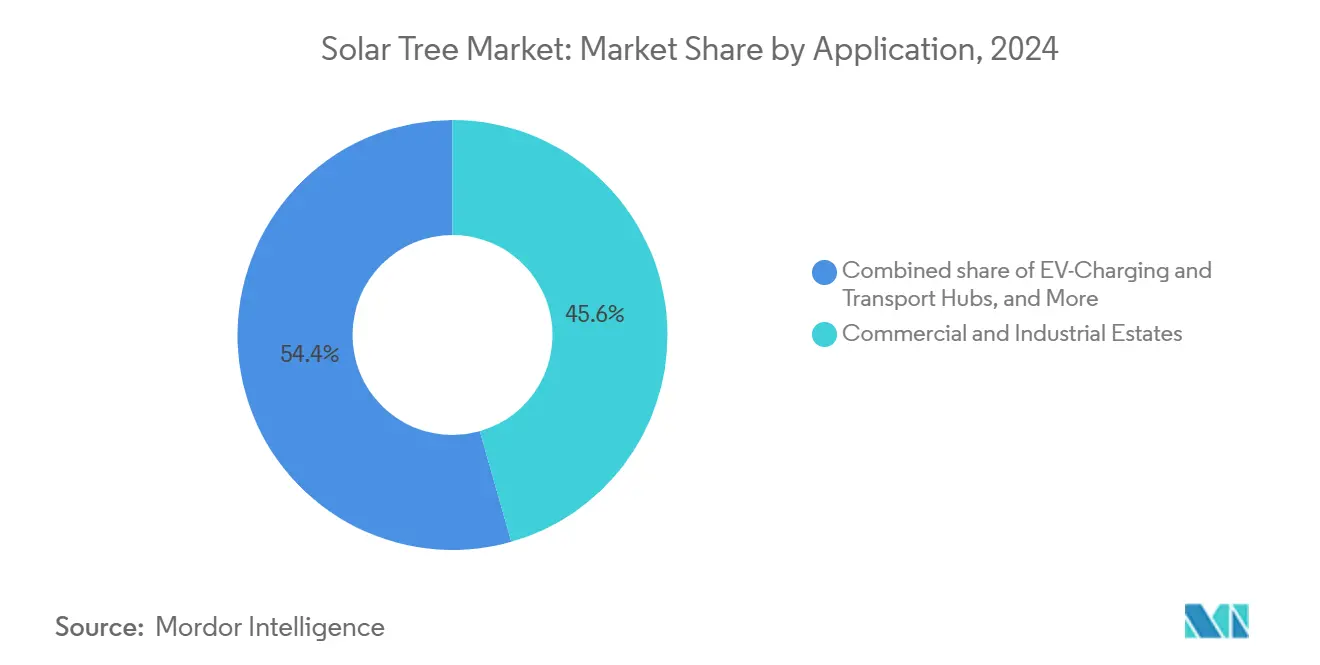
- By application, commercial and industrial estates led with 45.6% revenue share in 2024; EV-charging hubs are poised for the quickest growth at a 7.1% CAGR to 2030.
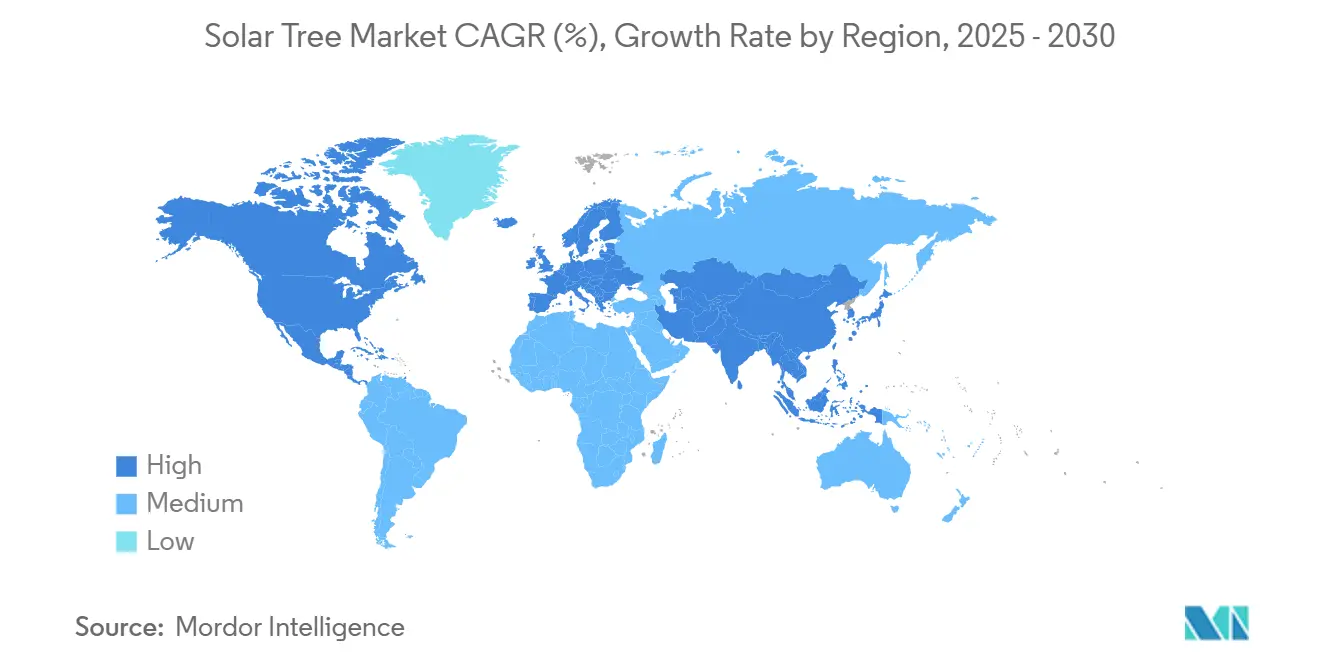
- By geography, Asia-Pacific accounted for 45.5% of 2024 revenue and is expanding at a 6.2% CAGR to 2030
- Beam Global, SmartFlower, and SolarBotanic Trees collectively held 18% of 2024 revenue, reflecting a moderately fragmented competitive field.
Global Solar Tree Market Trends and Insights
Drivers Impact Analysis*
| Driver | (~) % Impact on CAGR Forecast | Geographic Relevance | Impact Timeline |
|---|---|---|---|
| Renewable-energy mandates (70+ countries) | +1.2% | EU, China, India, North America | Medium term (2-4 years) |
| Urban greening & smart-city furniture demand | +0.8% | Asia-Pacific core, spill-over to NA and EU metros | Long term (≥ 4 years) |
| Space-efficient power for land-scarce metros | +1.0% | APAC, Middle East urban centers, selected EU cities | Short term (≤ 2 years) |
| EV-charging nodes requiring solar supply | +0.9% | North America, EU, expanding to APAC | Medium term (2-4 years) |
| Lightweight bio-resin masts cut install time | +0.3% | Early adoption in developed markets | Short term (≤ 2 years) |
| Source: Mordor Intelligence | |||
Renewable-energy Mandates Drive Structural Demand Shift
Solar trees benefit from policies in 70-plus countries that require on-site renewable generation, such as California’s commercial-building rule and New York City’s Local Laws 92/94, because their minimal footprint satisfies compliance without costly land acquisition.(1)Source: Brooklyn SolarWorks Team, “Are Solar Panels Mandatory in NYC?” BrooklynSolarWorks.com The European Union forecasts 93.1 GW of annual solar additions by 2027, a volume that elevates space-efficient solutions in dense urban quarters. Japan’s USD 1.1 billion push into perovskite production further widens the technology toolkit for future solar tree designs. These mandates collectively underwrite baseline demand and spur R&D that lifts output efficiency, making the solar tree market more competitive with rooftop arrays.
Urban Greening Initiatives Merge Energy and Aesthetics
Smart-city programs blend renewable generation with public-realm amenities, positioning solar trees as dual-use assets that supply power, shade, lighting, Wi-Fi, and mobile charging. Singapore’s plan to import 4,000–5,600 MW of clean electricity underscores how land-limited cities leverage vertical solar to balance green-space goals with energy needs. Research shows optimal planning can harmonize tree canopy and photovoltaic access, supporting urban-heat-island mitigation while maintaining solar yield. Dubai’s solar palms exemplify the convergence of design and function, suggesting future deployments will emphasize amenity integration as much as kilowatt output.
Space Scarcity Accelerates Vertical Solutions
Studies document that solar trees occupy 0.01 m² per kilowatt compared with 0.3125 m² for flat PV, translating into 96% land savings and enabling placement where ground or roof area is priced above USD 1,000/m². China’s 200,000-acre Inner Mongolia farm highlights the vast land appetite of conventional solar and validates the appeal of compact alternatives in megacities. A Central Mechanical Engineering Research Institute prototype that yields 3 kW from a 4-ft² base illustrates the technology’s ability to unlock power in micro-sites.
EV Infrastructure Convergence Creates New Applications
The proliferation of fast chargers demands a high-density, renewable power supply. Gravity’s curbside DEAP Trees deliver 200 miles of range in 5 minutes without heavy grid upgrades, expanding the addressable market for autonomous solar-plus-storage units. Costco’s off-grid structures generate 100 MWh yearly, proving the economics for fleet electrification at distribution centers. Modular designs installed within four months shorten project cycles, letting operators sync infrastructure rollout with EV-adoption curves.
Restraints Impact Analysis*
| Restraint | (~) % Impact on CAGR Forecast | Geographic Relevance | Impact Timeline |
|---|---|---|---|
| High initial CAPEX vs. rooftop PV | -1.8% | Global, most pronounced in price-sensitive markets | Medium term (2-4 years) |
| Low consumer / EPC familiarity outside EU | -1.1% | North America, APAC emerging markets, MEA | Short term (≤ 2 years) |
| Height & aesthetic by-laws in heritage districts | -0.6% | EU historic centers, North America urban cores, select APAC cities | Long term (≥ 4 years) |
| Complex O&M for articulated petal designs | -0.4% | Global, with higher impact in regions lacking technical expertise | Medium term (2-4 years) |
| Source: Mordor Intelligence | |||
High Capital Expenditure Limits Market Penetration
Typical installations cost USD 30,000–100,000, out-pricing standard rooftop PV and necessitating longer payback periods.(3)Source: Ukpanah Inemesit, “Solar Trees: The Future of Green Energy,” GreenMatch.co.uk Life-cycle analysis finds 74% of total costs accrue post-installation, mainly in inverters and balance-of-system components, raising bankability hurdles. Rising interest rates dented U.S. rooftop-solar installations by 20% in 2024, a proxy for the sensitivity of premium segments to financing conditions. Manufacturers respond with modularity and automation, which cut production costs by 90% over the past decade, yet sticker prices remain elevated relative to rooftop solutions.
Market Education Barriers Slow Adoption Outside Europe
Fragmented supply chains and limited standards mean many engineering, procurement, and construction firms lack proven playbooks, inflating risk premiums.(2)Source: Louise Frohlich, “SmartFlower looks to shake up solar,” TheEcoExperts.co.uk Historic-district controls and visual-impact reviews add permitting steps that lengthen timelines in North America’s oldest urban cores. The skills gap extends to planners who must balance canopy preservation with solar access, a dual objective that remains unfamiliar in emerging markets. Training and certification programs are growing, but trail the extensive infrastructure supporting conventional PV, constraining early-stage adoption.
*Our forecasts treat driver/restraint impacts as directional, not additive. The impact forecasts reflect baseline growth, mix effects, and variable interactions.
Segment Analysis
By Product Type: Off-Grid Systems Dominate, Hybrid Configurations Accelerate
Off-grid units captured 65.4% of 2024 revenue, reflecting the appeal of stand-alone generation in locations that lack reliable grids or where interconnection fees outweigh project economics.(4)Source: World Intellectual Property Organization, “Green rural energy solutions,” WIPO.int Their ability to deliver instant, permit-light power gives them an edge in rural electrification, temporary worksites, and disaster-response settings where speed and autonomy matter more than kilowatt-hour cost. Demand is further reinforced by national micro-grid programs that subsidize resilient energy for critical services in Southeast Asia and sub-Saharan Africa. Hybrid architectures, combining grid-tied operation with battery backup, are the fastest-growing category at a 7.5% CAGR as cities insist on resilience for public Wi-Fi, lighting, and EV charging.
Hybrid uptake also reflects falling storage prices and new feed-in tariffs that reward operators for exporting surplus energy at peak times. Municipal buyers value the option to island during outages without forfeiting net-metering income in normal conditions. On-grid systems remain a niche reserved for campuses and corporate parks where grid access is inexpensive and demand charges are low. As a result, off-grid and hybrid models together account for more than three-quarters of the solar tree market, a share that is likely to rise as regulators tighten resilience standards for public infrastructure.


By Solar-Panel Technology: Monocrystalline Leads, Thin-Film Gains Ground
Monocrystalline silicon panels held a 75% share of 2024 installations thanks to proven durability, field efficiencies above 22%, and robust supply chains that simplify procurement. Their dominance is also supported by module formats that bolt directly onto existing mast designs, limiting engineering time for each new deployment. Thin-film and building-integrated photovoltaic (BIPV) solutions, however, are expanding at an 8.5% CAGR as perovskite tandem cells set successive world-record efficiencies that now exceed 28% and deliver useful output under diffuse light.
The lightweight, flexible nature of thin-film sheets reduces wind loading on tall installations and simplifies shipping for modular projects. National energy-security programs in Japan and South Korea are channeling billions into perovskite scale-up, accelerating cost declines that threaten the price premium enjoyed by crystalline silicon. As a result, developers focused on aesthetics or weight restrictions—such as heritage sites and pedestrian plazas—are increasingly selecting thin-film modules despite higher upfront prices. Over the forecast horizon, most new projects are expected to mix technologies, pairing high-efficiency mono top panels with lightweight thin-film wraps on shaded flanks to maximize yield per square meter.
By Power Output: Mid-Range Systems Strike the Sweet Spot
Units rated between 1 and 5 kW accounted for 49.5% of revenue in 2024 because they match the load profiles of street lighting, small EV chargers, and campus amenities while keeping structural steel and permitting requirements modest.(5)Source: San Diego Gas & Electric, “Energy Innovation Center – Solar Trees,” SDGE.com This segment also benefits from standardized component kits that compress design timelines to weeks rather than months. Above-5 kW systems are registering the quickest growth at 6.9% CAGR; retailers and logistics centers are scaling canopy arrays to offset rising fleet-charging loads and peak-demand tariffs.
Technology advances are enabling higher wattage without proportionally larger footprints. Three-dimensional tower designs and bifacial panels now lift energy density 10-fold compared with flat arrays of the same ground area. Conversely, sub-1 kW trees remain primarily demonstration or residential showpieces, constrained by limited payback potential relative to rooftop kits. As smart-city budgets widen, the market is expected to split between ubiquitous 2-3 kW “street furniture” and fewer, but much larger, 10 kW-plus clusters at transit depots.
By Installation Mode: Foundation Mounts Prevail, Modular Kits Surge
Free-standing foundation systems dominated with a 90.2% share in 2024 because they provide the structural integrity needed for multi-panel crowns and are not limited by roof loading or tenancy agreements. Civil works add cost, yet municipalities prefer the ability to orient trees for optimal solar gain regardless of surrounding buildings. Versatile anchoring options—pile-driven steel to precast footers—open previously unusable traffic islands and brownfields.
Modular kits and mobile units are advancing at a robust 10.2% CAGR as disaster-relief agencies, event organizers, and construction firms embrace container-size packs that unfold in hours and ship on standard flatbeds. Lightweight bio-resin masts and plug-and-play wiring shrink install crews to two technicians and eliminate heavy machinery on site. Rooftop or terrace mounts fill a narrow niche in megacities where floor-area-ratio rules favor vertical solutions, but wind-loading studies and waterproofing requirements limit their rollout. Over time, modular kits are forecast to convert a slice of foundation demand, especially in markets with high labor costs or stringent permitting hurdles.
By Application: Commercial Footprint Large, EV Hubs Fastest
Commercial and industrial estates contributed 45.6% of revenue in 2024 as companies sought to showcase sustainability credentials while locking in predictable electricity for common-area loads. The segment also benefits from large car-park footprints where solar trees double as shade and brand identity. EV-charging and transport hubs, however, are projected to post a 7.1% CAGR through 2030—the highest among all use cases—because curbside chargers and depot fast-chargers need co-located renewable supply to ease grid-upgrade costs.
Mobility operators value integrated battery storage that supports high-current draws while participating in vehicle-to-grid services during off-peak hours. Educational campuses and public parks continue to adopt solar trees for STEM outreach and community engagement, yet their budget cycles slow volume growth. Rural electrification and agri-use remain a small slice today but hold strategic importance for multilateral lenders funding food-security programs that hinge on reliable pump and cold-storage power. This widening mix underscores how the solar tree market is evolving from an aesthetic statement toward multi-utility infrastructure.
Geography Analysis
Asia-Pacific retained 45.5% of 2024 revenue and is on track for a 6.2% CAGR to 2030, supported by dense urbanization, aggressive renewable-portfolio standards, and regional supply-chain depth that lowers hardware costs. China’s build-out of an 8 GW desert complex demonstrates the scale benefits that spill into component pricing for regional municipal projects. Singapore and Thailand layer policy incentives on imported electricity and regional grid links, ensuring continuous demand for compact, high-yield solutions in land-scarce metros.
North America and Europe form a mature, policy-driven corridor where zero-carbon building codes and corporate ESG targets sustain steady orders despite higher labor costs. California’s commercial solar mandate and New York City’s Local Laws 92/94 set compliance floors that favor vertical arrays when roofs are fully utilized. In Europe, differential tax credits—from Germany’s 30% write-off to Italy’s Superbonus—shape country-level growth trajectories, yet shared land-scarcity issues in historic cores tilt buyers toward sculptural solar options. The 93.1 GW annual solar-addition outlook through 2027 deepens the pipeline for specialty formats that coexist with strict urban-design codes.
South America, the Middle East, and Africa collectively account for a smaller revenue slice but exhibit outsized long-run potential. Falling module prices doubled panel sales in Niger and seeded demand for vertical arrays that can bypass fragile grids. Ghana’s 16.8 MW rooftop showcase illustrates how donor-backed programs accelerate first-mover projects that validate performance under tropical conditions. As financing tools mature, these regions are expected to leapfrog directly to modular, off-grid trees for irrigation, healthcare, and telecom towers.

Competitive Landscape
Fragmentation remains moderate: the top five suppliers controlled roughly 35% of 2024 revenue, while dozens of regional specialists fill geographic and application niches. Beam Global tripled early-2025 storage bookings by bundling proprietary battery packs with solar canopies, signaling a pivot from hardware maker to integrated-energy platform. SmartFlower differentiates on design, offering sun-tracking petals that boost annual yield 40% and appeal to municipalities keen on landmark aesthetics.
Cost-down race centers on automation and modularity. New entrants such as SolarBotanic Trees ship flat-pack kits that cut field labor by half, expanding addressable markets in high-wage economies. Meanwhile, incumbents license lightweight bio-resin mast patents that shave transport weight by 30%, enabling bulk sea freight to remote islands. Partnerships with EV-charger OEMs are emerging as a moat; Gravity’s curbside “DEAP Tree” alliance combines super-fast DC chargers with canopy-mounted PV, capturing premium urban curb space before utilities can reinforce feeders. M&A activity is expected to rise as battery suppliers, panel makers, and charger networks seek end-to-end value chain control.
Despite rapid innovation, high capital cost still restricts volumes, keeping the bargaining power of buyers elevated. Suppliers, therefore, emphasize service contracts, predictive-maintenance analytics, and financing bundles that turn capex into fixed monthly fees. Those able to underwrite power-purchase agreements at competitive kilowatt-hour rates are positioned to consolidate share as municipal tenders increasingly score lifecycle cost rather than upfront price.
Solar Tree Industry Leaders
Beam Global (ex-Envision Solar)
Smartflower Solar
Tata Power Solar – Solar-Tree Division
SolarBotanic Trees Ltd.
Spotlight Solar
- *Disclaimer: Major Players sorted in no particular order

Recent Industry Developments
- March 2025: Tata Power Renewable Energy Limited signed an MoU with the Government of Andhra Pradesh to develop up to 7,000 MW of renewable projects, including hybrid solar-tree clusters.
- February 2025: Beam Global reported a 200% surge in energy-storage sales, driven by bespoke battery packs for solar-tree deployments.
- January 2025: Hanwha Qcells achieved 28.6% efficiency in a perovskite-silicon tandem cell, with pilot production slated for 2026.
- December 2024: RMC Switchgears allocated USD 12 million to build a 1 GWp solar-products plant in Jaipur, India.


Global Solar Tree Market Report Scope
| On-grid Solar Trees |
| Off-grid Solar Trees |
| Hybrid Solar Trees |
| Monocrystalline Silicon |
| Polycrystalline Silicon |
| Thin-film and BIPV |
| Up to 1 kW |
| 1 to 5 kW |
| Above 5 kW |
| Free-standing Foundation |
| Rooftop / Terrace Mounted |
| Modular Kit and Mobile Units |
| Urban Landscaping and Parks |
| Commercial and Industrial Estates |
| Educational and Research Campuses |
| Residential Micro-PV |
| EV-Charging and Transport Hubs |
| Rural Electrification and Agri-uses |
| North America | United States |
| Canada | |
| Mexico | |
| Europe | Germany |
| United Kingdom | |
| France | |
| Italy | |
| NORDIC Countries | |
| Russia | |
| Rest of Europe | |
| Asia-Pacific | China |
| India | |
| Japan | |
| South Korea | |
| ASEAN Countries | |
| Rest of Asia-Pacific | |
| South America | Brazil |
| Argentina | |
| Rest of South America | |
| Middle East and Africa | Saudi Arabia |
| United Arab Emirates | |
| South Africa | |
| Egypt | |
| Rest of Middle East and Africa |
| By Product Type | On-grid Solar Trees | |
| Off-grid Solar Trees | ||
| Hybrid Solar Trees | ||
| By Solar-Panel Technology | Monocrystalline Silicon | |
| Polycrystalline Silicon | ||
| Thin-film and BIPV | ||
| By Power Output | Up to 1 kW | |
| 1 to 5 kW | ||
| Above 5 kW | ||
| By Installation Mode | Free-standing Foundation | |
| Rooftop / Terrace Mounted | ||
| Modular Kit and Mobile Units | ||
| By Application | Urban Landscaping and Parks | |
| Commercial and Industrial Estates | ||
| Educational and Research Campuses | ||
| Residential Micro-PV | ||
| EV-Charging and Transport Hubs | ||
| Rural Electrification and Agri-uses | ||
| By Geography | North America | United States |
| Canada | ||
| Mexico | ||
| Europe | Germany | |
| United Kingdom | ||
| France | ||
| Italy | ||
| NORDIC Countries | ||
| Russia | ||
| Rest of Europe | ||
| Asia-Pacific | China | |
| India | ||
| Japan | ||
| South Korea | ||
| ASEAN Countries | ||
| Rest of Asia-Pacific | ||
| South America | Brazil | |
| Argentina | ||
| Rest of South America | ||
| Middle East and Africa | Saudi Arabia | |
| United Arab Emirates | ||
| South Africa | ||
| Egypt | ||
| Rest of Middle East and Africa | ||


Key Questions Answered in the Report
What distinguishes a solar tree from a conventional rooftop panel array?
A solar tree elevates panels on a mast, freeing ground or roof space while harvesting sunlight across multiple angles, which can raise annual output by up to 23% in land-scarce settings
How long does it take to install a modular solar-tree kit?
Flat-pack kits with bio-resin masts can be erected, wired, and commissioned in 1–2 days once permits are in hand, about six times faster than a comparable car-park canopy
What is the typical payback period for a mid-range solar tree?
In markets with electricity prices above USD 0.18/kWh and solar incentives, a 3 kW tree reaches cash-flow breakeven in 6–8 years, similar to commercial rooftop PV but with the added benefit of public-realm amenities
Can solar trees support fast EV charging?
Yes; integrated battery buffers allow curbside units to deliver up to 200 miles of range in 5 minutes without heavy grid upgrades, making them viable for urban quick-charge scenarios
Which regions currently buy the most solar trees?
Asia-Pacific leads with 45.5% of global revenue, driven by dense cities and aggressive clean-power mandates, while North America and Europe follow due to regulatory requirements for onsite renewables.
How are suppliers reducing the high upfront cost?
Manufacturers are automating mast fabrication and using lightweight composites, initiatives that have cut production expenses by roughly 90% over the last decade.
Page last updated on:


