Market Overview
| Study Period | 2021 - 2031 |
|---|---|
| Forecast Data Period | 2026 - 2031 |
| Historical Data Period | 2021 - 2024 |
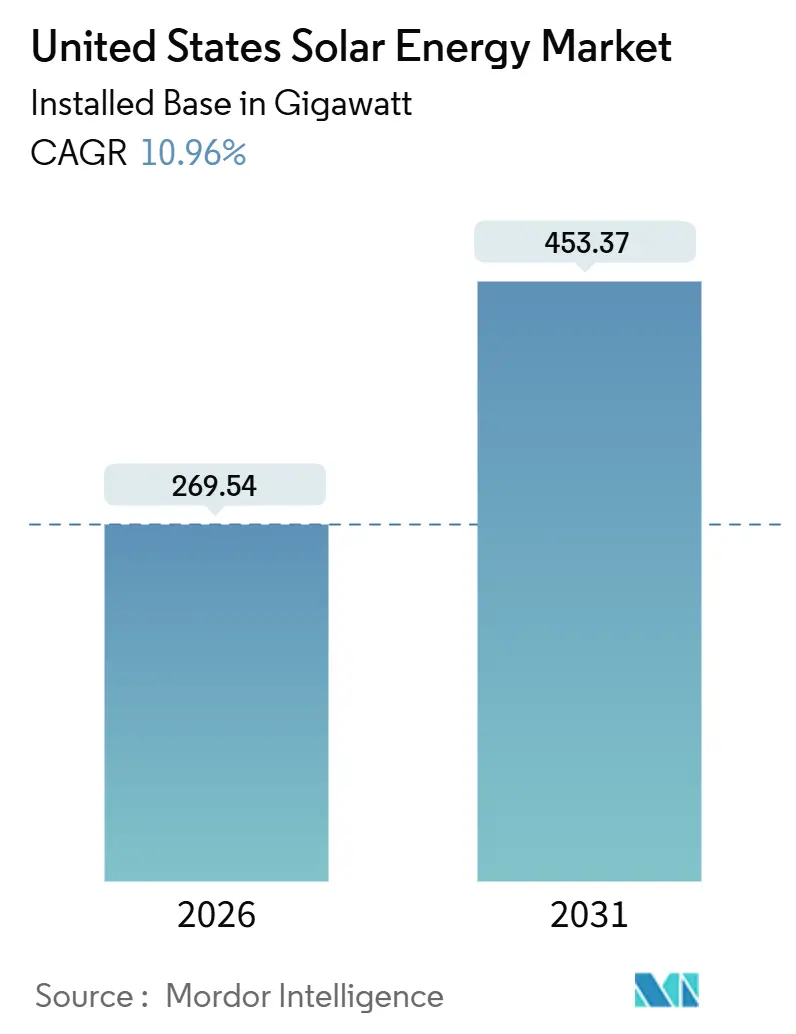
| Market Volume (2026) | 269.54 gigawatt |
| Market Volume (2031) | 453.37 gigawatt |
| Growth Rate (2026 - 2031) | 10.96% CAGR |
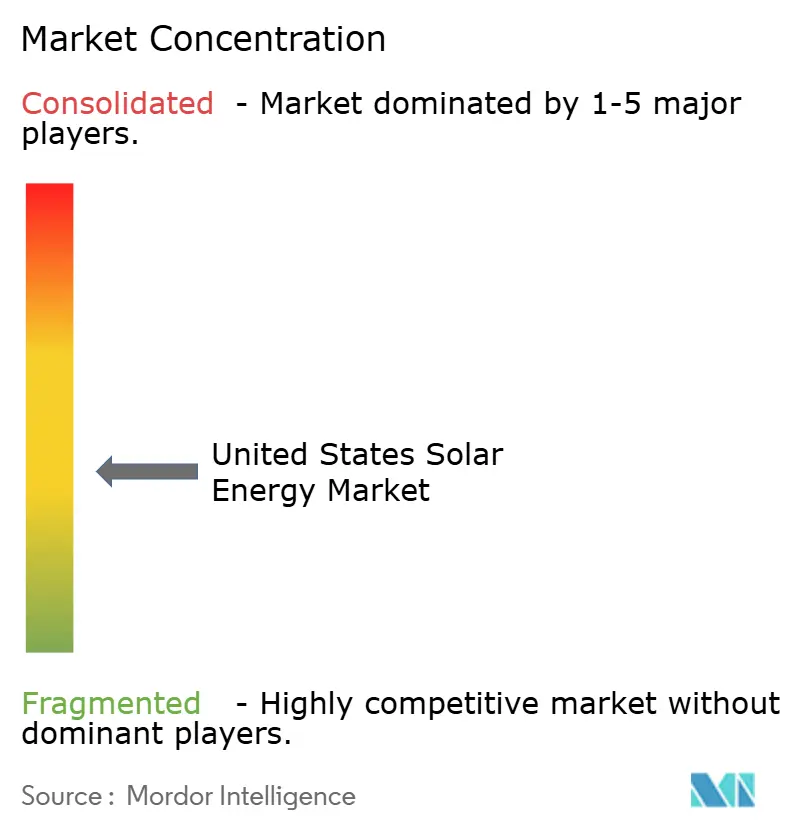
| Market Concentration | Medium |
Major Players *Disclaimer: Major Players sorted in no particular order Image © Mordor Intelligence. Reuse requires attribution under CC BY 4.0. | |
United States Solar Energy Market Analysis by Mordor Intelligence
The United States Solar Energy Market size in terms of installed base is expected to grow from 269.54 gigawatt in 2026 to 453.37 gigawatt by 2031, at a CAGR of 10.96% during the forecast period (2026-2031).
Strong federal incentives contained in the Inflation Reduction Act (IRA) and a shift toward long-dated power-purchase agreements are steering investment toward states that once ranked lower on the solar build-out map, while queue reforms under FERC Order 2023 are gradually unclogging interconnection backlogs. Policy-driven domestic manufacturing credits are reshoring module production and limiting tariff risk, even as Section 201 and 301 trade measures keep short-term price volatility elevated. Hybrid solar-plus-storage projects that harvest evening peak prices are improving lender confidence, lowering debt spreads, and lengthening project life cycles. At the grid edge, community-solar subscriptions and off-grid microgrids are broadening customer access and boosting project resilience, underpinning sustained deployment even where transmission remains constrained.
Key Report Takeaways
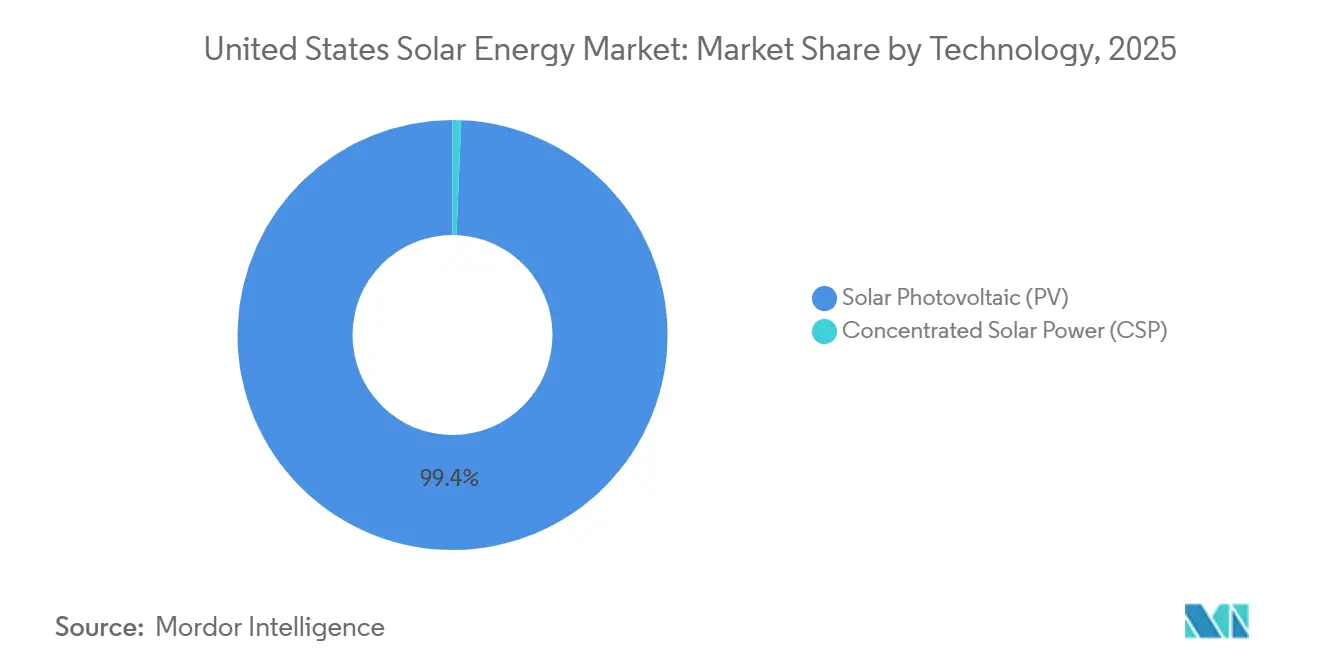
- By technology, solar photovoltaics held 99.35% of the United States solar energy market share in 2025, while concentrated solar power expanded at only 2.1% CAGR through 2031.
- By grid type, on-grid systems captured 97.6% of installed capacity in 2025, whereas off-grid systems are advancing at a robust 19.7% CAGR to 2031.
- By end-user, utility-scale projects commanded 73% of capacity in 2025, but residential installations are the fastest-growing segment at 18.3% CAGR through 2031 in the US Solar Energy Market.
Note: Market size and forecast figures in this report are generated using Mordor Intelligence’s proprietary estimation framework, updated with the latest available data and insights as of January 2026.
United States Solar Energy Market Trends and Insights
Drivers Impact Analysis*
| Driver | (~) % Impact on CAGR Forecast | Geographic Relevance | Impact Timeline |
|---|---|---|---|
| Inflation Reduction Act (IRA) Tax Incentives Accelerating Utility-Scale PPAs | +3.2% | National, with concentration in Texas, California, Midwest industrial corridors | Long term (≥ 4 years) |
| Grid-Edge Storage Pairing Enhancing Project Bankability | +2.1% | National, strongest in California, Texas, Hawaii | Medium term (2-4 years) |
| Corporate Net-Zero Mandates Spurring C&I Power-Purchase Agreements | +1.8% | National, led by technology hubs in California, Virginia, North Carolina | Medium term (2-4 years) |
| Community-Solar Programs Expanding Access in High-Population States | +1.4% | Northeast (New York, Massachusetts, New Jersey), Minnesota, Illinois | Medium term (2-4 years) |
| Domestic Manufacturing Credits Cutting Module Import Risk | +1.6% | National, manufacturing concentrated in Southeast (Alabama, Louisiana, Georgia) | Long term (≥ 4 years) |
| Agrivoltaics Improving Land-Use Economics in the Midwest | +0.9% | Midwest (Iowa, Minnesota, Wisconsin), expanding to Great Plains | Long term (≥ 4 years) |
| Source: Mordor Intelligence | |||
Inflation Reduction Act Tax Incentives Accelerating Utility-Scale PPAs
The uncapped 30% investment tax credit and USD 26 per MWh production tax credit extended through 2034 have ended boom-bust procurement cycles, enabling developers to underwrite projects in Ohio and Pennsylvania that once trailed the Southwest on economics. Stacking prevailing-wage and domestic-content adders can lift total tax benefits above 50% of project cost, a shift redirecting capital toward coal-retirement regions under EPA’s Good Neighbor Plan. Corporate buyers contracted 16.6 GW of solar PPAs in 2024 and are comfortable with 15- to 20-year tenors because IRA certainty reduces revenue risk. The resulting pipeline diversification is broadening the United States solar energy market footprint beyond traditional sunbelt states. As a result, long-term capacity growth now aligns more closely with transmission-upgrade schedules than with federal policy sunsets.
Grid-Edge Storage Pairing Enhancing Project Bankability
Hybrid solar-plus-battery projects represented 63% of capacity in interconnection queues during 2024, driven by accelerated depreciation benefits and the ability to shift energy into evening hours when wholesale prices triple midday levels. California’s NEM 3.0 regime lengthened standalone-solar payback periods, but adding a 10 kWh battery restores homeowner ROI and stabilizes grid demand during high-priced twilight peaks. Utility developers in Texas routinely attach 4-hour lithium-ion systems to capture ERCOT scarcity pricing, which surged to USD 5,000 per MWh during the August 2024 heatwave. Lenders now view storage-paired assets as lower risk, tightening debt spreads by up to 30 basis points. This credit advantage is accelerating market penetration of integrated systems across the United States solar energy market.
Corporate Net-Zero Mandates Spurring C&I Power-Purchase Agreements
More than 100 GW of announced corporate renewable commitments between 2020 and 2024, about 80% solar, are anchored in Scope 2 emissions cuts under Science Based Targets and RE100 guidelines. Amazon, Google, and Microsoft alone signed over 20 GW of solar PPAs in 2024-2025 at prices ranging from USD 25 to USD 35 per MWh, undercutting utility tariffs in data-center corridors of Virginia and North Carolina. Smaller commercial customers adopt shared-array subscriptions or on-site systems financed through third-party PPAs, locking in electricity cost reductions of 15-25% versus retail rates. These agreements are lengthening PPA tenors and smoothing revenue visibility for developers across the United States solar energy market.
Community-Solar Programs Expanding Access in High-Population States
Community solar capacity reached 7.87 GW across 39 states by mid-2024, adding 1.7 GW in the prior year as states increased subscriber caps and accelerated interconnection.[1]National Renewable Energy Laboratory, “Community Solar Market Outlook 2025,” nrel.gov New York’s Inclusive Community Solar Adder now delivers USD 0.05 per kWh premiums for projects serving low-income households, allowing developers to pass on 20% bill discounts without compressing returns. Illinois allocated 575 MW of community-solar blocks in 2024, reserving 40% for environmental-justice zones, and digital enrollment platforms have cut per-customer acquisition costs by half. The model expands the United States solar energy market to renters and shaded-roof homes that cannot host rooftop arrays, steadily widening its addressable base.
Restraints Impact Analysis*
| Restraint | (~) % Impact on CAGR Forecast | Geographic Relevance | Impact Timeline |
|---|---|---|---|
| Interconnection Queue Bottlenecks Increasing Lead-Times Beyond 36 Months | -2.3% | National, most severe in MISO, PJM, SPP regions | Medium term (2-4 years) |
| Section 201/301 Trade Actions Causing Module-Price Volatility | -1.7% | National, affecting all project types | Short term (≤ 2 years) |
| Rising Transmission Congestion Curtailing Southwest Utility Projects | -1.2% | Southwest (California, Arizona, Nevada), Texas | Medium term (2-4 years) |
| Skilled-Labor Shortage Inflating EPC Costs by >18% YoY | -1.5% | National, acute in high-growth states (Texas, Florida, Carolinas) | Short term (≤ 2 years) |
| Source: Mordor Intelligence | |||
Interconnection Queue Bottlenecks Increasing Lead-Times Beyond 36 Months
More than 2,600 GW of generation and storage sat in U.S. queues by mid-2024, 95% of it solar, wind, or batteries—equal to 2.4 times existing grid capacity.[2]Lawrence Berkeley National Laboratory, “Queued Up: Interconnection Trends 2024,” lbl.gov Wait times average five years in MISO and PJM, lifting holding costs and eroding project IRRs by up to 12%. While Order 2023’s cluster-study reforms will streamline new applications, 1,350 GW of legacy projects remain under old rules and are unlikely to clear before 2028. Developers increasingly pursue vertically integrated-utility states, such as Florida and the Carolinas, where queues are shorter and planning is coordinated. Nevertheless, prolonged delays continue to dampen the overall growth outlook for the United States solar energy market.
Section 201/301 Trade Actions Causing Module-Price Volatility
Section 201 tariffs and Section 301 duties on Chinese-origin cells and modules, extended through 2026, introduced 15-25% price swings that complicated EPC contract pricing.[3]U.S. International Trade Commission, “Solar Module Safeguard Extension,” usitc.gov Commerce Department anti-circumvention findings in 2024 froze 15 GW of Southeast-Asian modules in transit, causing project delays and forcing developers to renegotiate PPAs. Although domestic production is scaling under IRA Section 45X credits, output lags demand, and module prices rebounded from USD 0.18 to USD 0.24 per watt by mid-2025. Long-term supply deals with U.S. manufacturers offer tariff certainty but carry a 5-8% cost premium, squeezing margins in the United States solar energy market.
*Our forecasts treat driver/restraint impacts as directional, not additive. The impact forecasts reflect baseline growth, mix effects, and variable interactions.
Segment Analysis
By Technology: Thin-Film Gains Amid Crystalline Dominance
Solar photovoltaics held 99.35% of the United States solar energy market in 2025, expanding at a 10.98% CAGR through 2031.[4]Solar Energy Industries Association, “U.S. Solar Market Insight 2025 Year-in-Review,” seia.org First Solar’s cadmium-telluride technology, though under 5% of capacity, grows swiftly because its lower carbon footprint and domestic-content status unlock maximum IRA adders. TOPCon cells boost module efficiencies to 23%, trimming balance-of-system costs and reinforcing crystalline silicon’s lead. Bifacial modules now account for 60% of utility plants, delivering 10-20% extra yield on reflective sites, an attribute written into 60% of utility RFPs.
Concentrated solar power remains confined to legacy southwestern sites, rising only 2.1% CAGR, constrained by molten-salt storage costs three times higher than lithium-ion batteries. Perovskite-silicon tandems hit 33.9% lab efficiency in 2024 but face durability hurdles, implying commercial rollout post-2030. While crystalline silicon dominates, thin-film’s rise tempers supply-chain risk, reinforcing resilience in the market. The United States solar energy market size tied to thin-film is projected to triple by 2031 as new fabs in Louisiana and Ohio come online.


By Grid Type: Resilience Drives Off-Grid Acceleration
On-grid projects captured 97.6% of capacity in 2025 and remain the backbone of the United States solar energy market because 30-50% federal tax credits apply only to interconnected projects. Wholesale power rates between USD 30 and USD 50 per MWh keep utility-scale LCOE below gas benchmarks across ERCOT and CAISO territories. Yet wildfire-related Public Safety Power Shutoffs in California have catalyzed battery-backed residential demand, highlighting resilience gaps in centralized networks.
Off-grid and microgrid systems are advancing at a 19.7% CAGR, propelled by military, hospital, and data-center customers that accept higher installed costs for energy security. The Department of Defense installed 450 MW of solar microgrids across 30 bases during 2024-2025, illustrating the segment’s scale. Diesel-replacement projects in Alaska and the Dakotas achieve 4-6-year payback despite harsh conditions. Consequently, the United States solar energy market size allocated to off-grid applications is forecast to exceed 11 GW by 2031, a modest but strategic slice of total growth.
By End-User: Residential Outpaces Utility-Scale Growth
Utility-scale plants delivered 73% of installed capacity in 2025, leveraging single-axis trackers and low land prices to achieve USD 20-35 per MWh LCOE in the US Solar Energy Market. Interconnection delays and curtailment risk, however, restrain new ground-mount projects in MISO and CAISO, redirecting capital toward distribution-connected arrays. Corporate PPAs financing 16.6 GW in 2024 have begun shifting to 15-20-year durations, lengthening cash-flow visibility. Nevertheless, merchant models face earnings compression when wholesale spreads narrow.
Residential installations are racing ahead at an 18.3% CAGR as storage bundling restores economics under NEM 3.0 and provides blackout insurance. Sunrun and Tesla have aggregated 1.2 GW of virtual-power-plant capacity, earning homeowners USD 100-300 annually while furnishing utilities with flexible reserves. The United States solar energy market share for residential systems climbed to 3 GW of annual additions in 2025 and is projected to double by 2031. This trajectory underscores how distributed generation can relieve transmission stress and boost overall grid resilience within the broader United States solar energy industry.

Geography Analysis
Texas led new builds in 2025 with more than 15 GW of utility-scale capacity, aided by ERCOT’s energy-only market that rewards solar-plus-storage assets capturing scarcity pricing up to USD 5,000 per MWh. California maintains the largest installed base at over 50 GW, yet transmission congestion forced 2.6 TWh of curtailments in 2024, signaling the need for accelerated line upgrades in the US Solar Energy Market.
The Southeast, Florida, Georgia, and the Carolinas, have become a growth hotspot because vertically integrated utilities align generation and transmission planning, cutting development timelines below two years. Midwest states such as Ohio and Pennsylvania are newly competitive as IRA domestic-content adders offset lower insolation, enabling project IRRs similar to those in Arizona. Agrivoltaic models in Iowa and Minnesota generate combined crop and energy revenues exceeding USD 1,200 per acre, easing land-use conflicts and expanding the United States solar energy market footprint.
The Northeast leverages community-solar policies to reach the 48% of households unable to host rooftop arrays, with New York’s Inclusive Community Solar Adder raising developer returns by 5 cents per kWh. Alaska and Hawaii deploy microgrids to displace diesel costs of USD 0.40-0.80 per kWh, aligning with Hawaii’s 2045 100% renewable statute. Transmission shortfalls in MISO and CAISO continue to steer capital toward distribution-level or behind-the-meter solutions, fragmenting geographic concentration but sustaining nationwide growth in the United States solar energy market.
Competitive Landscape
Manufacturing concentration is moderate in the US Solar Energy Market: the top five module suppliers, First Solar, Hanwha Q CELLS, Canadian Solar, JinkoSolar, and Trina Solar, held roughly 60% shipment share in 2025. First Solar’s 14 GW cadmium-telluride capacity unlocks full domestic-content and prevailing-wage adders, letting it undercut tariff-laden imports on lifecycle cost. Hanwha Q CELLS’ 8.4 GW Georgia facility, operational since late 2025, brings crystalline-silicon output within 10% of Southeast-Asian cost benchmarks.
Component makers such as Enphase (micro-inverters) and Nextracker (trackers) embed machine-learning controls that boost bifacial-module yield by up to 3%, now specified in 60% of utility RFPs. Project development remains fragmented, with more than 200 EPC firms active. Sunrun and Tesla aggregate residential systems into grid-service portfolios that earn recurring revenue in addition to system sales. NextEra, Duke, and Southern are consolidating pipelines to meet state clean-energy mandates, while private-equity owners recycle capital post-COD. Section 201 and 301 trade actions accelerate domestic supply-chain buildout but heighten single-source risk if ramp-up lags demand, a dynamic closely watched across the United States solar energy market.
United States Solar Energy Industry Leaders
First Solar Inc.
NextEra Energy Inc.
Hanwha Q CELLS USA
Canadian Solar Inc.
Tesla Energy
- *Disclaimer: Major Players sorted in no particular order

Recent Industry Developments
- April 2025: TPG acquired Altus Power for USD 2.2 billion, securing the nation’s largest commercial-scale solar portfolio.
- April 2025: Boviet Solar opened a North Carolina plant worth USD 294 million, launching 2 GW of initial capacity with plans to reach 4 GW.
- April 2025: Waaree Energies has secured approval from its Board to double its solar module manufacturing capacity at its Brookshire facility in Texas, USA. The company is adding a new 1.6 GW unit to its existing 1.6 GW setup, elevating the total capacity to a significant 3.2 GW, specifically catering to the U.S. market.
- June 2024: Entergy and NextEra Energy Resources agreed to co-develop up to 4.5 GW of solar and storage assets.


United States Solar Energy Market Report Scope
Solar energy is the energy obtained from the sun's rays converted into thermal or electrical energy. It is the cleanest form of energy that is abundant in nature. Solar energy is harnessed by photovoltaics, heating & cooling, and concentrated solar power. Due to the development of resilient technology, today, solar energy is mainly used to generate electricity by various consumers, including residential, industrial, and commercial.
The United States solar energy market is segmented by technology, grid type, end-user, and geography. By technology, the market is segmented into solar photovoltaic and concentrated solar power. By grid type, the market is segmented into on-grid and off-grid systems. By end-user, the market is segmented into utility-scale, commercial and industrial, and residential installations. For each segment, market sizing and forecasts have been carried out on the basis of installed capacity, measured in gigawatts (GW).
By Technology
| Solar Photovoltaic (PV) |
| Concentrated Solar Power (CSP) |
By Grid Type
| On-Grid |
| Off-Grid |
By End-User
| Utility-Scale |
| Commercial and Industrial (C&I) |
| Residential |
By Component (Qualitative Analysis)
| Solar Modules/Panels |
| Inverters (String, Central, Micro) |
| Mounting and Tracking Systems |
| Balance-of-System and Electricals |
| Energy Storage and Hybrid Integration |
| By Technology | Solar Photovoltaic (PV) |
| Concentrated Solar Power (CSP) | |
| By Grid Type | On-Grid |
| Off-Grid | |
| By End-User | Utility-Scale |
| Commercial and Industrial (C&I) | |
| Residential | |
| By Component (Qualitative Analysis) | Solar Modules/Panels |
| Inverters (String, Central, Micro) | |
| Mounting and Tracking Systems | |
| Balance-of-System and Electricals | |
| Energy Storage and Hybrid Integration |


Key Questions Answered in the Report
What is the projected capacity of the United States solar energy market by 2031?
Installed capacity is forecast to reach 453.37 GW, expanding at a 10.96% CAGR.
How are IRA tax incentives influencing new solar projects?
Uncapped investment and production credits, plus domestic-content adders, now offset up to 50% of project cost, improving project economics nationwide.
Why are hybrid solar-plus-storage projects gaining momentum?
Batteries shift solar output to high-price evening hours, diversify revenues, and secure tighter lending terms, accelerating deployment.
Which segment is the fastest-growing in the United States solar energy market?
Residential rooftop installations, particularly battery-paired systems, are advancing at an 18.3% CAGR through 2031.
How do Section 201 and 301 tariffs affect module pricing?
Combined trade actions cause 15-25% price swings, prompting developers to favor long-term contracts with domestic manufacturers to lock in costs.
Page last updated on:


