Solar Panel Cleaning Market Size and Share
Market Overview
| Study Period | 2021 - 2031 |
|---|---|
| Market Size (2026) | USD 1.54 Billion |
| Market Size (2031) | USD 2.34 Billion |
| Growth Rate (2026 - 2031) | 8.75% CAGR |
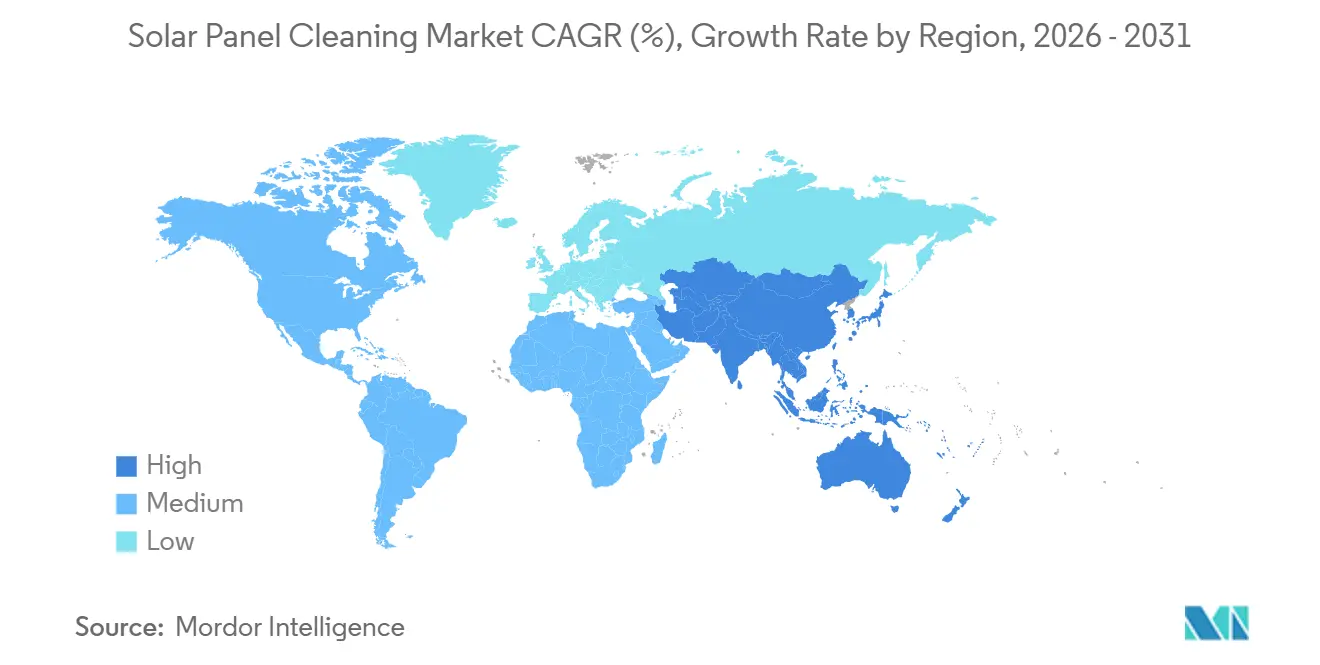
| Fastest Growing Market | Asia Pacific |
| Largest Market | Asia Pacific |
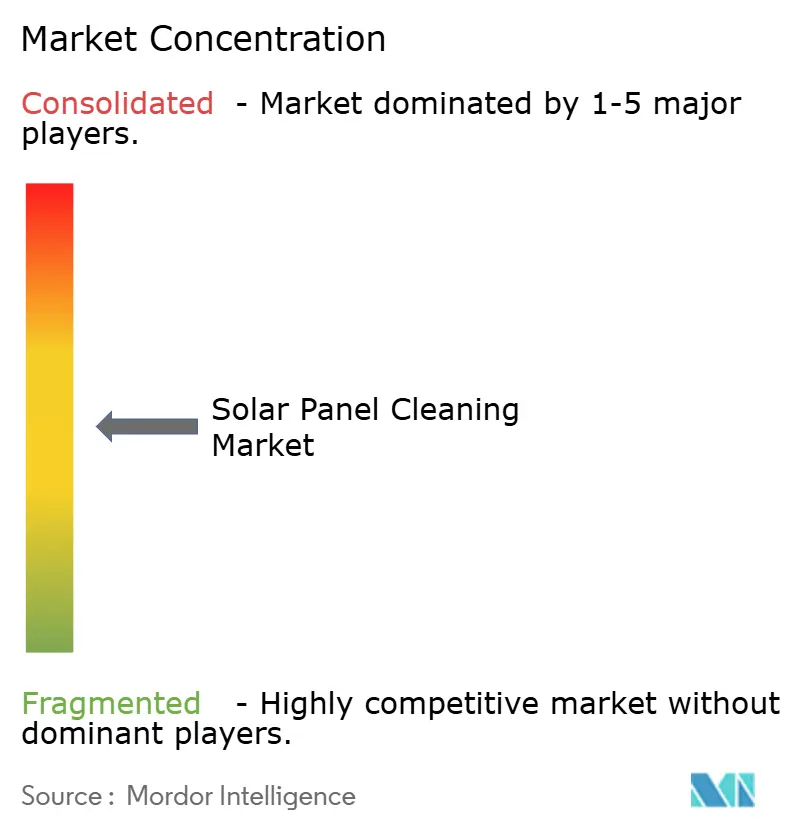
| Market Concentration | Medium |
Major Players
*Disclaimer: Major Players sorted in no particular order Image © Mordor Intelligence. Reuse requires attribution under CC BY 4.0. |
|
Solar Panel Cleaning Market Analysis by Mordor Intelligence
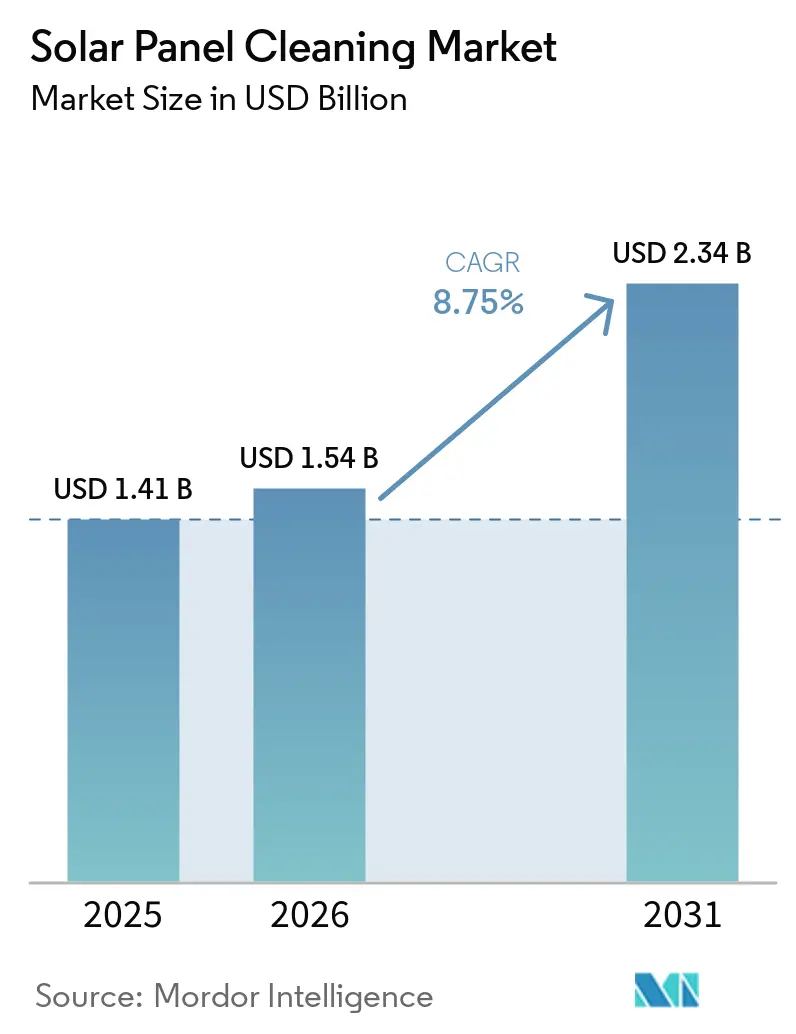
The Solar Panel Cleaning Market size is projected to expand from USD 1.41 billion in 2025 and USD 1.54 billion in 2026 to USD 2.34 billion by 2031, registering a CAGR of 8.75% between 2026 to 2031. Rising utility-scale photovoltaic projects in arid zones, corporate power-purchase agreements that penalize soiling losses, and module warranties embedding anti-soiling KPIs are reshaping procurement decisions across the solar panel cleaning market. Automated dry-brush robots that eliminate water logistics are gaining momentum as water-neutral operations become an ESG imperative in the Middle East, North Africa, and Australia. Asia-Pacific dominates revenue today and will sustain a double-digit growth pace as China scales robotic manufacturing and India mandates biweekly cleaning cycles in state-level park tenders. Competitive rivalry stays moderate because the top five suppliers command only about one-third of global sales, leaving regional specialists ample headroom to target niche deployments such as floating PV arrays and agrivoltaic farms.
Key Report Takeaways
- By cleaning method, wet cleaning led with a 60.0% share of the solar panel cleaning market in 2025, while dry systems are forecast to expand at an 11.7% CAGR through 2031.
- By technology level, manual tools accounted for 50.2% of 2025 revenue in the solar panel cleaning market; fully autonomous robots are advancing at an 11.4% CAGR to 2031.
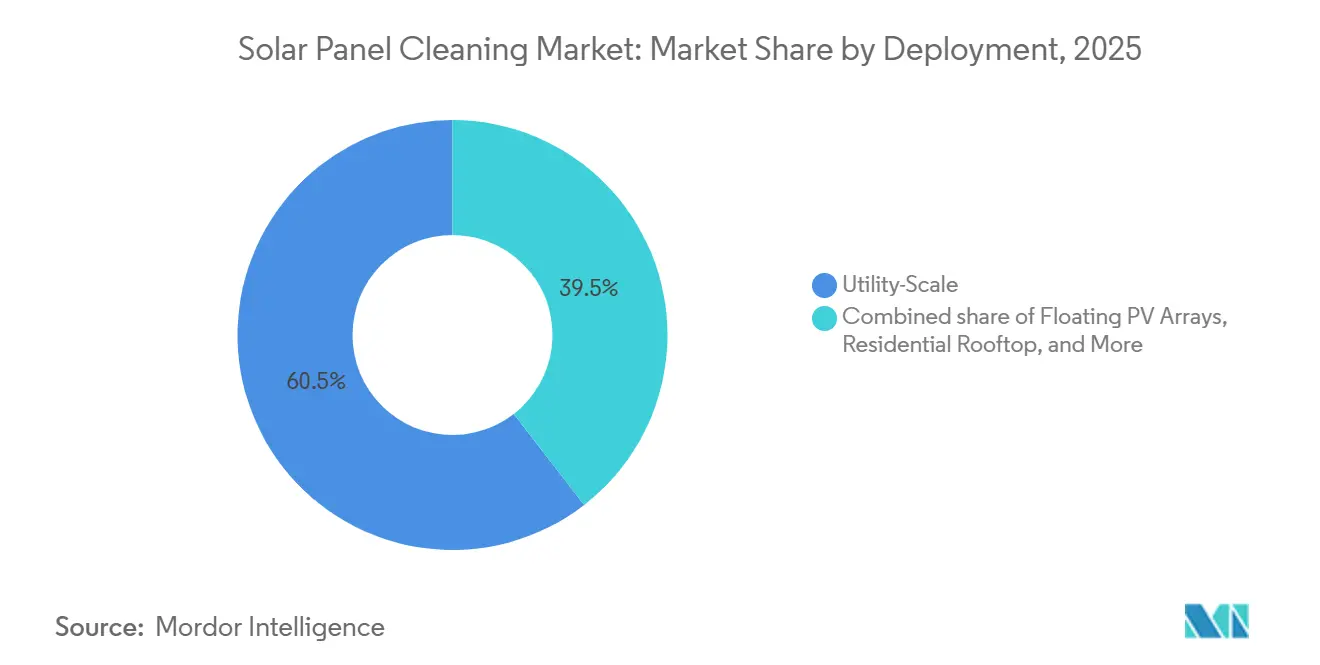
- By deployment, utility-scale installations above 1 MW captured 60.5% of the solar panel cleaning market share in 2025, whereas floating PV arrays will post the fastest 14.1% CAGR through 2031.
- By service model, in-house O&M teams held 45.4% revenue in 2025, but Robot-as-a-Service subscriptions are projected to grow at 12.5% annually to 2031.
- By geography, Asia-Pacific contributed 45.1% to the solar panel cleaning market share in 2025 and is expanding at a 10% CAGR through 2031.
Note: Market size and forecast figures in this report are generated using Mordor Intelligence’s proprietary estimation framework, updated with the latest available data and insights as of January 2026.
Global Solar Panel Cleaning Market Trends and Insights
Drivers Impact Analysis*
| Driver | (~) % Impact on CAGR Forecast | Geographic Relevance | Impact Timeline |
|---|---|---|---|
| Rapid utility-scale PV build-outs in arid zones | +2.5% | MENA, Australia, Southwest US, Rajasthan (India) | Medium term (2-4 years) |
| Stricter O&M performance-ratio contracts | +1.8% | Global, with early adoption in EU and North America | Short term (≤ 2 years) |
| Falling LCOE of dry-brush robotic systems | +2.2% | Global, strongest in water-scarce regions (MENA, Australia) | Medium term (2-4 years) |
| PV module warranties adding anti-soiling KPIs | +1.5% | Global, led by Tier-1 module manufacturers | Medium term (2-4 years) |
| ESG-driven water-neutral O&M mandates | +1.3% | North America, EU, corporate PPA markets globally | Long term (≥ 4 years) |
| Source: Mordor Intelligence | |||
Rapid Utility-Scale PV Build-Outs in Arid Zones
Soiling losses of up to 70% in Saudi Arabia’s Shuaibah and Sudair complexes have made frequent cleaning cycles financially critical, triggering contractual mandates in Rajasthan’s 1 GW Pugal park that fine operators INR 6 per kWh for under-performance. Large arrays in Queensland and New South Wales battle dust storms that now justify 24/7 robotic fleets equipped with LiFePO4 batteries capable of climbing 20-degree slopes. The IEA estimates soiling erodes 4-7% of global PV output, equal to EUR 5 billion in lost revenue each year [1]International Energy Agency, “Task 13 Guidelines for O&M of PV Plants,” iea-pvps.org. Suppliers respond with terrain-adaptive tracks and lightweight composites that lower transport costs to remote desert sites. These innovations reinforce an ecosystem where automated cleaning protects power-purchase guarantees and underpins bankability for gigawatt-scale builds.
Stricter O&M Performance-Ratio Contracts
Generation thresholds embedded in West Bengal’s 10 MW rooftop tender and Chile’s 181.25 MWac ENGIE project force service providers to shoulder soiling risk, catalyzing demand for robots that capture and transmit photographic proof of every cleaning cycle. SECIs standardized O&M template now requires biweekly cleaning during monsoon and post-harvest dust peaks, aligning Indian practice with EU Renewable Energy Directive standards. Asset owners in Spain and Italy link incentive payments to real-time fleet data, compelling vendors to integrate cloud-based dashboards and predictive maintenance analytics. The net result is a performance-driven procurement environment where cleaning cadence, not just equipment price, determines contract awards.
Falling LCOE of Dry-Brush Robotic Systems
Economies of scale have trimmed per-unit robot costs below USD 30,000 for rail-mounted models, slicing payback periods to as little as 12 months for high-soiling MENA sites. TrinaRobot deployments in Albania and Malaysia post 8-14% generation uplifts, while IFBOT’s ultra-light 6.2 kg crawler broadens rooftop applicability. U.S. domestic assembly incentives under the Inflation Reduction Act reduce lead times and avoid Foreign Entity of Concern constraints, pushing localized content to the fore. Adani Green Energy reports 283 million liters of water saved annually after switching 2,070 MW to dry robots, underscoring the dual cost-and-sustainability advantage of water-free cleaning.
PV Module Warranties Adding Anti-Soiling KPIs
Tier-1 manufacturers now cap allowable annual soiling losses at 3-5%, with breach clauses that void performance guarantees if cleaning logs lapse. Bifacial modules magnify this pressure, as rear-surface dust degrades albedo gains, necessitating dual-brush robots like SolarCleano’s L1 that rotate at 200 RPM even on 27-degree slopes. IEA Task 13 cautions that improper snow removal can fracture cells, so vendors are redesigning soft-roller heads to satisfy colder European climates. These warranty clauses have turned cleaning compliance into a legally enforceable KPI, fast-tracking procurement of autonomous systems.
Restraints Impact Analysis*
| Restraint | (~) % Impact on CAGR Forecast | Geographic Relevance | Impact Timeline |
|---|---|---|---|
| High capex of fully-autonomous robots | -1.5% | Global, most acute in residential and small commercial segments | Short term (≤ 2 years) |
| Limited ROI for rooftops <50 kW | -0.8% | North America, Europe, distributed residential markets | Medium term (2-4 years) |
| Regulatory gray-zones on micro-plastics from brush wear | -0.5% | EU, with potential spillover to California and Canada | Long term (≥ 4 years) |
| Skilled-labor shortages for robot fleet servicing | -0.7% | Remote utility-scale sites in MENA, Australia, Latin America | Medium term (2-4 years) |
| Source: Mordor Intelligence | |||
High Capex of Fully-Autonomous Robots
Price tags of USD 50,000-150,000 per unit impose decade-long paybacks on 10 kW U.S. rooftops earning only USD 4,500 annually. Serbot’s joystick-controlled PV Eco STANDARD eases cost barriers but still demands human presence, slowing adoption below the 50 kW threshold. BladeRanger, holding 18% segment revenue, focuses on multi-MW contracts where fleets amortize cost over scale. Rising interest rates and declining net-metering incentives kept U.S. residential solar installations down 31-32% in 2024, dampening demand for expensive automation. Leasing models and Robot-as-a-Service convert capex to opex, yet subscription fees remain uneconomic for scattered rooftop owners.
Skilled-Labor Shortages for Robot Fleet Servicing
Quarterly sensor calibrations and brush swaps cost USD 2,000-5,000 per robot in hard-to-reach Saudi desert sites, where technicians flown from Riyadh escalate service budgets. TrinaRobot’s modular packs reduce downtime, but IP65 electronics still require specialized handling. IEA guidelines urge climate-specific training, yet vocational programs lag in emerging markets, creating bottlenecks through 2028. IFBOT’s self-diagnostic firmware lowers skill thresholds, although labor gaps persist as fleet populations outpace technician certification. Geographic dispersion of projects makes centralized training impractical, incentivizing vendors to embed more autonomous fault-recovery features.
*Our forecasts treat driver/restraint impacts as directional, not additive. The impact forecasts reflect baseline growth, mix effects, and variable interactions.
Segment Analysis
By Cleaning Method: Dry Systems Gain as Water Logistics Constrain Wet Approaches
Dry-brush robots captured a growing share as wet cleaning retained 60.0% of the solar panel cleaning market size in 2025. High-pressure jet systems dominate coastal Spain, Italy, and the UAE, where salt films demand periodic rinsing, while Solaris Hydrobotics’ water-motor robots consume only 0.5-1.5 liters per panel and thrive where water is plentiful yet grid power is absent [2]Solaris Hydrobotics, “H-Series Autonomous Cleaners Brochure,” solaris-hydrobotics.com.
Ecoppia’s 3,900 MW of water-free deployments illustrate how eliminating tanker-truck logistics cuts operating expenses 30-40% in deserts. Triboelectric electrodynamic screens tested by Bluesky and Nomadd remove 90% of dust in seven minutes, offering a future zero-brush solution. Biodegradable agents from Chemitek enable drone spraying over agrivoltaic rows, blending wet and aerial techniques into a hybrid toolkit. As water prices surpass USD 5 per m³ in MENA, dry platforms are steadily eroding wet dominance, and the solar panel cleaning industry is witnessing procurement policies that now default to zero-water options for plants entering service after 2026.


By Technology Level: Autonomous Robots Displace Manual Tools in Utility Segment
Manual equipment still holds 50.2% of 2025 revenue in the solar panel cleaning market share, chiefly across residential and sub-MW rooftops where low labor costs outweigh efficiency gains [3]Serbot AG, “pvEco STANDARD Data Sheet,” serbot.com. Semi-automatic trolleys bridge affordability gaps for Indian and Southeast Asian C&I sites with mixed roof angles.
Fully autonomous robots are scaling at an 11.4% CAGR, aided by GPS positioning accurate to ±10 cm, machine vision, and night-time operation that avoids thermal shock. FAA approval for multi-drone solar missions in 2025 positions aerial systems to complement ground crawlers on irregular terrain. EAUAV drones cleaning 8,000-10,000 m² daily expand access to high-elevation arrays, while Infosys-Kaynes’ Kleinbot targets compact roofs shaded by HVAC units. The solar panel cleaning industry as a whole is moving toward integrated fleets mixing ground robots and drones, accelerating the retirement of purely manual regimes.
By Deployment: Floating PV Arrays Demand Specialized Access Solutions
Utility-scale plants above 1 MW generated 60.5% of 2025 revenue, leveraging robotic fleets that clean 2,000 m² per hour at costs below USD 1,000 per MW annually. Brazil’s 69 MWp Lajeado floating array and Paraguay’s 1 MWp Itaipu pilot illustrate a surge toward water-surface installations that curb evaporation by up to 50%.
Floating projects will rise at a 14.1% CAGR as suppliers modify IP65 robots with buoyant pontoons and corrosion-resistant drives. Residential rooftops under 20 kW remain manual because capital recovery for robots exceeds 10 years, but C&I systems in the 20 kW-1 MW band are adopting lightweight crawlers such as IFBOT’s X3 for quick ROI. NTPC’s 250 MW Bikaner project, using 2,500 Sol-Bright robots, shows that economies of scale firmly anchor automation in the utility domain, while specialized floating-PV robots command price premiums that lift margins for manufacturers.
By Service Model: RaaS Subscriptions Shift Capex to Opex for IPPs
In-house O&M teams controlled 45.4% of global revenue in 2025, favored by state utilities in China and India that negotiate bulk robot discounts. Third-party contractors are increasingly favored for geographically dispersed portfolios as they offer integrated service packages that combine labor, insurance, and analytics, enhancing operational efficiency and cost management.
Robot-as-a-Service subscriptions, charging USD 1,500-3,000 per MW monthly, are scaling at 12.5% annually as private equity-backed IPPs prioritize balance-sheet flexibility. Solidus Techno Power’s partnership with Sol-Bright in Rajasthan embeds biweekly cleaning into turnkey O&M, signalling a shift from equipment ownership to performance procurement. While RaaS is uneconomic for small rooftops, projections suggest it could reach 40% penetration by 2031 as financiers grow comfortable underwriting subscription contracts.
Geography Analysis
Asia-Pacific accounted for 45.1% of global revenue in 2025 and is forecast to grow at 10.0% annually through 2031. China’s module output of 289 GW and India’s biweekly cleaning mandates anchor demand, while TrinaRobot’s cross-row systems improved generation 8-15% across 152 MW in Albania and 100 MW in Malaysia. Japan, South Korea, and ASEAN nations added 41.4 GW of solar capacity in 2022, driving the uptake of portable robots suited to dense urban rooftops.
North America’s utility-scale buildout surged 73% from 2021 to 2024 on the back of the Inflation Reduction Act, but residential installations fell 31-32% in 2024 as interest rates climbed. Desert states like Arizona and Sonora rely on dry-brush fleets to avoid USD 1,000-plus water-truck runs. Canada’s Ontario and Alberta favor semi-automatic platforms that can double as snow-removal tools without violating module warranties.
Europe added 41.4 GW in 2022 and aims for 450 GWac under REPowerEU, with Spain’s seasonal dust curtailing output up to 15% during dry spells. Hybrid regimes using dry robots for routine cycles and wet systems for deep cleans are now standard in Spain and Portugal. Nordic arrays prioritize soft-roller snow solutions, while Germany’s feed-in tariffs spur rooftop growth, demanding lightweight portable equipment.
The Middle East and Africa experience the planet’s worst soiling rates up to 0.9% per day,y making water-free robots essential. Saudi Arabia’s Vision 2030 complexes employ Ecoppia fleets that reach 99.92% cleaning efficiency without a single liter of water. South Africa and Egypt follow suit as water scarcity converges with ambitious solar pipelines, reinforcing the region’s status as a bellwether for dry-brush innovation.

Competitive Landscape
The solar panel cleaning market remains moderately concentrated. Ecoppia commands first-mover scale with 3,900 MW deployed and 16,000 MW under contract, yet Chinese rivals Sol-Bright and TrinaRobot undercut pricing by 20-30% through localized supply chains. BladeRanger’s 18% segment share in fully automatic robots stems from EPC bundling strategies that anchor equipment sales within turnkey solar packages.
Vertical integration is accelerating as module giants acquire cleaning startups to guarantee power-plant performance. SunBrush and Sun-X formed Suntex in 2025 to merge European manufacturing with sensor expertise, while TrinaRobot leveraged its state laboratory to launch Buildex installation robots in 2025 and then pivot into cleaning. Drone innovators VisionWave and Objectif Drone secured multi-country permits, signaling aerial systems’ disruption potential in terrain where ground crawlers falter.
White-space opportunities persist in residential and agrivoltaic niches where unit economics and crop-row obstacles challenge today’s heavy robots. Electrostatic screens under development by Bluesky and Nomadd promise zero-brush, zero-water cleaning within three years, and Chemitek’s biodegradable agents open doors for drone-spray services. Software capabilities now differentiate leaders as IoT dashboards, AI-driven maintenance alerts, and API integration with SCADA become table stakes for contract awards.
Solar Panel Cleaning Industry Leaders
-
Ecoppia
-
SunBrush mobil GmbH
-
Kärcher
-
Serbot AG
-
SolarCleano
- *Disclaimer: Major Players sorted in no particular order

Recent Industry Developments
- March 2026: Researchers from Scotland, China, and India developed a transparent, water-repellent coating that could enhance solar panel efficiency by making them self-cleaning. This dual-layer coating repels water, dust, and dirt without compromising the light transmission to photovoltaic cells. Unlike many existing solutions, it is free from per- and polyfluoroalkyl substances (PFAS), commonly known as forever chemicals. This breakthrough was published in the academic journal Colloids and Surfaces A: Physicochemical and Engineering Aspects.
- February 2026: Chemitek Solar announced the upcoming launch of a cleaning solution specifically designed for agrivoltaic systems, which can be applied using drones. The Drone AgroPV Cleaning Agent, part of Chemitek Solar’s AgroPV product range, will be officially introduced at Intersolar Europe 2026 in June. This biodegradable solution complements the company’s portfolio of cleaning, water treatment, and soiling mitigation products tailored for agrivoltaic applications.
- September 2025: North Central Railway (NCR) successfully tested drone-based solar panel cleaning at Subedarganj Station, Prayagraj, as part of the Indian Railways’ Solar Mission. The 19-kg drone, equipped with a 10-litre water tank and four nozzles, operated for 22 minutes using GPS, efficiently cleaning panels while minimizing water usage.
- May 2025: A startup incubated at Dr. Panjabrao Deshmukh Krishi Vidyapeeth (PDKV), Akola, announced the development of a drone capable of cleaning a 1-megawatt solar energy project in just 30 minutes using clean water. This innovation, developed under the guidance of Dr. S.R. Kalbande, director of PDKV-RIF and dean of agricultural engineering, in collaboration with Indian Drone Research and Development Pvt Ltd, provides a faster, automated, and eco-friendly alternative to traditional manual cleaning methods.


Global Solar Panel Cleaning Market Report Scope
Solar panel cleaning is crucial for maintaining energy efficiency by removing dust, dirt, and other residues that obstruct sunlight and reduce power output. Methods such as water cleaning, soft brushing, or automated systems are commonly used. Regular maintenance, particularly in dusty regions, enhances performance, extends panel lifespan, and maximizes return on investment while ensuring safe handling to avoid damage.
The solar panel cleaning market is segmented by cleaning method, technology level, deployment, service model, and geography. By cleaning method, the market is segmented into wet, dry, electrostatic, and coating-based solutions. By technology level, the market is segmented into manual, semi-automatic, autonomous robots, and drones. By deployment, the market is segmented into residential, commercial, industrial, utility-scale, and floating PV systems. By service model, the market is segmented into in-house, third-party services, and Robotics-as-a-Service (RaaS). The report also covers market sizes and forecasts for the global solar panel cleaning market across major countries and regions. For each segment, market sizing and forecasts have been conducted on the basis of value (USD).
| Wet (Water-Fed Brush, High-Pressure Jet) |
| Dry (Rotary Brush, Air-Blast) |
| Electrostatic / Ionic |
| Coating-Based Self-Cleaning (Hydrophobic, Anti-Soiling) |
| Manual Tools |
| Semi-Automatic (Trolley, Tractor-Mounted) |
| Fully-Autonomous Robots |
| Drone-Based Systems |
| Residential Rooftop (Up to 20 kW) |
| Commercial and Industrial (20 kW to 1 MW) |
| Utility-Scale (Above 1 MW) |
| Floating PV Arrays |
| In-House O&M Teams |
| Third-Party Cleaning Service Providers |
| Robot-as-a-Service (RaaS) Subscriptions |
| North America | United States |
| Canada | |
| Mexico | |
| Europe | Germany |
| United Kingdom | |
| France | |
| Italy | |
| NORDIC Countries | |
| Russia | |
| Rest of Europe | |
| Asia-Pacific | China |
| India | |
| Japan | |
| South Korea | |
| ASEAN Countries | |
| Rest of Asia-Pacific | |
| South America | Brazil |
| Argentina | |
| Rest of South America | |
| Middle East and Africa | Saudi Arabia |
| United Arab Emirates | |
| South Africa | |
| Egypt | |
| Rest of Middle East and Africa |
| By Cleaning Method | Wet (Water-Fed Brush, High-Pressure Jet) | |
| Dry (Rotary Brush, Air-Blast) | ||
| Electrostatic / Ionic | ||
| Coating-Based Self-Cleaning (Hydrophobic, Anti-Soiling) | ||
| By Technology Level | Manual Tools | |
| Semi-Automatic (Trolley, Tractor-Mounted) | ||
| Fully-Autonomous Robots | ||
| Drone-Based Systems | ||
| By Deployment | Residential Rooftop (Up to 20 kW) | |
| Commercial and Industrial (20 kW to 1 MW) | ||
| Utility-Scale (Above 1 MW) | ||
| Floating PV Arrays | ||
| By Service Model | In-House O&M Teams | |
| Third-Party Cleaning Service Providers | ||
| Robot-as-a-Service (RaaS) Subscriptions | ||
| By Geography | North America | United States |
| Canada | ||
| Mexico | ||
| Europe | Germany | |
| United Kingdom | ||
| France | ||
| Italy | ||
| NORDIC Countries | ||
| Russia | ||
| Rest of Europe | ||
| Asia-Pacific | China | |
| India | ||
| Japan | ||
| South Korea | ||
| ASEAN Countries | ||
| Rest of Asia-Pacific | ||
| South America | Brazil | |
| Argentina | ||
| Rest of South America | ||
| Middle East and Africa | Saudi Arabia | |
| United Arab Emirates | ||
| South Africa | ||
| Egypt | ||
| Rest of Middle East and Africa | ||


Key Questions Answered in the Report
What is the projected value of the solar panel cleaning market in 2031?
It is forecast to reach USD 2.34 billion by 2031 as the sector advances at an 8.75% CAGR
Which cleaning method is growing the fastest?
Dry-brush robotic systems are expanding at an 11.7% CAGR because they eliminate costly water logistics in arid regions.
Why are Robot-as-a-Service models gaining popularity?
RaaS shifts a USD 50,000-plus robot purchase into monthly fees of USD 1,500-3,000 per MW, improving cash flow for independent power producers.
How large is Asia-Pacific’s share of global revenue?
The region accounted for 45.1% of 2025 revenue and is set to grow at 10.0% annually through 2031.
What limits robot adoption on residential rooftops?
High capital costs extend payback beyond 10 years for systems under 50 kW, making manual tools more economical at present.
Page last updated on:


