Solar Cell Market Size and Share
Market Overview
| Study Period | 2021 - 2031 |
|---|---|
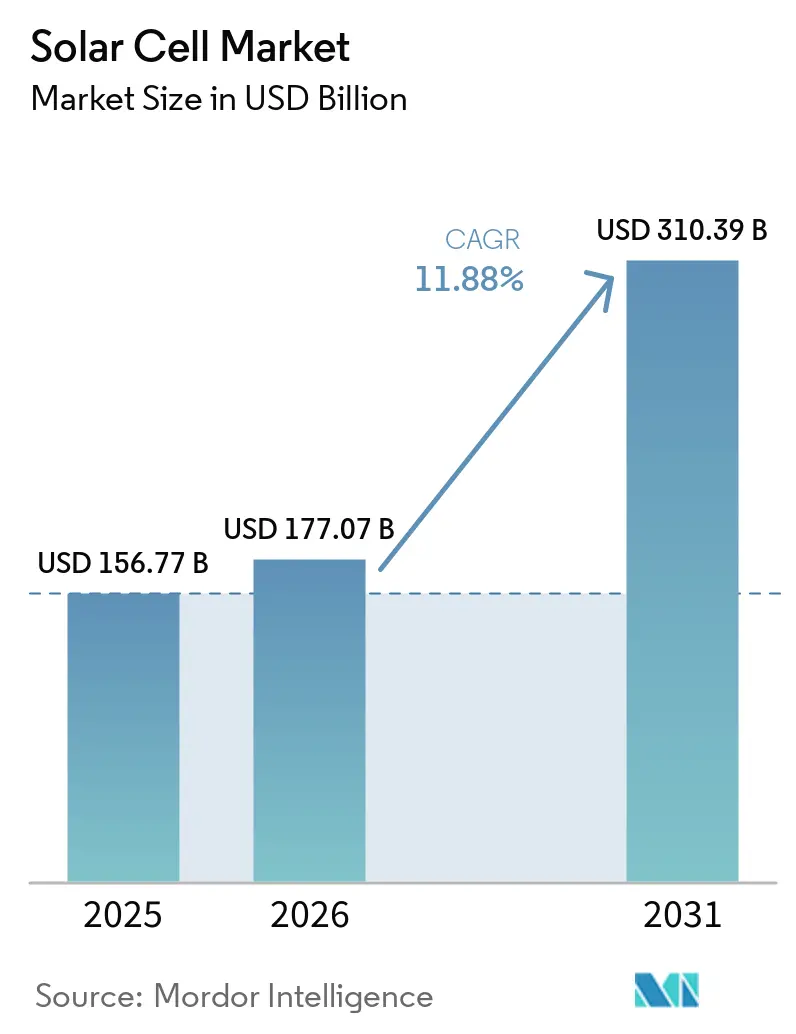
| Market Size (2026) | USD 177.07 Billion |
| Market Size (2031) | USD 310.39 Billion |
| Growth Rate (2026 - 2031) | 11.88% CAGR |
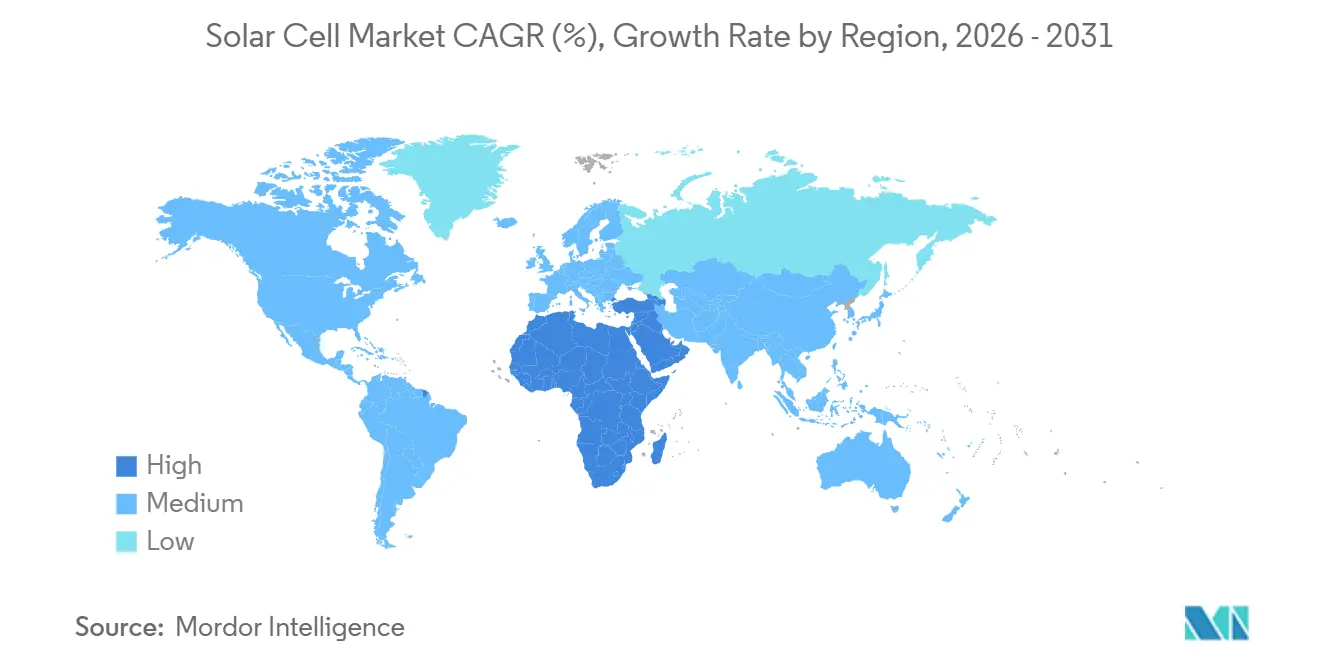
| Fastest Growing Market | Middle East and Africa |
| Largest Market | Asia Pacific |
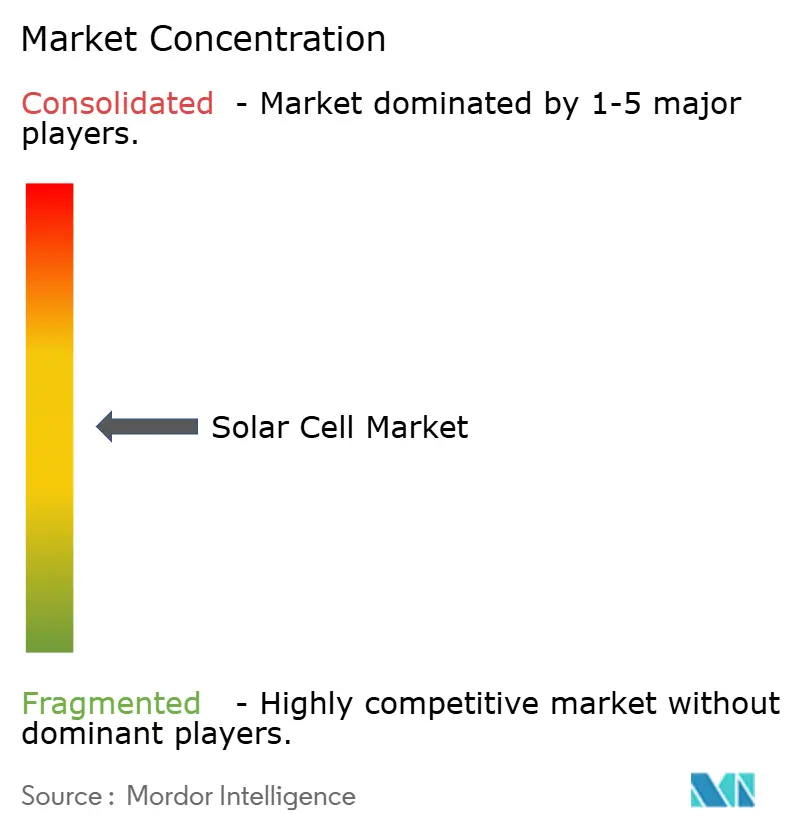
| Market Concentration | Medium |
Major Players *Disclaimer: Major Players sorted in no particular order Image © Mordor Intelligence. Reuse requires attribution under CC BY 4.0. | |
Solar Cell Market Analysis by Mordor Intelligence
The Solar Cell Market size is projected to be USD 156.77 billion in 2025, USD 177.07 billion in 2026, and reach USD 310.39 billion by 2031, growing at a CAGR of 11.88% from 2026 to 2031. Efficiency gains from n-type architectures, lower balance-of-system costs, and wider policy support are widening adoption across residential, commercial, and utility segments. Crystalline-silicon designs still anchor 84.6% of volume, yet the commercial ramp of heterojunction (HJT) and tunnel-oxide passivated-contact (TOPCon) lines is widening the performance gap versus legacy p-type PERC modules. Floating photovoltaic arrays and hybrid solar-plus-storage plants are scaling rapidly as developers look for land-use savings, interconnection relief, and grid-forming attributes. Meanwhile, geographic diversification is accelerating: Asia-Pacific remains dominant, but the Middle East and Africa now deliver the fastest regional growth as state utilities procure gigawatt-scale projects to decarbonize water-desalination and ammonia exports.
Key Report Takeaways
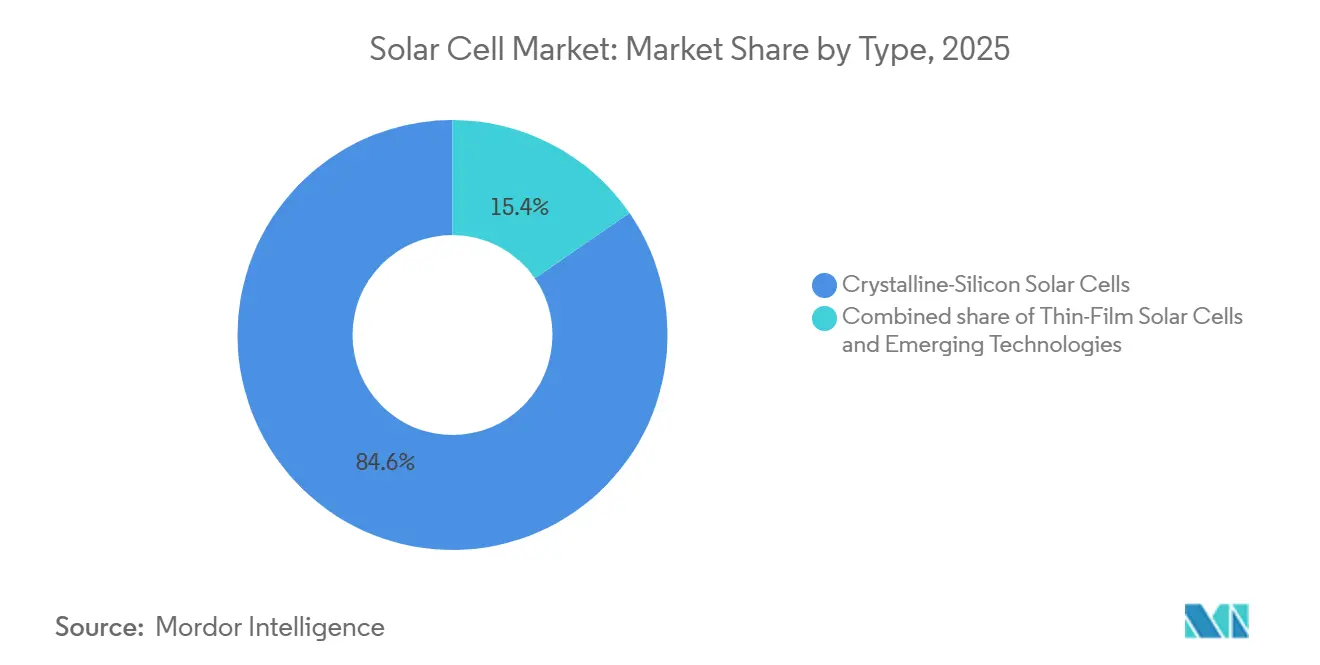
- By type, crystalline-silicon products controlled 84.6% of the solar cell market share in 2025, while perovskite-silicon tandems are expected to advance at a 14.1% CAGR through 2031.
- By cell technology, p-type PERC retained 69.0% of 2025 volume, yet HJT is expected to advance at 13.7% CAGR to 2031.
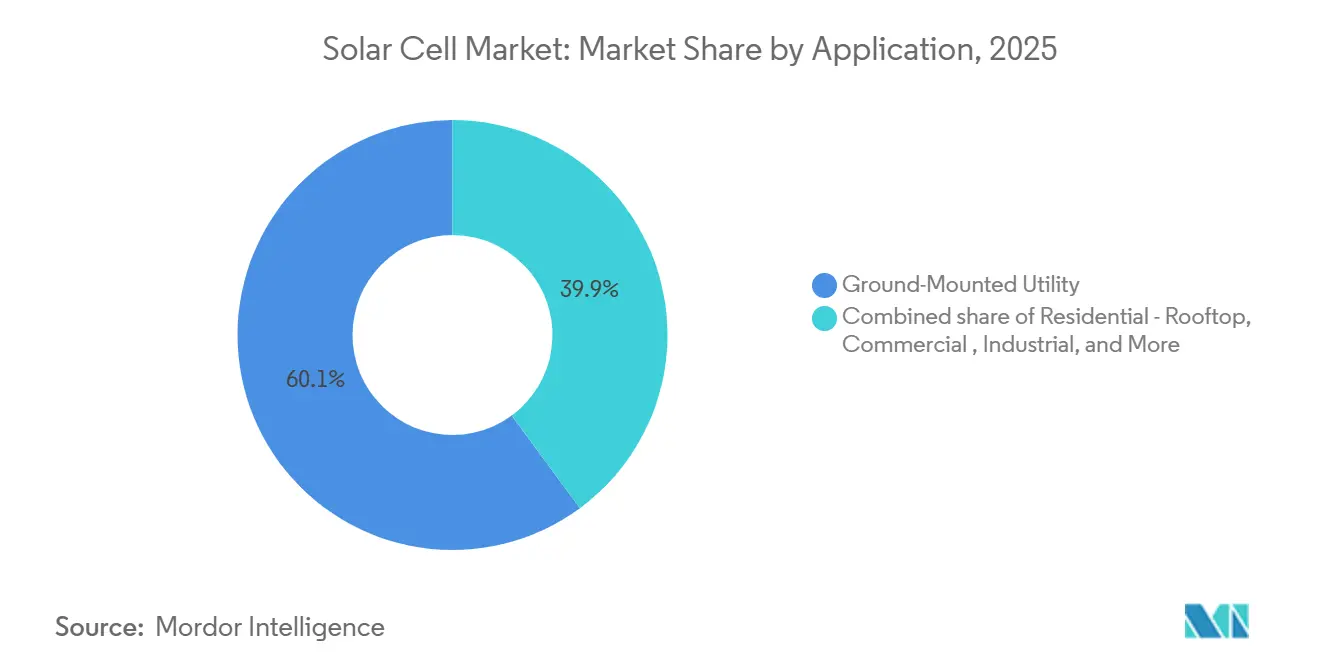
- By application, ground-mounted utility projects held 60.1% of demand in 2025, whereas floating PV is expanding at a 21.9% CAGR.
- By geography, Asia-Pacific accounted for 64.3% of 2025 revenue, but the Middle East and Africa led growth at 23.2% CAGR.
Note: Market size and forecast figures in this report are generated using Mordor Intelligence’s proprietary estimation framework, updated with the latest available data and insights as of January 2026.
Global Solar Cell Market Trends and Insights
Drivers Impact Analysis*
| Driver | (~) % Impact on CAGR Forecast | Geographic Relevance | Impact Timeline |
|---|---|---|---|
| Declining levelized cost of electricity | +2.8% | Global, strongest in China, India, Middle East | Medium term (2-4 years) |
| Global decarbonization targets and incentives | +3.1% | EU, North America, China, India | Long term (≥ 4 years) |
| Corporate clean-energy PPAs boom | +1.9% | North America, Europe, APAC tech hubs | Short term (≤ 2 years) |
| Commercialization of n-type TOPCon and HJT cells | +2.4% | Asia-Pacific manufacturing, spill-over to Europe & North America | Medium term (2-4 years) |
| Perovskite-silicon tandem pilot lines (2026+) | +1.2% | Europe, China, Japan | Long term (≥ 4 years) |
| Grid-forming-inverter mandates favoring high-efficiency cells | +1.5% | North America, EU member states | Short term (≤ 2 years) |
| Source: Mordor Intelligence | |||
Declining Levelized Cost of Electricity (LCOE)
Utility solar reached a global average LCOE of USD 0.043 kWh in 2024, with China at USD 0.033 kWh, undercutting new coal and gas in 90% of tracked markets.[1]International Renewable Energy Agency, “Renewable Power Generation Costs 2024,” irena.org Record-low tariffs of USD 0.026 kWh were achieved for 3.9 GW of Indian capacity in 2024 auctions, signaling a structural reset for thermal peaker plants. In Brazil, 2024 procurements cleared at USD 24 MWh, proving Latin American grids also view solar as the least-cost supply. U.S. projects still average USD 0.070 kWh, yet the gap is narrowing as module prices fall and tracker algorithms boost specific yield. Solar-plus-storage hybrids now capture ancillary-service income once reserved for combustion turbines, redefining capacity-market economics in ERCOT and CAISO.
Global Decarbonization Targets and Incentives
The U.S. Inflation Reduction Act’s Section 45X credits triggered 15 GW of new domestic capacity announcements, lifting First Solar’s roadmap to 25 GW by 2026.[2]First Solar, “Lawrence County Plant Commissioning 2026,” firstsolar.com Europe’s Carbon Border Adjustment Mechanism raises the landed cost of high-carbon imports by USD 0.02-0.04 W, redirecting procurement toward regional lines. China’s 14th Five-Year Plan locks in 1,200 GW of wind and solar by 2030, while India’s USD 2.4 billion PLI incentives push cell makers onto the government’s Approved List of Models and Manufacturers. Sovereign AI-datacenter mandates in the Gulf add premium demand for bifacial and low-degradation modules, illustrating the policy’s widening scope beyond power markets.
Corporate Clean-Energy PPAs Boom
Hyperscale cloud operators amassed 40 GW of cumulative solar PPAs by 2025, led by Amazon Web Services, Microsoft, and Google. Microsoft’s 10.5 GW contract with Brookfield Renewable locked in fixed energy pricing through 2035, lowering developers’ debt costs by up to 100 basis points. Oil majors such as TotalEnergies have started acting as renewable power marketers, broadening offtake options and sharpening power-trading competition. Financiers now underwrite 20-year creditworthy PPA cash flows rather than merchant curves, enabling uptake of higher-capex cell types such as HJT. The 24/7 carbon-free targets of tech firms are catalyzing co-located storage, which in turn rewards high-efficiency cells that maximize the energy-to-inverter ratio.
Commercialization of N-Type TOPCon & HJT Cells
Tongwei scaled TOPCon to 130 GW of capacity by 2025, while JA Solar reached 90 GW, shifting industry focus from p-type architectures to n-type designs offering 24.5-25.0% module efficiencies.[3]PV Tech, “Global Module Price Trends 2025,” pv-tech.orgHuasun’s 10 GW HJT line and Meyer Burger’s 3.5 GW European facility demonstrate economic viability despite a 15-20% capex premium. Gross margins diverge: PERC producers scrape below 5% at USD 0.10 W module prices, whereas TOPCon and HJT suppliers sustain 8-12% via performance premiums. Silver consumption rises 30% per watt in HJT, increasing exposure to metal price volatility, yet patent filings show rapid moves toward copper plating to mitigate this risk.
Restraints Impact Analysis*
| Restraint | (~) % Impact on CAGR Forecast | Geographic Relevance | Impact Timeline |
|---|---|---|---|
| Oversupply-driven module price crash | –2.1% | Global, most acute in China | Short term (≤ 2 years) |
| Grid-connection bottlenecks | –1.7% | North America, India, parts of Europe | Medium term (2-4 years) |
| Looming silver and indium supply constraints | –0.9% | Global, Asia-Pacific manufacturing exposed | Long term (≥ 4 years) |
| Trade-barrier uncertainty | –1.2% | North America, Europe, Southeast Asia | Short term (≤ 2 years) |
| Source: Mordor Intelligence | |||
Oversupply-Driven Module Price Crash
China’s polysilicon output rose to 2.77 million tonnes in 2025, versus global demand of 1.8 million tonnes, causing spot silicon prices 60% to USD 12 kg.[4]Bernreuter Research, “Polysilicon Market Review 2024,” bernreuter.com Module prices followed, touching USD 0.10-0.12 W and pushing eight gigawatts of tier-2 capacity offline. Vertically integrated giants preserve 8-10% EBITDA by internalizing value capture, whereas pure-play assemblers see cash-flow stress and potential forced consolidation. The downturn is paradoxically accelerating technology upgrades, as firms invest in TOPCon and HJT to escape commoditization even while margins remain thin.
Grid-Connection Bottlenecks
The United States interconnection queue hit 2,600 GW in 2024, with solar representing 53% and facing a five-year average wait. CAISO shows only 15% of 2015-2020 applications reached operation, highlighting transmission upgrade delays. India faced a similar curtailment when 25 GW in Rajasthan and Gujarat lacked evacuation capacity. Developers are pivoting to behind-the-meter installations and solar-plus-storage hybrids that reuse existing interconnection rights. These workarounds lift C&I demand at an 18% CAGR, yet they shift cost responsibility from utilities to project sponsors.
*Our forecasts treat driver/restraint impacts as directional, not additive. The impact forecasts reflect baseline growth, mix effects, and variable interactions.
Segment Analysis
By Type: Crystalline Dominates as Tandems Gain a Margin Premium
Crystalline-silicon designs controlled 84.6% of the solar cell market in 2025, with monocrystalline variants delivering 24-25% efficiencies and falling wafer costs. Niche avenues such as CIGS and amorphous silicon now target BIPV or lightweight electronics where flexibility overshadows efficiency sacrifice.
Emerging solar technologies include perovskite, organic photovoltaic (OPV), quantum-dot, and dye-sensitized solar cells (DSSC). Crystalline silicon will dominate utility-scale and rooftop installations through 2031, while perovskite tandems target premium segments like space-constrained commercial and BIPV applications. IEC 61215 certification for perovskite modules is expected by 2027, enabling project financing. OPVs remain limited to ultra-low-power uses, quantum-dot cells are in development, and DSSCs face competition from higher-performing perovskites. IEC 61215 certification drafts for perovskite modules are in process, and approval could unlock larger project-finance pools post-2027. In the interim, rooftop and architectural-glass applications allow early movers to recoup higher price points despite field-reliability unknowns.


By Cell Technology: N-Type Platforms Erode PERC’s Lead
P-type PERC captured 69.0% of shipments in 2025, but HJT is climbing at 13.7% CAGR as Huasun, Meyer Burger, and REC bring more capacity online. N-type TOPCon is also scaling faster because most PERC lines can be retrofitted, lowering capex to USD 0.08-0.10 W. IBC and other back-contact designs remain stylistic niches for premium rooftops.
HJT and tandem manufacturers achieve USD 0.15-0.20 per watt margins, compared to USD 0.10-0.12 for PERC, offsetting higher capex and sustaining 10-12% gross margins in oversupplied markets. Meyer Burger, Panasonic, and REC Group hold over 1,200 HJT patents, creating licensing barriers and enabling royalty collection. SEMI's PV Group is drafting tandem-cell degradation test protocols, crucial for 25-year warranties and unlocking project financing beyond early adopters. Meanwhile, tandem and III-V multi-junction cells could reach multi-gigawatt status once Oxford PV and Longi scale their pilot lines. Across this landscape, the combined patent estates of Meyer Burger, Panasonic, and REC pose licensing barriers, impacting the solar cell market share dynamics for late-entry Chinese manufacturers.
By Application: Floating PV Rewrites Land-Use Economics
Ground-mounted utility plants absorbed 60.1% of 2025 demand, with mega-parks in China, India, and Saudi Arabia realizing USD 0.60-0.80 W installed costs. Floating PV is growing at a 21.9% CAGR, tapping 400 GW of reservoir and near-shore potential and offering 10-15% higher yields through evaporative cooling.
Aerospace and defense applications, such as satellite solar arrays and UAV wings, command USD 200–500 per watt for radiation-hardened III-V multi-junction cells, sustaining over 40% margins for suppliers like Spectrolab. Agrivoltaic systems, combining crop cultivation with solar panels, are scaling in France and Japan, reducing water use by 20–30% and diversifying farm revenue, rewarding manufacturers with broad product portfolios.
Commercial and industrial buyers are adopting on-site systems to dodge interconnection delays, pushing double-digit growth. Agricultural co-location, aerospace, and EV range-extension modules remain fractional today but illustrate the breadth of use-cases that divide the solar cell market into cost-led utility demand and premium-priced specialty niches.
Geography Analysis
Asia-Pacific retained 64.3% revenue share in 2025 as China ramped polysilicon and module lines exceeding 400 GW of combined capacity. India's USD 2.4 billion PLI subsidies and ALMM rules rerouted 12 GW of annual orders to domestic suppliers, while Japan and South Korea leveraged technology leadership to serve ASEAN imports. Vietnam and Malaysia expanded output to 5 GW each, using trade-neutral positioning to reach U.S. and EU buyers. The solar cell market size across Asia-Pacific is projected to reach USD 210 billion by 2031.
The Middle East and Africa post the fastest growth at 23.2% CAGR, anchored by Saudi Arabia's 2.6 GW NEOM allocation and the UAE's march to 5 GW at its Mohammed bin Rashid park by 2030. Egypt's Benban complex and South Africa's REIPPPP illustrate how multilateral finance de-risks sovereign credit, unlocking scale projects that reshape regional load curves. Grid-integrated desalination and green hydrogen drive additional off-take, supporting a widening solar cell market in water-stressed states.
The U.S. IRA's 45X credit supports a domestic CdTe cluster exceeding 11 GW, while the EU's Net-Zero Industry Act funds 30 GW of reshored capacity. Canadian provinces align with federal tax credits to phase out coal, and Brazil's auctions clear at world-class low tariffs, signaling new poles of utility-scale buildout. The U.S. Inflation Reduction Act's 45X credit drives First Solar's 25 GW capacity target by 2026, with 6 GW added in Ohio and Alabama. The EU's 2024 Net-Zero Industry Act allocates EUR 3 billion to reshore 30 GW by 2030, aiding Meyer Burger and Enel. Canada's 5 GW solar pipeline replaces coal, while Brazil and Argentina expand solar capacity, exporting electricity to Chile via cross-border interconnections.

Competitive Landscape
In 2025, the top five producers-Longi, Tongwei, JA Solar, Trina Solar, and JinkoSolar- will be exhibiting moderate concentration. Chinese majors extend their lead through vertical integration, capturing polysilicon-through-module margins to offset price compression. First Solar’s CdTe line stands out as the only large-scale non-silicon alternative viable under U.S. domestic-content incentives, locking a contracted backlog beyond 2027. New challengers such as Oxford PV, Huasun, and Aiko target niche efficiency or back-contact advantages, selling into land-constrained or premium rooftop segments.
Patent leverage is rising: Meyer Burger and Panasonic hold more than 1,200 HJT patents, adding a structural barrier for low-cost entrants that lack in-house R&D. Copper-plated metallization, tandem stacks, and roll-to-roll perovskite printing are the current R&D battlegrounds. Market position is increasingly defined not solely by gigawatt scale but by the ability to pair differentiated cell designs with grid-forming inverters and digital service layers that unlock recurring revenues. Firms unable to integrate either innovation or vertical depth face margin erosion and potential consolidation.
Solar Cell Industry Leaders
LONGi Green Energy Technology
Tongwei Solar
JinkoSolar
Trina Solar
JA Solar
- *Disclaimer: Major Players sorted in no particular order

Recent Industry Developments
- March 2026: First Solar completed a 3.5 GW CdTe plant in Alabama, bringing its U.S. total to 11 GW with a contracted backlog to 2028.
- March 2026: Tongwei and Longi formed a 5 GW perovskite-TOPCon joint venture targeting 28% efficiency by 2027.
- February 2026: JA Solar opened a 15 GW TOPCon complex in Yunnan featuring 24.8% average cell efficiency and on-site solar power.
- November 2024: Huasun partnered with TotalEnergies to deploy 1 GW of HJT modules across European rooftops.


Global Solar Cell Market Report Scope
A solar cell, or photovoltaic (PV) cell, is an electronic device that directly converts sunlight into electricity using the photovoltaic effect.
The Solar Cell Market is segmented into type, cell technology, application, and geography. By type, the market is segmented into crystalline-silicon, thin-film, and emerging technologies. By cell technology, the market is segmented into p-type PERC, n-type TOPCon, HJT, IBC, BC, and tandem technologies. By application, the market is segmented into residential, commercial, industrial, utility, floating PV, consumer electronics, automotive, aerospace, and other applications. The report also covers the market size and forecasts for the solar cell market across major regions, including North America, Europe, Asia-Pacific, South America, and the Middle East and Africa. For each segment, the market sizing and forecasts have been done on the basis of value (USD).
| Crystalline-Silicon Solar Cells | Monocrystalline Silicon |
| Polycrystalline Silicon | |
| Thin-Film Solar Cells | Cadmium Telluride (CdTe) |
| Amorphous Silicon (a-Si) | |
| Copper Indium Gallium Selenide (CIGS) | |
| Emerging Technologies | Perovskite Solar Cells |
| Organic Photovoltaic (OPV) Cells | |
| Quantum-Dot Solar Cells | |
| Dye-Sensitised Solar Cells (DSSC) |
| P-type PERC |
| n-type TOPCon |
| Heterojunction (HJT) |
| Interdigitated Back-Contact (IBC) |
| Back-Contact (BC) |
| Tandem (Perovskite-Si, III-V) |
| Residential - Rooftop |
| Commercial |
| Industrial |
| Ground-Mounted Utility |
| Floating PV |
| Consumer Electronics |
| Automotive and Transportation |
| Aerospace and Defense |
| Others (Agrivoltaic, Wearables, Off-grid, etc.) |
| North America | United States |
| Canada | |
| Mexico | |
| Europe | Germany |
| United Kingdom | |
| France | |
| Italy | |
| NORDIC Countries | |
| Russia | |
| Rest of Europe | |
| Asia-Pacific | China |
| India | |
| Japan | |
| South Korea | |
| ASEAN Countries | |
| Rest of Asia-Pacific | |
| South America | Brazil |
| Argentina | |
| Rest of South America | |
| Middle East and Africa | Saudi Arabia |
| United Arab Emirates | |
| South Africa | |
| Egypt | |
| Rest of Middle East and Africa |
| By Type | Crystalline-Silicon Solar Cells | Monocrystalline Silicon |
| Polycrystalline Silicon | ||
| Thin-Film Solar Cells | Cadmium Telluride (CdTe) | |
| Amorphous Silicon (a-Si) | ||
| Copper Indium Gallium Selenide (CIGS) | ||
| Emerging Technologies | Perovskite Solar Cells | |
| Organic Photovoltaic (OPV) Cells | ||
| Quantum-Dot Solar Cells | ||
| Dye-Sensitised Solar Cells (DSSC) | ||
| By Cell Technology | P-type PERC | |
| n-type TOPCon | ||
| Heterojunction (HJT) | ||
| Interdigitated Back-Contact (IBC) | ||
| Back-Contact (BC) | ||
| Tandem (Perovskite-Si, III-V) | ||
| By Application | Residential - Rooftop | |
| Commercial | ||
| Industrial | ||
| Ground-Mounted Utility | ||
| Floating PV | ||
| Consumer Electronics | ||
| Automotive and Transportation | ||
| Aerospace and Defense | ||
| Others (Agrivoltaic, Wearables, Off-grid, etc.) | ||
| By Geography | North America | United States |
| Canada | ||
| Mexico | ||
| Europe | Germany | |
| United Kingdom | ||
| France | ||
| Italy | ||
| NORDIC Countries | ||
| Russia | ||
| Rest of Europe | ||
| Asia-Pacific | China | |
| India | ||
| Japan | ||
| South Korea | ||
| ASEAN Countries | ||
| Rest of Asia-Pacific | ||
| South America | Brazil | |
| Argentina | ||
| Rest of South America | ||
| Middle East and Africa | Saudi Arabia | |
| United Arab Emirates | ||
| South Africa | ||
| Egypt | ||
| Rest of Middle East and Africa | ||


Key Questions Answered in the Report
How large is the solar cell market in 2026?
The solar cell market size is projected to reach USD 177.07 billion in 2026, continuing toward USD 310.39 billion by 2031.
Which cell technology is growing fastest to 2031?
Heterojunction (HJT) capacity is advancing at a 13.7% CAGR, the quickest among mainstream options.
Why are grid-forming inverters influencing procurement?
New North American and EU grid codes require synthetic inertia and voltage support, prompting developers to favor high-efficiency cells that minimize inverter count.
What region will add capacity most rapidly?
The Middle East and Africa lead with a forecast 23.2% CAGR as Saudi Arabia and the UAE commission multi-gigawatt parks.
How are oversupply pressures affecting pricing?
Excess Chinese polysilicon has pushed module prices to USD 0.10-0.12 W, squeezing tier-2 margins and accelerating technology upgrades toward TOPCon and HJT lines.
Do perovskite-silicon tandems have bankable lifetimes yet?
Field data collection is under way for 2026-2028 deployments; IEC 61215 certification drafts are expected in 2027 to underpin 25-year warranties.
Page last updated on:


