Solar Simulator Market Size and Share
Market Overview
| Study Period | 2020 - 2030 |
|---|---|
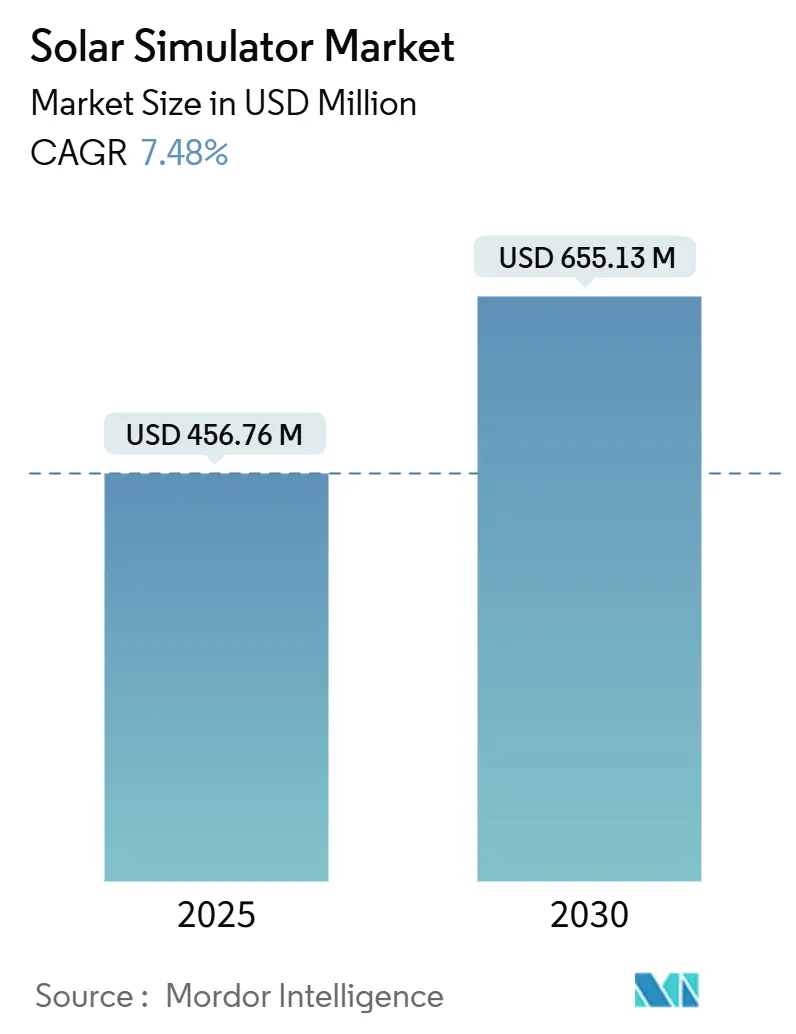
| Market Size (2025) | USD 456.76 Million |
| Market Size (2030) | USD 655.13 Million |
| Growth Rate (2025 - 2030) | 7.48% CAGR |
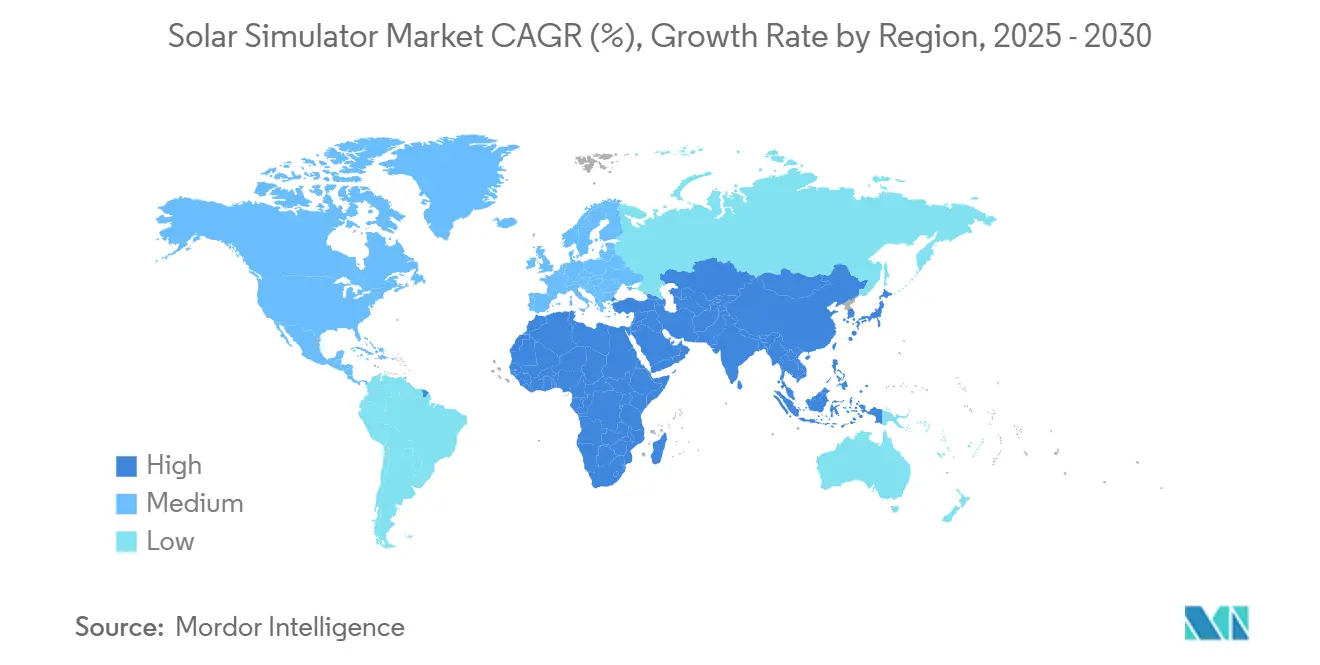
| Fastest Growing Market | Europe |
| Largest Market | Asia Pacific |
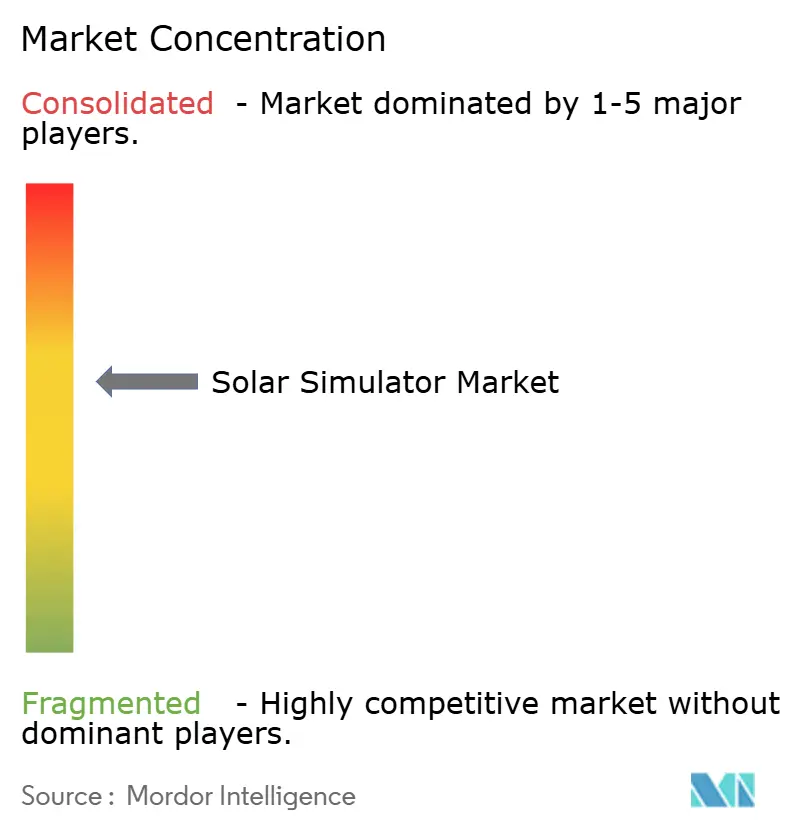
| Market Concentration | Medium |
Major Players *Disclaimer: Major Players sorted in no particular order Image © Mordor Intelligence. Reuse requires attribution under CC BY 4.0. | |
Solar Simulator Market Analysis by Mordor Intelligence
The Solar Simulator Market size is estimated at USD 456.76 million in 2025, and is expected to reach USD 655.13 million by 2030, at a CAGR of 7.48% during the forecast period (2025-2030).
Robust demand stems from stricter global testing standards, rapid photovoltaic (PV) capacity additions, and the wider adoption of applications in aerospace, cosmetics, and advanced materials. Mandatory compliance with IEC 60904-9:2024 standards is triggering large-scale equipment replacement cycles, while the accelerating transition from xenon arc to LED-based light sources lowers operating costs and attracts budget-sensitive buyers. Cube-sat deployment, defense hypersonic programs, and gigawatt-scale “mega-fab” PV lines collectively reinforce procurement of high-throughput Class AAA systems. However, supply chain fragility around noble-gas inputs for xenon lamps and thermal-management limits in high-flux LEDs pose operational risks that temper near-term growth momentum.
Key Report Takeaways
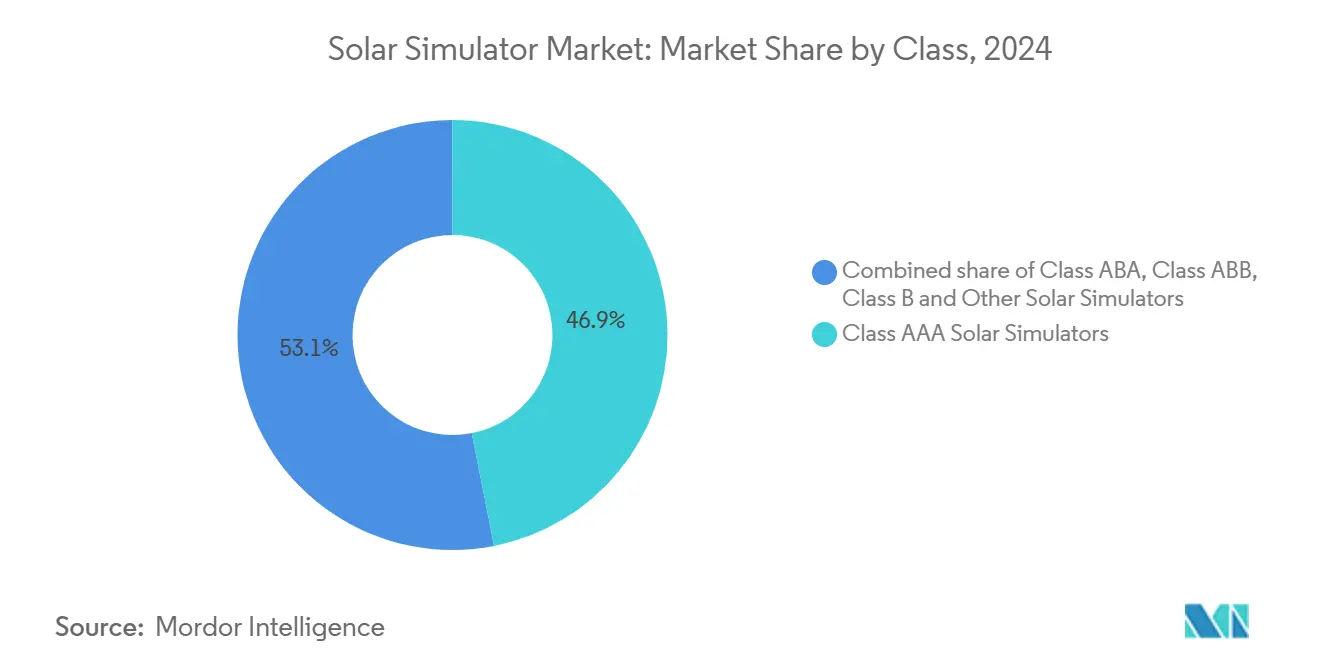
- By class, Class AAA systems held 46.9% of the solar simulator market share in 2024. Class ABB solutions are forecast to climb at a 12.8% CAGR through 2030, the fastest among all performance grades.
- By light-source technology, xenon arc units accounted for 31.4% of the revenue in 2024, whereas LED-based platforms are expected to advance at a 9.5% CAGR through 2030.
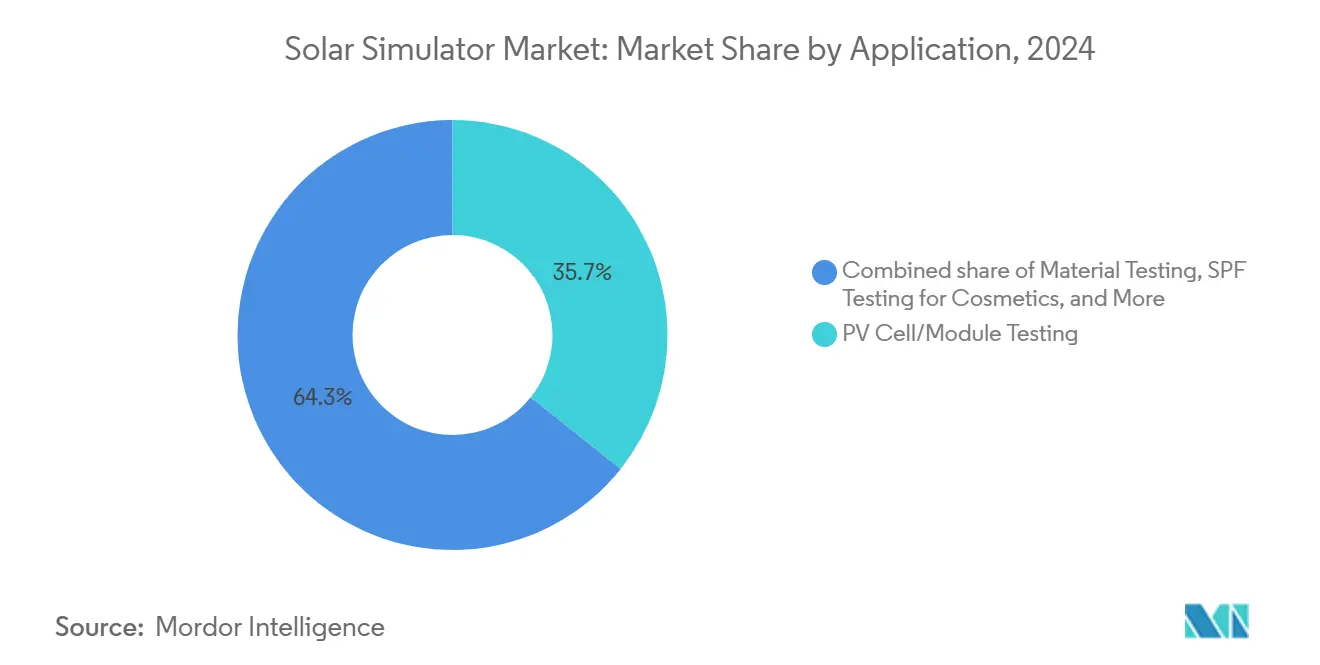
- By application, PV cell and module testing accounted for a 35.7% share of the solar simulator market size in 2024 and is set to grow at an 8.4% CAGR to 2030.
- By end-user, aolar-panel manufacturers captured 30.8% of the solar simulator market size in 2024, while academic and research institutions are projected to grow at a 10.3% CAGR.
- By geography, the Asia-Pacific region led with a 41.5% revenue contribution in 2024; Europe is poised for the quickest regional expansion, at an 11.7% CAGR through 2030.
Global Solar Simulator Market Trends and Insights
Drivers Impact Analysis*
| Driver | (~) % Impact on CAGR Forecast | Geographic Relevance | Impact Timeline |
|---|---|---|---|
| Climate-aligned subsidy waves in U.S., EU & India (2025-28) | +1.5% | North America, Europe, APAC core | Medium term (2-4 years) |
| Sharp fall in LED cost per lux (≤ US$0.02 by 2027) | +1.2% | Global | Medium term (2-4 years) |
| PV-module throughput race (>10 GW "Giga-fab" lines) | +2.1% | APAC core, spill-over to North America | Short term (≤ 2 years) |
| Mandatory IEC 60904-9:2024 adoption deadlines | +1.8% | Global | Short term (≤ 2 years) |
| Defense demand for hypersonic-material testing | +0.9% | North America & EU | Long term (≥ 4 years) |
| Cube-sat solar array surge in LEO constellations | +0.7% | Global, concentrated in North America | Medium term (2-4 years) |
| Source: Mordor Intelligence | |||
Climate-Aligned Subsidy Waves in U.S., EU & India (2025-28)
Industrial policies, such as the U.S. Inflation Reduction Act, have unlocked more than USD 100 billion in announced solar-manufacturing investments and over 50 new facilities since 2022, spurring the procurement of advanced quality-assurance tools that underpin local content requirements.[1]U.S. Department of Energy, “Inflation Reduction Act—Clean Energy Manufacturing Announcements,” energy.gov Similar subsidy frameworks in the European Union reward high-efficiency module output, compelling producers to adopt Class AAA solar simulators that satisfy precision criteria. India’s production-linked incentives add another layer of localized demand, though budget constraints are steering some manufacturers toward Class ABB platforms. Collectively, these subsidies expand regional testing capacity more rapidly than end-market demand, increasing the risk of localized overcapacity by 2028 while still driving sustained orders for the solar simulator market.
Sharp Fall in LED Cost per Lux (≤ USD 0.02 by 2027)
Continuous gains in high-brightness LED efficiency—already touching 45-60 lm/W for phosphor-converted green diodes—push system cost per lux below xenon benchmarks.[2]Science.gov, “High-Brightness LED Efficiency Milestones,” science.gov Lower component pricing, longer source lifetimes, and simplified cooling architectures encourage labs to switch from gas-discharge to solid-state light engines. That migration hands a competitive advantage to vendors with deep expertise in LED optics and control electronics, marginalizing suppliers tied to xenon lamp portfolios. The conversion simultaneously reduces ultraviolet safety hazards and curbs routine lamp-change downtime, improving the total cost of ownership for end users.
PV-Module Throughput Race (>10 GW “Giga-Fab” Lines)
Manufacturers building giga-scale production—exemplified by Qcells’ USD 2.8 billion vertically integrated U.S. campus—need dense banks of solar simulators to avoid bottlenecks as line throughput exceeds 10 GW per site. High-speed electroluminescence and I-V flash testers must synchronize with conveyor speeds exceeding 7,000 modules per hour, making Class AAA systems, capable of millisecond flash durations and automated loading, indispensable. As First Solar scales its global capacity toward 25 GW by 2026, similar investments in precision flashers will underpin reliability guarantees and product warranties, reinforcing demand for premium tools.
Mandatory IEC 60904-9:2024 Adoption Deadlines
The latest IEC standard tightens tolerances for spectral match, spatial uniformity, and temporal instability, forcing labs worldwide to upgrade legacy equipment before regional enforcement dates take effect. Procurement surges concentrate around compliance cut-off periods, straining manufacturer lead times and elevating backlog visibility. Because the directive governs certification across all module types, utility-scale and consumer PV suppliers alike must align with the higher bar, creating non-discretionary spend that shields the solar simulator market from broader capital-equipment cycles.
Restraints Impact Analysis*
| Restraint | (~) % Impact on CAGR Forecast | Geographic Relevance | Impact Timeline |
|---|---|---|---|
| High-flux LED thermal-management failures | -0.8% | Global | Short term (≤ 2 years) |
| Limited xenon-bulb supply after 2026 neon crunch | -1.1% | Global, concentrated in APAC | Medium term (2-4 years) |
| IP bottlenecks on UV-C spectrum calibration chips | -0.6% | Global | Long term (≥ 4 years) |
| Insurance premium hikes for Class AAA certification labs | -0.4% | North America & EU | Medium term (2-4 years) |
| Source: Mordor Intelligence | |||
IP Bottlenecks on UV-C Spectrum Calibration Chips
Just a handful of patent holders control photodiode-array architectures capable of accurate UV-C (200-280 nm) spectral monitoring, impeding smaller firms from matching the calibration accuracy offered by incumbents. Licensing fees inflate unit costs, while cross-licensing negotiations can span years, delaying new product launches and constraining innovation cycles.[3]United States Patent and Trademark Office, “UV-C Photodiode Array Patents,” uspto.gov
Insurance Premium Hikes for Class AAA Certification Labs
Underwriters have recalibrated risk models following several high-profile warranty disputes linked to module performance claims, resulting in double-digit premium increases at precision testing facilities across North America and Europe. Higher overhead squeezes small laboratories, prompting some to exit the high-accuracy tier and creating a supply gap that may lengthen certification queues.
*Our forecasts treat driver/restraint impacts as directional, not additive. The impact forecasts reflect baseline growth, mix effects, and variable interactions.
Segment Analysis
By Class: Mid-Tier Optimization Challenges Class AAA Dominance
Class AAA systems accounted for 46.9% of the solar simulator market in 2024, benefiting from the tight specifications mandated in IEC 60904-9:2024. That dominance, though, faces pushback as Class ABB instruments grow at 12.8% CAGR, allowing manufacturers to align test accuracy with narrower margin products. The solar simulator market size for Class ABB offerings is growing as emerging-market producers balance capital expenditures against throughput demands. Meanwhile, Class AAA remains indispensable for multi-junction cells approaching 50% efficiency, where spectral fidelity across six discrete bands defines performance thresholds. Over the forecast horizon, the solar simulator market share of Class AAA systems will erode slightly yet remain the benchmark for R&D and tier-one production lines.
Second-tier categories such as Class ABA and Class B serve laboratories where budget or speed outweigh pinnacle precision. Growth in these grades hinges on vocational institutes and entry-level manufacturing, markets less exposed to aggressive international quality certifications. Nonetheless, heightened awareness of bankability requirements for utility-scale projects gradually migrates even low-tier buyers toward higher-classification solutions, tightening the gap between premium and mid-range segments.


By Light-Source Technology: LED Disruption Gains Pace
Xenon arc platforms captured 31.4% revenue in 2024, bolstered by their proven solar-match spectrum and millisecond flash capability. Yet solid-state challengers clock a 9.5% CAGR through 2030 as falling diode costs and rising electricity prices tilt lifecycle economics toward LEDs. Safety regulations limiting UV exposure in manufacturing lines also favor LED, which eliminates ozone generation and minimizes shielding expenses. For high-irradiance research—such as perovskite stability tests—hybrid systems combining LEDs for visible bands with metal-halide or xenon sources for UV still find niche adoption. The solar simulator market size tied to xenon will contract in relative terms, though absolute revenue remains resilient in military and aviation test centers that prize legacy qualification data continuity.
By Application: PV Testing Retains Command but Diversification Intensifies
PV cell and module evaluation accounted for 35.7% of demand in 2024, underpinned by a record 585 GW of global PV additions that same year. The solar simulator market size allocated to materials research, automotive component validation, SPF certification, and aerospace simulation has climbed as these verticals borrow solar-irradiance protocols for thermal loading studies. Material scientists investigating surface modifications for concentrator optics use controlled spectra to quantify photothermal effects, while automotive OEMs characterize cabin material fade under accelerated exposure to sunlight. This spread insulates the solar simulator market from PV capital expenditure cycles, providing suppliers with revenue durability.
By End-User: Academia Emerges as a Structural Growth Engine
Solar panel manufacturers accounted for 30.8% of revenue in 2024, but university and research labs are projected to post a 10.3% CAGR outlook, driven by public-sector grants for tandem-cell and perovskite longevity workstreams. Defense agencies represent a lucrative but small customer class, ordering bespoke simulators with irradiance variability finer than ±0.3%. Certification bodies handling SPF labeling and façade glass verification likewise purchase mid-range Class ABB equipment. As research pipelines diversify beyond crystalline silicon, the solar simulator market benefits from wider customer dispersion and reduced reliance on cyclical PV module expansions.
Geography Analysis
The Asia-Pacific region retained 41.5% of spending in 2024, driven by China's vertically integrated PV manufacturing and India's rollout of testing labs. Government localization targets translate directly into simulator shipments as fabs pursue ISO and IEC accreditation to meet the requirements of export financiers.[4]Ministry of New and Renewable Energy, “National Solar Mission Updates,” mnre.gov.in Europe's 11.7% CAGR is driven by strict product carbon footprint rules and premium module positioning, which require tighter flash test tolerances. North America's steady growth is bolstered by tailwinds from the Inflation Reduction Act's incentives, which revive domestic PV assembly, as well as Pentagon-funded programs for hypersonic and small satellites.
Asia-Pacific's leadership is rooted in dense manufacturing clusters across the Yangtze River Delta, the Pearl River Delta, and India's Gujarat corridor, where lines exceeding 10 GW drive economies of scale. Regional policies, such as China's "Top Runner" program, continue to drive cell efficiencies, sustaining demand for Class AAA verification. Secondary hubs in Vietnam and Malaysia are adopting similar quality regimes, setting the stage for contiguous market expansion. Local simulator vendors face rising competition from multinational entrants offering integrated metrology suites that bundle electroluminescence and dark-I-V diagnostics with flash test capability.
Europe's high-growth trajectory is fueled by the EU's carbon border adjustment mechanism, which rewards modules that demonstrate superior power-to-emission ratios. German institutes, such as Fraunhofer ISE, pioneer next-generation perovskite-silicon tandem cells, necessitating simulators with programmable spectra that extend into the near-infrared. Simultaneously, rooftop-centric markets in the Netherlands and Italy create strong opportunities for after-sales services, including service contracts and periodic recalibrations. Regional end-users are increasingly adopting LED platforms due to the lower total harmonic distortion on factory electrical networks.
North America benefits from more than USD 100 billion in new or expanded PV manufacturing facilities announced since 2022, requiring entire greenfield metrology suites. The U.S. space sector—Nencompassing ASA, SpaceX, and emerging small-sat integrators—acreatesspecialized demand for vacuum-compatible flash chambers and custom spectrum modules tailored to high-altitude solar conditions. Canadian universities focusing on cold-climate PV research procure temperature-controlled simulators that replicate -20 °C operating environments.

Competitive Landscape
The solar simulator market remains moderately fragmented. Multinationals such as Newport (MKS Instruments), Sciencetech, and Gsolar have entrenched footprints in Class AAA and xenon equipment, while nimble newcomers leverage LED innovation to gain market share in mid-tier segments. Competitive intensity is intensifying around proprietary optics that deliver IEC Class AAA performance at flash durations under 1 ms, a critical requirement for high-volume inline testing. Companies with holistic product stacks—encompassing flash testing, electroluminescence, and laser scribing—enjoy cross-selling leverage, prompting a wave of tuck-in acquisitions aimed at filling technology gaps.
Pricing pressures mount in LED categories as diode costs drop, compressing margins for undifferentiated offerings. Conversely, defense and aerospace tenders remain insulated, allowing suppliers to command multi-million-dollar contracts for bespoke high-flux systems. Intellectual property estates surrounding UV-C calibration and LED thermal control algorithms serve as durable competitive moats, but they also attract antitrust scrutiny that could reshape licensing dynamics.
Solar Simulator Industry Leaders
Newport Corp. (MKS Instruments)
Sciencetech Inc.
Gsolar Power Co., Ltd.
Abet Technologies, Inc.
Spectrolab Inc.
- *Disclaimer: Major Players sorted in no particular order

Recent Industry Developments
- June 2025: Swiss LED-based solar simulation and metrology firm Avalon ST has acquired PASAN, a company specializing in xenon-based solar simulators, for an undisclosed amount.
- May 2025: MKS Inc., a global leader in transformative enabling technologies, unveiled its Newport Solaris series Class A+AA Solar Simulators. Featuring a full-spectrum, single-emitter design, the Solaris series utilizes a xenon arc lamp, providing a highly reliable broadband light source that closely mimics natural sunlight.
- April 2025: Rocket Lab expanded its satellite solutions line with customizable solar arrays, opening incremental orders for small-satellite qualification simulators.
- October 2024: MBJ Solutions, a specialist in PV industry equipment based in Germany, unveiled two new products: the MBJ Steady State Sun Simulator and the MBJ Light Soaking Unit.


Global Solar Simulator Market Report Scope
| Class AAA Solar Simulators |
| Class ABA Solar Simulators |
| Class ABB Solar Simulators |
| Class B & Others |
| Xenon Arc Lamp |
| Metal-Halide Lamp |
| LED arrays |
| Quartz-Tungsten-Halogen (QTH) |
| Hybrid/Others |
| UV (100 to 400 nm) |
| Visible (400 to 780 nm) |
| IR (780 to 2500 nm) |
| PV Cell/Module Testing |
| Material Testing |
| SPF Testing for Cosmetics |
| Automotive and Aerospace Testing |
| Others |
| Solar-Panel Manufacturers |
| Certification Bodies (Cosmetics, Buildings) |
| Academic and Research Institutes |
| Automotive |
| Aerospace and Defense |
| Others |
| North America | United States |
| Canada | |
| Mexico | |
| Europe | Germany |
| United Kingdom | |
| France | |
| Italy | |
| NORDIC Countries | |
| Russia | |
| Rest of Europe | |
| Asia-Pacific | China |
| India | |
| Japan | |
| South Korea | |
| ASEAN Countries | |
| Rest of Asia-Pacific | |
| South America | Brazil |
| Argentina | |
| Rest of South America | |
| Middle East and Africa | Saudi Arabia |
| United Arab Emirates | |
| South Africa | |
| Egypt | |
| Rest of Middle East and Africa |
| By Class | Class AAA Solar Simulators | |
| Class ABA Solar Simulators | ||
| Class ABB Solar Simulators | ||
| Class B & Others | ||
| By Light-Source Technology | Xenon Arc Lamp | |
| Metal-Halide Lamp | ||
| LED arrays | ||
| Quartz-Tungsten-Halogen (QTH) | ||
| Hybrid/Others | ||
| By Spectral Range (Qualitative Analysis Only) | UV (100 to 400 nm) | |
| Visible (400 to 780 nm) | ||
| IR (780 to 2500 nm) | ||
| By Application | PV Cell/Module Testing | |
| Material Testing | ||
| SPF Testing for Cosmetics | ||
| Automotive and Aerospace Testing | ||
| Others | ||
| By End-user | Solar-Panel Manufacturers | |
| Certification Bodies (Cosmetics, Buildings) | ||
| Academic and Research Institutes | ||
| Automotive | ||
| Aerospace and Defense | ||
| Others | ||
| By Geography | North America | United States |
| Canada | ||
| Mexico | ||
| Europe | Germany | |
| United Kingdom | ||
| France | ||
| Italy | ||
| NORDIC Countries | ||
| Russia | ||
| Rest of Europe | ||
| Asia-Pacific | China | |
| India | ||
| Japan | ||
| South Korea | ||
| ASEAN Countries | ||
| Rest of Asia-Pacific | ||
| South America | Brazil | |
| Argentina | ||
| Rest of South America | ||
| Middle East and Africa | Saudi Arabia | |
| United Arab Emirates | ||
| South Africa | ||
| Egypt | ||
| Rest of Middle East and Africa | ||


Key Questions Answered in the Report
What CAGR is forecast for the solar simulator market through 2030?
The market is projected to grow at a 7.48% CAGR between 2025 and 2030.
Which region currently leads global demand for solar simulators?
Asia-Pacific holds the largest share at 41.5% of 2024 revenue, driven by China and India.
Why are LED-based solar simulators gaining popularity?
LED units deliver lower lifecycle costs, improved spectral programmability, and reduced UV-related safety concerns, supporting a 9.5% CAGR.
How does IEC 60904-9:2024 affect equipment procurement?
The updated standard imposes tighter spectral and stability tolerances, prompting mandatory upgrades across laboratories worldwide.
Which application segment shows the fastest unit growth?
Cube-sat and small-sat solar array testing is expanding rapidly as low Earth orbit constellations proliferate.
What is the main supply-chain risk for xenon-based simulators?
Xenon lamp production depends on neon sourced largely from Ukraine, exposing the value chain to geopolitical disruptions.
Page last updated on:


