Solar PV Testing Equipment Market Size and Share
Market Overview
| Study Period | 2021 - 2031 |
|---|---|
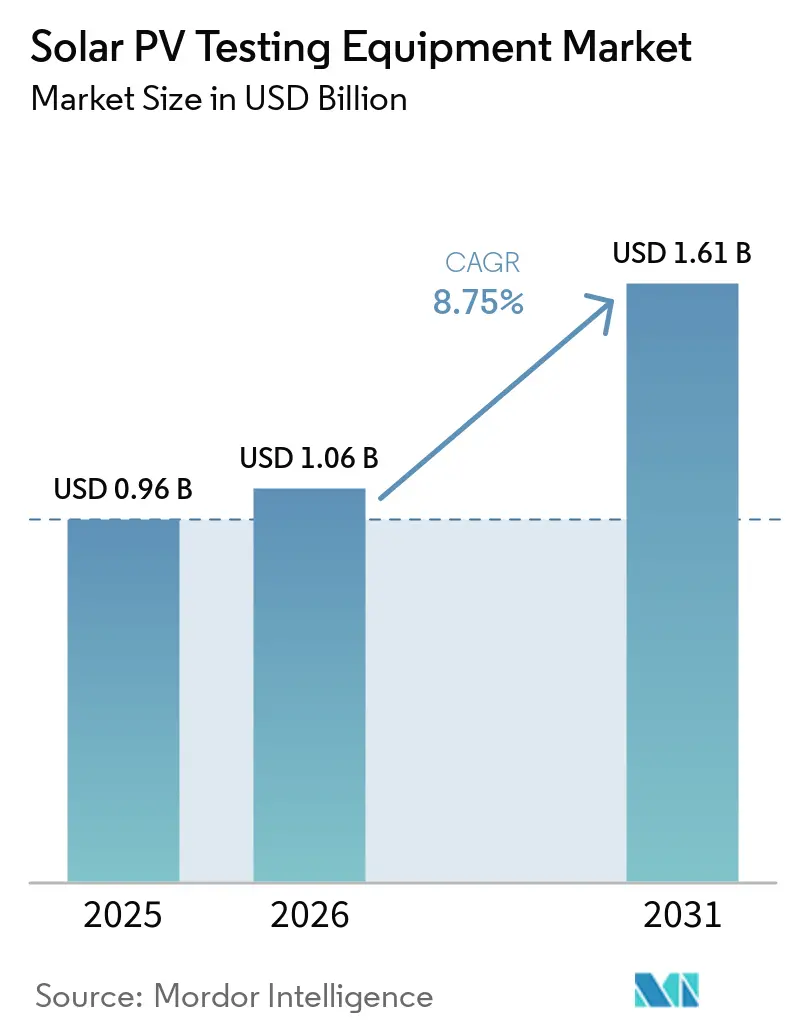
| Market Size (2026) | USD 1.06 Billion |
| Market Size (2031) | USD 1.61 Billion |
| Growth Rate (2026 - 2031) | 8.75% CAGR |
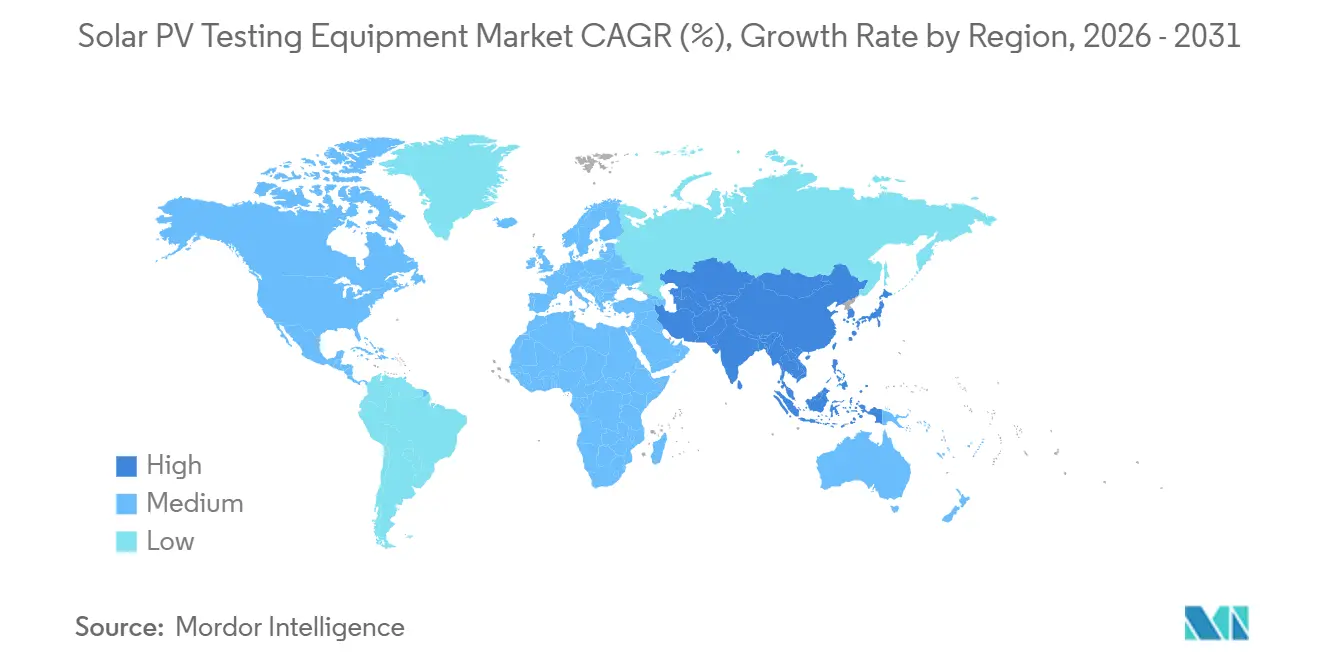
| Fastest Growing Market | Asia-Pacific |
| Largest Market | Asia-Pacific |
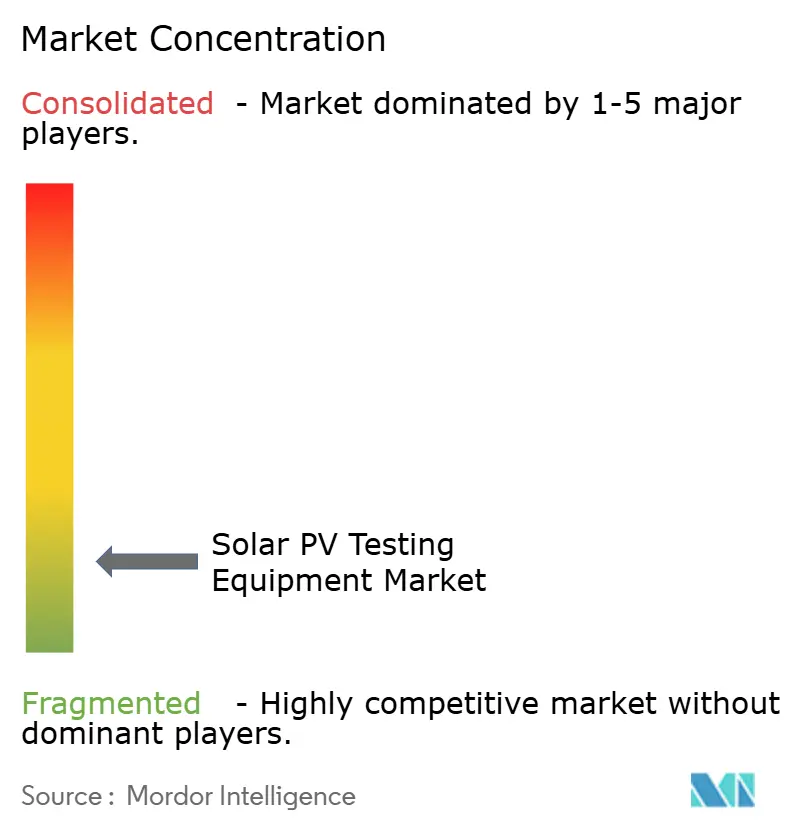
| Market Concentration | Low |
Major Players *Disclaimer: Major Players sorted in no particular order Image © Mordor Intelligence. Reuse requires attribution under CC BY 4.0. | |
Solar PV Testing Equipment Market Analysis by Mordor Intelligence
The Solar PV Testing Equipment Market size is expected to grow from USD 0.96 billion in 2025 to USD 1.06 billion in 2026 and is forecast to reach USD 1.61 billion by 2031 at 8.75% CAGR over 2026-2031. Robust demand stems from record-high photovoltaic build-outs, 601 GW of new capacity entered service in 2024, combined with insurers’ insistence on third-party performance validation under IEC 62446-1, which moves testing from a “nice-to-have” to a finance-critical activity.[1]SolarPower Europe, “Global Market Outlook 2025-2029,” solarpowereurope.org String voltages are climbing to 1,500 V and, in pilot projects, 2,000 V, rendering pre-2020 test gear technically obsolete and igniting a replacement cycle that favors portable high-voltage IV curve tracers. Meanwhile, Europe’s rapid bifacial-module shift and China’s “four-abilities” grid-compliance mandate both require dual-irradiance and harmonic-response testing capabilities, accelerating orders for integrated, automated systems. Against that backdrop, cloud-connected analyzers that upload results directly into asset-management platforms are carving out premium niches as labor shortages intensify in North America and Western Europe.
Key Report Takeaways
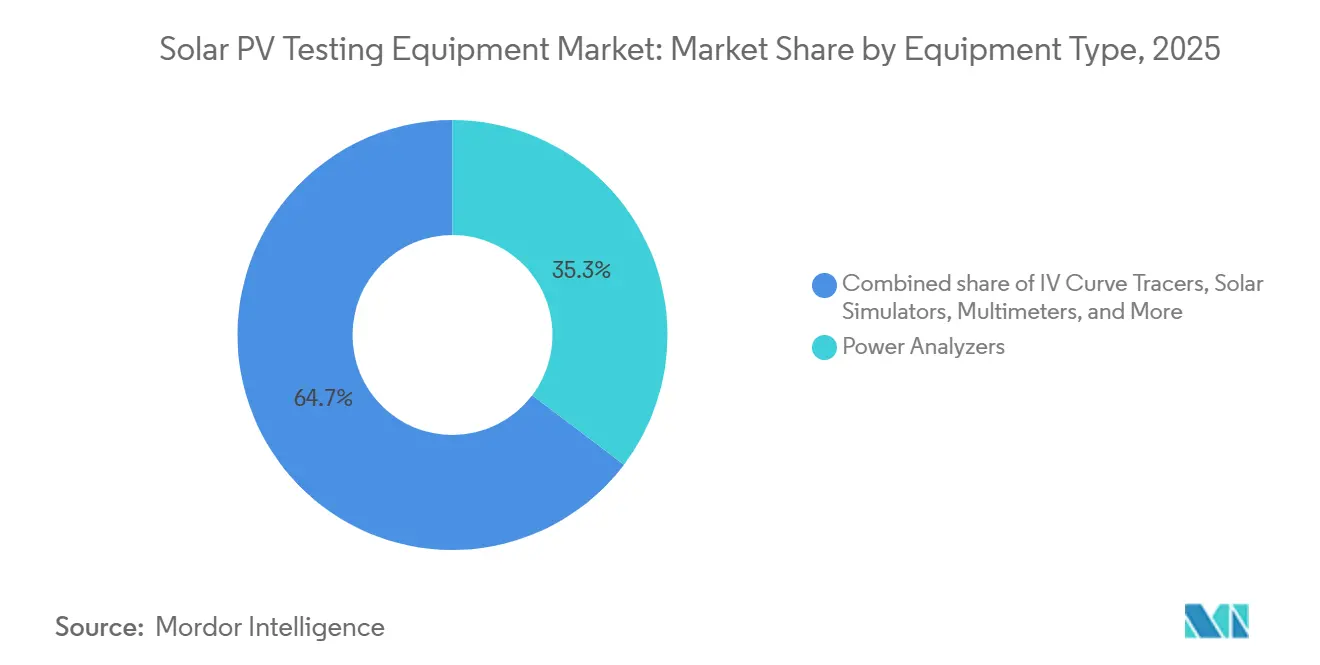
- By equipment type, power analyzers led with 35.3% of the Solar PV Testing Equipment market share in 2025, while IV curve tracers are projected to expand at a 9.4% CAGR through 2031.
- By technology, manual tools retained 46.1% share of the Solar PV Testing Equipment market size in 2025, yet automated systems record the fastest trajectory at 10.2% CAGR to 2031.
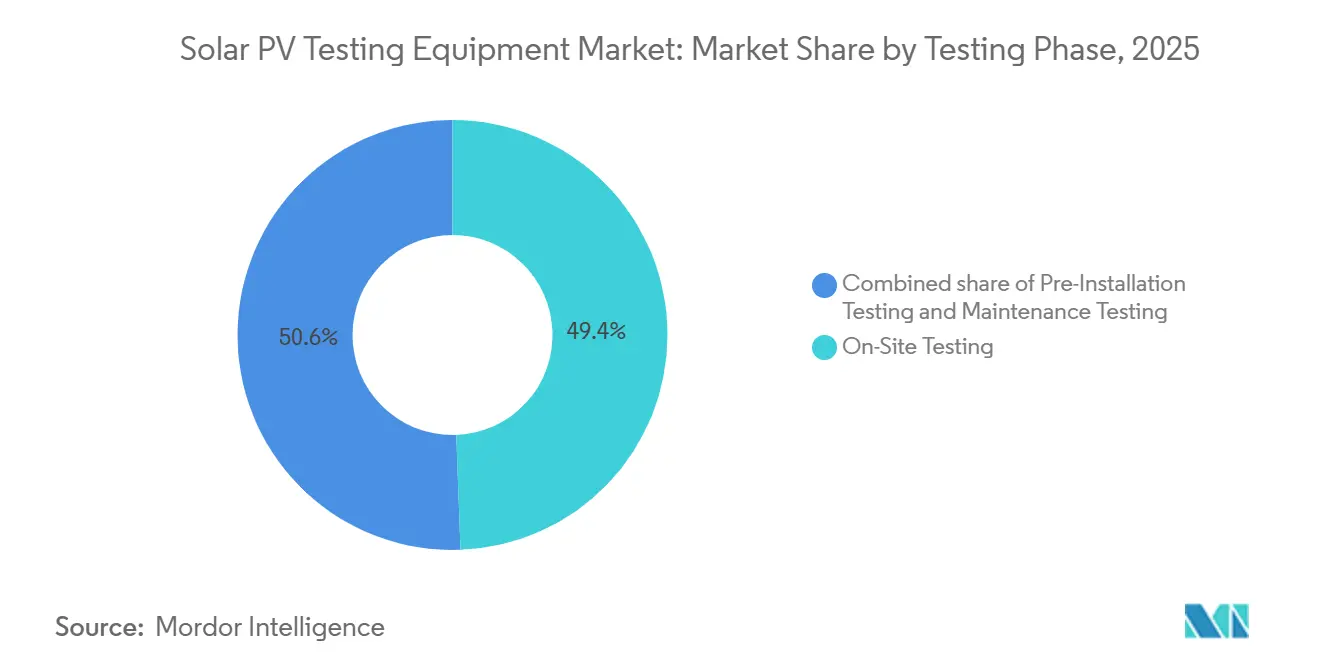
- By the testing phase, on-site commissioning dominated with 49.4% revenue in 2025; maintenance testing is forecast to grow at 9.7% CAGR as post-2015 fleets age into warranty-claim territory.
- By application, solar system installers accounted for 38.0% of the Solar PV Testing Equipment market size in 2025, and solar farms & utility-scale will advance at 9.6% CAGR over 2026-2031.
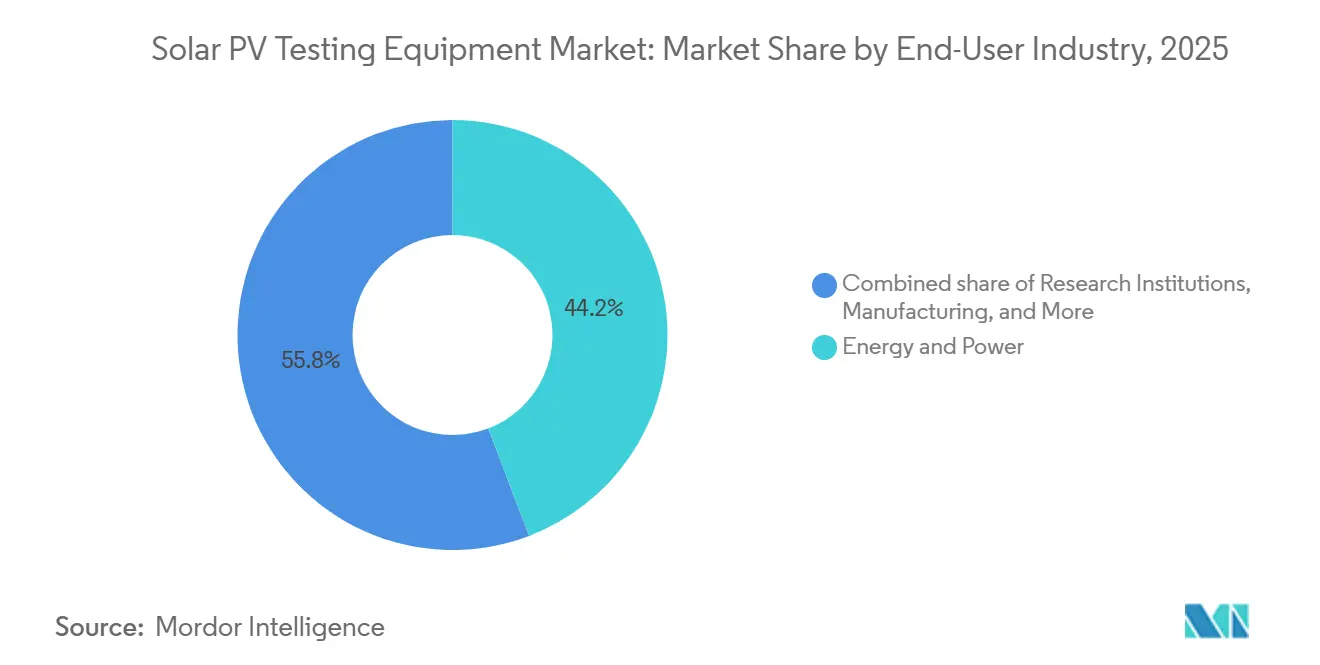
- By end-user industry, energy and power accounted for 44.2% of the Solar PV Testing Equipment market size in 2025 and will advance at 9.3% CAGR over 2026-2031.
- By region, Europe commanded 32.5% revenue in 2025, whereas Asia-Pacific is poised for the quickest expansion at a 10.4% CAGR through 2031.
Note: Market size and forecast figures in this report are generated using Mordor Intelligence’s proprietary estimation framework, updated with the latest available data and insights as of January 2026.
Global Solar PV Testing Equipment Market Trends and Insights
Drivers Impact Analysis*
| Driver | (~) % Impact on CAGR Forecast | Geographic Relevance | Impact Timeline |
|---|---|---|---|
| Escalating global PV installation volumes | +2.8% | Global, led by Asia-Pacific | Medium term (2-4 years) |
| Rapid cost decline of PV hardware and O&M digitalization | +1.9% | Europe and North America | Short term (≤ 2 years) |
| Evolving safety-compliance standards | +2.1% | North America and Europe | Long term (≥ 4 years) |
| Shift to 1,500 V string architectures | +1.5% | Global utility-scale projects | Medium term (2-4 years) |
| ESG-driven zero-defect procurement policies by asset owners | +1.2% | Global, concentrated in developed markets | Medium term (2-4 years) |
| Insurance underwriters mandating baseline performance data | +0.9% | North America & EU, expanding globally | Long term (≥ 4 years) |
| Source: Mordor Intelligence | |||
Escalating Global PV Installation Volumes
World solar additions hit 601 GW in 2024, lifting cumulative installations above 2.26 TW and generating a sizable backlog of arrays awaiting grid-connection testing.[2]International Energy Agency, “Renewables 2025,” iea.org Asia-Pacific contributed roughly 71% of those megawatts, with China alone commissioning 357 GW, which in turn elongates factory and field-testing queues. Because commissioning happens after mechanical completion, Solar PV Testing Equipment Market revenues typically trail capacity additions by six to twelve months, smoothing topline volatility. The steep rise of bifacial modules, now more than three-quarters of shipments, necessitates rear-irradiance sensors unavailable in single-plane testers, pushing EPCs toward fleet upgrades. As a result, distributors report that back-orders for 1,500 V IV curve tracers now stretch eight weeks, double the 2023 lead time, underscoring demand tightness.
Rapid Cost Decline of PV Hardware & O&M Digitalization
Module prices across Europe averaged EUR 0.20 per watt in Q4 2024, compressing hardware capex and elevating commissioning to 3-5% of total installed cost. Developers, therefore, treat testing as yield insurance: missed hotspots can lower annual performance ratios by 200-300 basis points, pushing IRRs below debt covenants. Cloud-ready analyzers that autopopulate asset-management portals attract 20-30% price premiums yet remain attractive above 500 MW portfolio scale, where manual data entry becomes cost-prohibitive. Lower hardware costs thus paradoxically raise per-watt spending on high-precision testers, a tailwind for premium suppliers. This digital shift simultaneously unlocks subscription revenue models, cushioning vendors against cyclical hardware demand.
Evolving Safety-Compliance Standards
IEC 62446-1 revisions expanded mandatory documentation for arrays above 500 kW, obliging insulation-resistance measurement and polarity verification at the string level.[3] International Electrotechnical Commission, “IEC 62446-1:2024,” iec.ch In the United States, NEC 2023 now requires module-level rapid-shutdown within 30 seconds, validated by sub-second power analyzers.[4]National Fire Protection Association, “NFPA 70 (NEC 2023),” nfpa.org Europe’s ECODESIGN PV TESTING initiative likewise drafts protocols for bifacial degradation testing, foreshadowing stricter benchmarks by 2027. Contractors relying on pre-2020 gear risk failed inspections and liquidated-damages exposure, accelerating a replacement wave. Certification bodies such as TUV Rheinland, which operates five global solar labs, are positioned to enforce these standards, implicitly shaping purchasing specifications.
Shift to 1,500 V String Architectures
The International Technology Roadmap for Photovoltaics anticipates 1,500 V systems exceeding 75% of new utility-scale arrays by 2026. Higher voltage halves combiner-box counts and trims cable gauge, but it also renders legacy 1,000 V testers unusable. Next-generation IV curve tracers rated for 1,500 V cost USD 30,000-50,000, quadruple entry-level units. China’s “four-abilities” directive further requires analyzers capable of injecting harmonics to confirm inverter ride-through functions. Vendors offering retrofit probe kits at 40% of full-replacement cost are gaining popularity among mid-tier EPCs, while top developers simply overhaul fleets to de-risk schedules.
Restraints Impact Analysis*
| Restraint | (~) % Impact on CAGR Forecast | Geographic Relevance | Impact Timeline |
|---|---|---|---|
| High CAPEX for advanced testing equipment | -1.8% | Emerging markets in Africa, South America, Southeast Asia | Short term (≤ 2 years) |
| Shortage of certified PV test technicians | -1.3% | Latin America, Middle East & Africa, Southeast Asia | Medium term (2-4 years) |
| Smart inverters' built-in self-diagnostics curbing external tester demand | -0.7% | Global, particularly utility-scale installations | Long term (≥ 4 years) |
| Cyber-security concerns over cloud-connected test gear | -0.6% | Global, concentrated in critical infrastructure | Short term (≤ 2 years) |
| Source: Mordor Intelligence | |||
High CAPEX for Advanced Testing Equipment
Fully automated rigs able to execute all IEC 62446-1 checks across 1,500 V strings cost USD 50,000-80,000, a figure that eclipses the annual revenue of small installers in Egypt, Indonesia, and Argentina. European and U.S. EPCs amortize such gear over portfolios surpassing 200 MW, but contractors in developing regions rely on handheld meters and thermal cameras that insurers may reject. Leasing solutions remain scarce where banks lack familiarity with residual equipment values, deepening the affordability gap. Service companies are stepping in with rental fleets, charging USD 500-1,500 per MW for on-demand commissioning, thus broadening market reach without requiring end-user capex.
Shortage of Certified PV Test Technicians in Emerging Markets
IRENA counts 7.2 million solar jobs globally, yet 72% reside in Asia, leaving Latin America, Africa, and the Middle East short of NABCEP-style credentials. U.S. certification bodies list fewer than 8,000 technicians qualified to interpret IEC performance indices, versus a domestic solar workforce topping 280,000. Training can cost USD 2,000-5,000 and demand six months of supervised fieldwork, deterring entrants in regions where annual wages hover around USD 20,000. Women hold only 32% of solar roles, and even fewer obtain technical certification, narrowing talent pipelines further. Automation helps, but insurers still insist on human sign-off, keeping demand for skilled labor structurally high.
*Our forecasts treat driver/restraint impacts as directional, not additive. The impact forecasts reflect baseline growth, mix effects, and variable interactions.
Segment Analysis
By Equipment Type: IV Curve Tracers Outpace Legacy Analyzers
Power analyzers contributed 35.3% of the Solar PV Testing Equipment market revenue in 2025, reflecting their multipurpose roles in inverter efficiency, harmonic distortion, and grid-compliance verification. IV curve tracers, however, are forecast to post the fastest 9.4% CAGR through 2031 as developers elevate string-level diagnostics to preempt soiling-induced hotspots that can breach insurers’ 80% performance-ratio thresholds. Drone-borne thermal imagers scan up to 100 MW per day, outperforming ground crews by a factor of ten, yet aviation restrictions near airports preserve a niche for handheld cameras. Integrated testers that merge IV tracing, insulation resistance, and infrared imaging in one chassis reduce commissioning labor by 30%, positioning that category as an attractive upgrade pathway.
Second-generation tracers rated for 1,500 V now dominate bid documents across India and the Middle East, while 2,000 V-capable prototypes entered field trials in 2025. As a result, the Solar PV Testing Equipment Market expects a mid-cycle replacement bump in 2028 when early 1,500 V fleets require recalibration. Thermal imagers still underpin maintenance programs for projects commissioned before 2015, whose encapsulant layers are entering accelerated degradation phases invisible to electrical tests. Meanwhile, solar simulators remain confined to factory quality-control and research labs.


By Technology: Automation Gains Despite Manual Dominance
Manual devices retained 46.1% share of the Solar PV Testing Equipment Market in 2025, a legacy of multimeters purchased before stringent modern standards. Automated platforms, though, will expand at 10.2% CAGR as labor scarcities push contractors toward capital solutions. Cloud-enabled analyzers streamline report generation for asset managers overseeing portfolios beyond 500 MW, where data-entry savings outweigh hardware premiums. Portable designs powered by lithium-ion packs achieve eight-hour runtimes, eliminating generator needs at remote desert sites and cutting logistics costs.
Yet full autonomy faces regulatory friction: underwriters still mandate expert review of raw IV curves, capping labor displacement. Hybrid systems, such as programmable DC supplies that auto-sequence grid-fault tests but require technician countersignature, typify interim adoption patterns. Retrofit Bluetooth modules that add automated logging to legacy testers cost under USD 1,200, appealing to small-scale installers and extending product life cycles. Consequently, the Solar PV Testing Equipment industry balances innovation with backward compatibility to sustain installed-base relevance.
By Testing Phase: Maintenance Surges as Fleets Age
On-site commissioning commanded 49.4% revenue in 2025, yet maintenance activities will rise at 9.7% CAGR as the installed base surpasses 2.26 TW and arrays cross the 10-year degradation inflection. IEC TS 61724-2:2025 formalizes annual thermal-imaging sweeps, institutionalizing recurring demand. Performance ratios erode 3-7% annually in dusty climates unless cleaned optimally; testers equipped with soiling-loss analytics help asset owners schedule washes cost-effectively. Dual-irradiance kits tailored to bifacial modules address asymmetric wear that single-plane sensors overlook, commanding 40% price premiums.
Pre-installation testing remains a niche segment because most factories internalize quality control, but blockchain-enabled module passports may further reduce warehouse inspections, sharpening focus on field tests. Vendors respond by shifting revenue models toward cloud analytics that monetize longitudinal performance data. Over time, data services could outstrip hardware profits, echoing trends in power electronics monitoring.
By Application: Utility-Scale Projects Drive Fastest Growth
Installers accounted for 38.0% of spending in 2025, yet utility-scale solar farms will post the briskest 9.6% CAGR to 2031 as projects above 100 MW embed comprehensive test protocols costing USD 100,000-300,000 per site. Solar module manufacturers invest steadily in inline testers, but factory overcapacity limits growth. Research institutions, though small, pay double the average unit prices to secure NIST-traceable calibration, supporting top-end margins.
Third-party O&M providers increasingly rent high-voltage IV curve tracers on a per-megawatt basis, allowing smaller EPCs to comply with insurance requirements without hefty capex. In North America and Europe, outsourced commissioning accelerates start-up timelines, while Asian contractors prefer in-house capacity to control schedules. Cyber-secure testers meeting NERC CIP and EU NIS2 encryption mandates are an emerging requirement for utility-scale owners, adding a new specification layer to purchasing decisions.
By End-User Industry: Energy Sector Concentration Persists
Utilities and independent power producers supplied 44.2% of the Solar PV Testing Equipment market revenue in 2025 and are poised for 9.3% CAGR through 2031. Construction contractors remain cyclical buyers, sensitive to interest-rate regimes that influence project pipelines. Manufacturing end-users curtail capital upgrades as Chinese module oversupply suppresses margins, deferring large orders for new simulators.
Government procurement, though modest in volume, sets high compliance bars: the U.S. General Services Administration now requires third-party commissioning on all federal solar assets. Research laboratories demand metrology-grade stability, bolstering sales for Keysight and Yokogawa. Vertically integrated developers like NextEra Energy increasingly internalize testing functions, reducing addressable hardware demand for independent service firms yet deepening opportunities for calibration services.
Geography Analysis
Europe captured 32.5% of the Solar PV Testing Equipment market revenue in 2025, underpinned by rigid compliance frameworks and a leap in bifacial-module penetration from 17% to 74% of German installs during 2024. New European Union funding, via the CINEA-backed ECODESIGN PV TESTING project, signals imminent tightening of standards for rear-side irradiance verification, likely triggering another mid-decade purchasing surge. However, permitting timelines stretching beyond four years in some member states delays tester procurements until grid-connection certificates are certain, injecting episodic demand lumps.
Asia-Pacific is the fastest-growing region, set to rise at 10.4% CAGR through 2031. China’s distributed PV stock exceeded 508 GW by September 2025 and is governed by the “four-abilities” rule requiring analyzers to validate self-healing and interaction functions. India’s 31.9 GW of 2024 additions, alongside its production-linked incentive for module manufacturing, feed parallel demand for factory-floor testers. Technician shortages across Southeast Asia temper uptake of fully automated systems, leading contractors to favor rugged manual tools backed by regional calibration labs.
North America installed 47 GW in 2024, yet interconnection queues surpassing 2 TW postpone notice-to-proceed milestones, deferring tester purchases. Nevertheless, the Inflation Reduction Act’s long-dated tax credits underpin a robust pipeline that will convert to equipment orders as grid upgrades unlock capacity. The Middle East accelerates with gigawatt-scale tenders in Saudi Arabia and the UAE, adopting 1,500-V strings, demanding high-voltage certification equipment. Africa and South America grapple with financing headwinds, but rental models for portable testers lower adoption barriers for small-scale installers.

Competitive Landscape
The Solar PV Testing Equipment Market is highly fragmented because regional standards and calibration partnerships act as natural moats. Fluke Corporation leverages its Solmetric acquisition to pair clamp meters with cloud analytics, harvesting subscription revenue in addition to hardware sales. Chroma ATE commands the premium automation niche with programmable DC supplies simulating IEEE 1547-2018 grid-fault conditions at millisecond resolution. Seaward and Metrel compete through integrated testers that fold IV tracing, insulation resistance, and thermal imaging into a single chassis, cutting commissioning labor by nearly one-third.
Cybersecurity has emerged as a differentiator: North American utilities now specify NERC CIP-compliant encryption in procurement documents, pressuring vendors to harden data pathways. Drone-based thermography service providers disrupt conventional workflows by charging per-megawatt survey fees 40% below ground-crew alternatives, appealing to large sites where speed to revenue matters. Data analytics is the next battleground; AI models trained on tens of thousands of IV curves already detect cell cracks with 95% accuracy, slashing analysis times and enabling same-day sign-offs. Regulatory caution, however, ensures human oversight persists, moderating immediate margin uplift from software-centric offerings.
Solar PV Testing Equipment Industry Leaders
Fluke Corporation
Seaward Electronic Ltd.
Keysight Technologies
Megger Group
HT Instruments (HT-Italia)
- *Disclaimer: Major Players sorted in no particular order

Recent Industry Developments
- March 2026: GameChange Solar completed the industry's inaugural full-scale seismic shake table testing for its Genius Tracker system. The tests adhered to IEEE 693 seismic design standards, replicating severe earthquake scenarios typical of high-risk areas like the New Madrid Seismic Zone.
- June 2025: WAVELABS and Eternal Sun have announced the integration of their solar testing portfolios, combining advanced cell-testing and module-testing solutions.
- May 2025: German testing equipment manufacturer WAVELABS introduced the SINUS-1000 ADVANCED Mini-Module Tester, an LED solar simulator specifically designed for research and development of perovskite, thin-film, and wafer-based photovoltaic modules. The system was unveiled at Intersolar Europe 2025.
- January 2025: India's Ministry of New and Renewable Energy (MNRE) has issued the revised Solar Systems, Devices, and Components Goods Order, 2025, which introduces stricter testing, efficiency, and compliance requirements for solar PV modules.


Global Solar PV Testing Equipment Market Report Scope
Solar PV Testing Equipment, known as specialized electrical tools, plays a crucial role in the installation, commissioning, maintenance, and troubleshooting of solar photovoltaic systems. These tools ensure the systems operate both safely and efficiently. Among the key devices are I-V curve tracers, solar irradiance meters, insulation testers, and clamp meters. These instruments not only measure voltage, current, and power output but also help in detecting faults.
The solar PV testing equipment market is segmented by equipment type, technology, testing phase, application, end-user industry, and geography. By equipment type, the market is segmented into power analyzers, IV curve tracers, thermal imagers, solar simulators, multimeters, and shunt resistors. By technology, the market is segmented into automated, manual, portable, and integrated systems. By the testing phase, the market is segmented into pre-installation, on-site, and maintenance. By application, the market is segmented into manufacturers, installers, utility-scale, R&D, and maintenance services. By end-user industry, the market is segmented into energy & power, manufacturing, construction, government, and research. The report also covers the market size and forecasts for 18 countries across major regions. Market forecasts are provided in terms of value (USD).
| Power Analyzers |
| IV Curve Tracers |
| Thermal Imagers |
| Solar Simulators |
| Multimeters |
| Shunt Resistors |
| Automated Testing Equipment |
| Manual Testing Equipment |
| Portable Testing Equipment |
| Integrated Testing Systems |
| Pre-Installation Testing |
| On-Site Testing |
| Maintenance Testing |
| Solar Panel Manufacturers |
| Solar System Installers |
| Solar Farms and Utility-Scale Installations |
| Research and Development |
| Maintenance and Repair Services |
| Energy and Power |
| Manufacturing |
| Construction and Infrastructure |
| Government and Public Sector |
| Research Institutions |
| North America | United States |
| Canada | |
| Mexico | |
| Europe | Germany |
| United Kingdom | |
| France | |
| Italy | |
| NORDIC Countries | |
| Russia | |
| Rest of Europe | |
| Asia-Pacific | China |
| India | |
| Japan | |
| South Korea | |
| ASEAN Countries | |
| Rest of Asia-Pacific | |
| South America | Brazil |
| Argentina | |
| Rest of South America | |
| Middle East and Africa | Saudi Arabia |
| United Arab Emirates | |
| South Africa | |
| Egypt | |
| Rest of Middle East and Africa |
| By Equipment Type | Power Analyzers | |
| IV Curve Tracers | ||
| Thermal Imagers | ||
| Solar Simulators | ||
| Multimeters | ||
| Shunt Resistors | ||
| By Technology | Automated Testing Equipment | |
| Manual Testing Equipment | ||
| Portable Testing Equipment | ||
| Integrated Testing Systems | ||
| By Testing Phase | Pre-Installation Testing | |
| On-Site Testing | ||
| Maintenance Testing | ||
| By Application | Solar Panel Manufacturers | |
| Solar System Installers | ||
| Solar Farms and Utility-Scale Installations | ||
| Research and Development | ||
| Maintenance and Repair Services | ||
| By End-User Industry | Energy and Power | |
| Manufacturing | ||
| Construction and Infrastructure | ||
| Government and Public Sector | ||
| Research Institutions | ||
| By Geography | North America | United States |
| Canada | ||
| Mexico | ||
| Europe | Germany | |
| United Kingdom | ||
| France | ||
| Italy | ||
| NORDIC Countries | ||
| Russia | ||
| Rest of Europe | ||
| Asia-Pacific | China | |
| India | ||
| Japan | ||
| South Korea | ||
| ASEAN Countries | ||
| Rest of Asia-Pacific | ||
| South America | Brazil | |
| Argentina | ||
| Rest of South America | ||
| Middle East and Africa | Saudi Arabia | |
| United Arab Emirates | ||
| South Africa | ||
| Egypt | ||
| Rest of Middle East and Africa | ||


Key Questions Answered in the Report
What is the Size of the Solar PV Testing Equipment Market?
The Solar PV Testing Equipment Market is projected to grow from USD 0.96 billion in 2025 to USD 1.06 billion in 2026 and is anticipated to reach USD 1.61 billion by 2031, registering a CAGR of 8.75% during 2026-2031.
Which region is expected to grow fastest for solar PV testing gear?
Asia-Pacific is forecast to expand at a 10.4% CAGR through 2031, outpacing all other geographies.
Who currently leads in equipment type revenue?
Power analyzers led with 35.3% of Solar PV Testing Equipment market share in 2025, reflecting broad compliance duties.
Why are IV curve tracers gaining traction?
Developers mandate string-level diagnostics to prevent performance-ratio drops, fueling a 9.4% CAGR for IV curve tracers through 2031.
What is the main restraint on adoption in emerging economies?
The high upfront cost of automated, 1,500 V-rated testers limits uptake among small installers where financing options remain limited.
How are labor shortages influencing product design?
Vendors are adding cloud connectivity and AI fault-classification to cut onsite technician hours, mitigating the shortage of certified PV test professionals.
Page last updated on:


