Floating Solar Panels Market Size and Share
Market Overview
| Study Period | 2020 - 2030 |
|---|---|
| Market Size (2025) | USD 1.06 Billion |
| Market Size (2030) | USD 3.39 Billion |
| Growth Rate (2025 - 2030) | 26.20% CAGR |
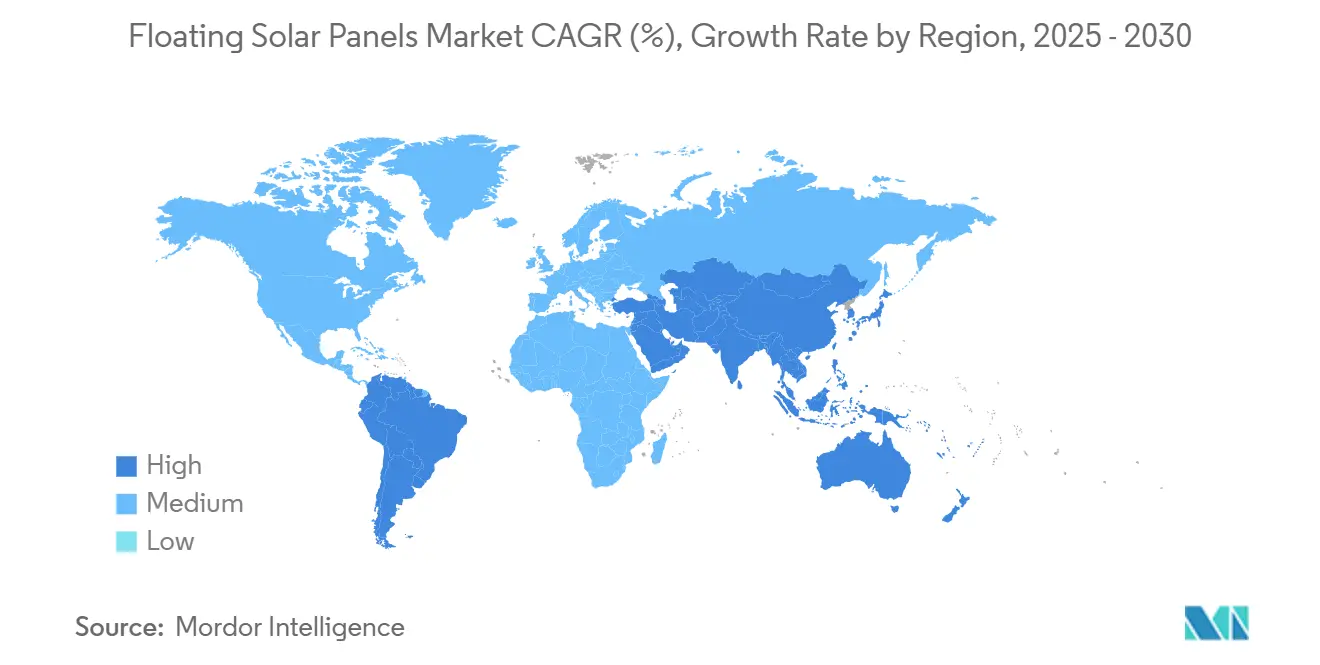
| Fastest Growing Market | Asia Pacific |
| Largest Market | Asia Pacific |
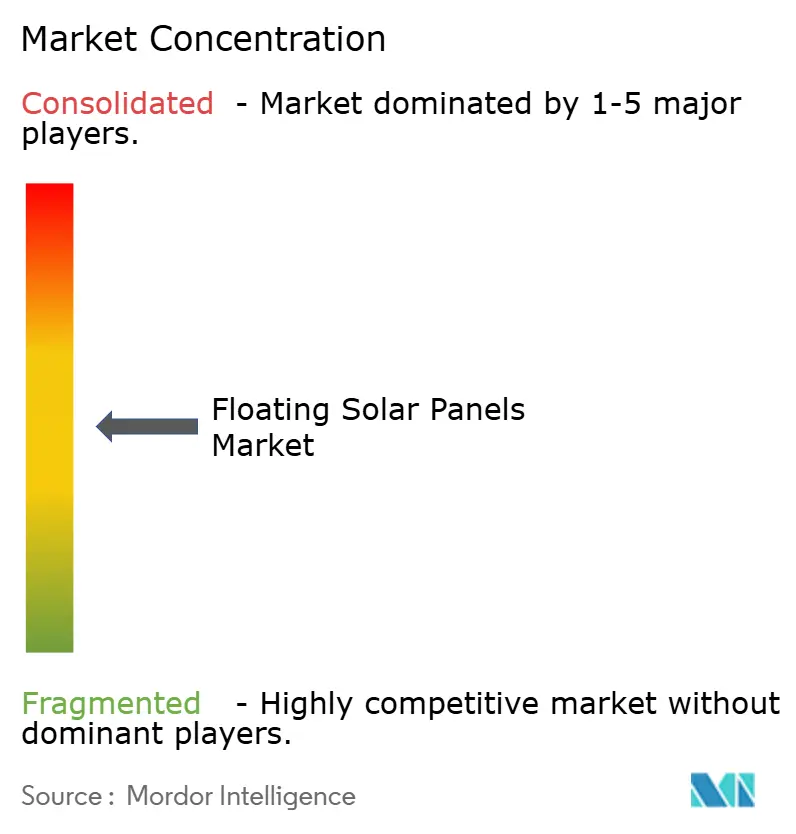
| Market Concentration | Medium |
Major Players *Disclaimer: Major Players sorted in no particular order Image © Mordor Intelligence. Reuse requires attribution under CC BY 4.0. | |

Floating Solar Panels Market Analysis by Mordor Intelligence
The Floating Solar Panels Market size is estimated at USD 1.06 billion in 2025, and is expected to reach USD 3.39 billion by 2030, at a CAGR of 26.20% during the forecast period (2025-2030).
Robust growth stems from land-scarcity pressures, mounting utility decarbonization mandates, and the proven energy-yield bonus created by water-borne cooling effects. The Asia-Pacific region, which already holds the largest share of the global floating solar panels market, is accelerating deployment through reservoir–hydro hybrids that increase renewable energy penetration without requiring additional land use. Stationary platforms remain the preferred design due to their lower complexity; however, marine-grade tracking solutions are closing the cost–benefit gap. Scaling momentum is reinforced by the dual benefits of higher solar output and water savings, which appeal to water-stressed regions worldwide.
Key Report Takeaways
- By product type, stationary systems led with an 81.5% share of the floating solar panel market in 2024; marine-grade tracking solutions are projected to advance at a 29.3% CAGR through 2030.
- By technology, polycrystalline modules accounted for 61.9% of the floating solar panels market size in 2024, while monocrystalline modules are growing fastest at a 30.7% CAGR to 2030.
- By capacity, the 5-50 MW segment accounted for 48.2% of the floating solar panels market size in 2024; projects above 50 MW are projected to rise at a 32.1% CAGR through 2030.
- By installation environment, reservoirs and lakes accounted for 65.7% of the floating solar panels market share in 2024; offshore and near-shore projects are expected to expand at a 35.5% CAGR through 2030.
- By geography, the Asia-Pacific region secured a 53.4% of floating solar panels market share in 2024 and is projected to advance at a 28.6% CAGR through 2030.
Global Floating Solar Panels Market Trends and Insights
Drivers Impact Analysis*
| Driver | (~) % Impact on CAGR Forecast | Geographic Relevance | Impact Timeline |
|---|---|---|---|
| Land scarcity & use of under-utilised water surfaces | +7.30% | APAC core, spill-over to Europe & North America | Long term (≥ 4 years) |
| Efficiency gains from cooling & evaporation reduction | +5.80% | Global, particularly water-stressed regions | Medium term (2-4 years) |
| Utility decarbonisation mandates | +4.70% | Europe, North America, developed APAC markets | Short term (≤ 2 years) |
| Reservoir–hydro hybridisation potential | +3.90% | Global hydropower regions, Brazil, China, India | Long term (≥ 4 years) |
| Canal-solar irrigation synergy | +3.10% | Arid regions, California, Middle East, Australia | Medium term (2-4 years) |
| Deployment incentives in water-stressed zones | +2.10% | California, Australia, Middle East, North Africa | Short term (≤ 2 years) |
| Source: Mordor Intelligence | |||
Land scarcity & use of under-utilized water surfaces
Densely populated economies are running short of inexpensive land sites, so utilities are increasingly positioning new capacity on water bodies to keep renewable build-outs on schedule. Research shows that covering just 1% of global reservoirs could unlock 404 GW of generating potential, roughly double the total solar additions achieved worldwide in 2024. Singapore, Japan, and urbanized Chinese provinces have already exhausted viable land parcels, and regulators in Germany removed a 15% surface-area cap to accelerate large-scale floating licenses. Because water-based layouts avoid land-use conflicts, project approvals move faster, creating a strategic channel for meeting national clean-energy goals without sacrificing agricultural acreage or conservation zones.
Efficiency gains from cooling & evaporation reduction
Continuous water contact keeps panel temperatures 10-15 °C lower than those of comparable ground mounts, increasing the annual energy yield by 0.6-4.4% and offsetting higher installation costs.(1)H. Tarigan, “Energy Yield Improvement in Floating PV,” ScienceDirect, sciencedirect.comThe same platform shades reservoirs and cuts surface evaporation by nearly 70%, a tangible benefit in regions where every cubic meter of stored water carries economic value. Operators cite examples where a 300 kWp floater saves around 12,700 m³ of water per year while delivering clean power, bolstering financial models that count both electrons and conserved water as revenue streams. This dual-resource upside differentiates the floating solar panel market from traditional PV and helps justify premium capex in arid climates.
Utility decarbonization mandates
To achieve carbon-neutral portfolios by 2030-2040, European and North American utilities are favoring water-based arrays that circumvent protracted land acquisition debates. Spain’s 2024 decree lets developers occupy 5-15% of select public reservoirs for 25 years under an expedited licensing process.(2)“Spain Approves New Floating PV Rule,” Taiyang News, taiyangnews.info Shorter permitting and the ability to co-locate with existing hydro assets speed project pipelines, evidenced by CHN Energy’s 320 MW open-sea floater, which moved from concept to grid connection within two years. Stable long-term tariffs anchored to decarbonization policy reduce revenue risk and channel institutional capital toward large-scale deployments in the floating solar panel market.
Reservoir–hydro hybridization potential
Hybrid floatovoltaic-hydropower complexes create a virtual storage mechanism: solar energy is delivered during the day while hydropower shifts its output to the evenings, thereby flattening the net-load curve without the need for new batteries. Modeling indicates that 25% coverage of existing reservoirs could unlock 4,400 GW of incremental renewable capacity and avoid 142.5 TWh of annual hydro losses by cutting evaporation. Brazil’s Lajeado project couples 97,200 power optimizers with high-albedo rafts to expand plant output while extending reservoir life.(3)“Lajeado Hydro–Solar Hybrid,” Tigo Energy, tigoenergy.comSimilar schemes in China, India, and Southeast Asia position floaters as an asset-life extension tool for legacy dams, strengthening the value proposition of the floating solar panel market.
Restraints Impact Analysis*
| Restraint | (~) % Impact on CAGR Forecast | Geographic Relevance | Impact Timeline |
|---|---|---|---|
| Higher CAPEX vs ground-mount PV | -3.90% | Global, particularly cost-sensitive markets | Short term (≤ 2 years) |
| Limited insurance underwriting capacity | -3.10% | Global, acute in emerging markets | Medium term (2-4 years) |
| Anchoring & O&M complexity | -2.10% | Marine environments, harsh weather regions | Long term (≥ 4 years) |
| Ecological / permitting hurdles | -1.60% | Europe, North America, environmentally sensitive regions | Medium term (2-4 years) |
| Source: Mordor Intelligence | |||
Higher CAPEX vs ground-mount PV
Floater installations command 50-100% capex premiums relative to terrestrial arrays because of buoyant pontoon systems, marine-grade cables, and site-specific anchoring. Canal deployments can double that cost due to elevated structures and pile foundations, as noted in E360. Progressive scale effects are trimming component prices, yet many investors still model higher hurdle rates. Where land prices or water-conservation benefits are substantial, the delta narrows enough to justify investment, pointing the floating solar panels industry toward water-stressed and high-real-estate-value geographies first.
Limited insurance underwriting capacity
Global insured solar losses exceeded USD 50 billion in 2024, prompting carriers to tighten coverage terms. Floating projects confront uncharted marine risks—such as wave loads, biofouling, and corrosion—so actuarial models remain underdeveloped. Developers often self-insure or negotiate elevated premiums that chip away at project IRRs. Emerging-market sponsors face an additional hurdle because domestic insurers rarely possess expertise in coastal engineering, which magnifies financing complexity and tempers otherwise strong demand in the floating solar panels market.
*Our forecasts treat driver/restraint impacts as directional, not additive. The impact forecasts reflect baseline growth, mix effects, and variable interactions.
Segment Analysis
By Product Type: Stationary Systems Dominate Despite Tracking Innovation
The floating solar panels market for stationary platforms reached USD 673.0 million in 2024, equal to 81.5% of total installations. Stationary pontoons thrive because they offer simplified anchoring, lower O&M expenditures, and proven reliability, which align with utility-scale financing norms. Developers deploying 5-50 MW arrays on reservoirs tend to favor fixed orientation to mitigate mechanical failure risk in humid environments. Even so, tracking solutions are projected to register a 29.3% CAGR to 2030 as suppliers like Soltec unveil naval-style bearings that can tolerate continuous oscillation. Early adopters in Indonesia and China report yield gains of up to 15%, which offset the added complexity, signaling that water-borne trackers will play a larger role once supply chains mature.
Competitive balance may shift further once hybrid stationary-tracking systems achieve volume manufacturing. These platforms engage single-axis movement only during high-irradiance windows, reducing wear while extracting marginal kilowatt-hours vital for merchant-tariff markets. In South Korea’s Saemangeum project, pilot rows have shown an 8% production uplift with negligible extra maintenance, a sign that evolving engineering will eventually narrow the cost-performance gap. As marine hardware prices ease, tracking penetration is expected to capture a rising slice of the floating solar panels market by 2030.


By Technology: Monocrystalline Gains Ground Despite Polycrystalline Leadership
Polycrystalline modules accounted for 61.9% of 2024 installations in the floating solar panels market growth, favored for their lower price points and acceptable efficiency on spacious reservoirs. In many ASEAN projects, panel cost still outweighs space optimization, keeping polycrystalline in pole position. Yet monocrystalline units are growing at a 30.7% CAGR because higher conversion efficiency reduces the total raft area and, by extension, the expenses for racking, cabling, and anchoring. Offshore pilots in the Dutch North Sea demonstrate system-wide savings, even after paying a module upcharge, once premium modules reduce auxiliary hardware tonnage.
Bifacial monocrystalline modules enhance this advantage when paired with reflective water surfaces, which increase rear-side irradiance by 17.3%. Developers are increasingly specifying bifacial designs for coastal lagoons, where wave agitation keeps the water clear and reflectivity high. Thin-film cadmium-telluride and perovskite tandem concepts remain experimental within the floating solar panels industry, yet pilot arrays in France suggest they may carve out market niches in diffuse-light northern latitudes once durability issues are resolved.
By Capacity Segment: Mid-Scale Projects Lead While Mega-Projects Accelerate
Utility operators tend to focus on 5-50 MW builds, which accounted for 48.2% of 2024 capacity additions. Projects at this scale offer economies of scale, yet remain digestible for single-asset financing vehicles typical in emerging markets. Grid interconnection process times and balance-of-plant spending also align neatly with reservoir footprints common across Europe and Southeast Asia. On the larger end, ventures above 50 MW are expanding at a 32.1% CAGR because private-equity-backed sponsors are chasing cost efficiencies. Hexa Renewables brought a 192 MW offshore array online in November 2024, validating bankability for mega-floaters in open-sea conditions.
Smaller sub-5 MW plants continue to dot industrial lagoons and wastewater ponds, where they generate power to offset on-site demand under power-purchase self-consumption schemes. In California, brewery and data-center owners install micro-floaters to meet Scope 2 targets while saving cooling water. As diverse capacity tiers mature, they collectively reinforce supply-chain robustness across the floating solar panels, unlocking modular design libraries adaptable to site-specific constraints.

By Installation Environment: Reservoirs Dominate While Offshore Expands Rapidly
Reservoirs and lakes absorbed 65.7% of the 2024 deployments, resulting in a floating solar panels market of USD 542.0 million. Calm waters simplify mooring design, reduce inspection frequency, and capitalize on existing transmission corridors at hydropower dams. Co-location minimizes permitting cycles because utilities already manage water rights and shoreline access. In Brazil, Companhia Energética de São Paulo pairs floaters with dam spillways to avoid greenfield substation builds, trimming soft costs and speeding revenue realization.
Offshore and near-shore projects, though smaller today, are advancing at a 35.5% CAGR. Developers target limitless sea surface and superior irradiance but must conquer higher wave loads. SolarDuck demonstrated a triangular pontoon that maintains a 45° tilt during a two-meter swell, decreasing salt spray deposition and increasing availability in the North Sea. Meanwhile, canal floaters occupy a specialty niche: the U.S. Department of the Interior’s USD 19 million program funds pilot strings across Central Valley irrigation channels, merging energy output with evapotranspiration reduction. Each environment adds diversity to the floating solar panels industry, spreading technology risk across multiple use cases.
Geography Analysis
The Asia-Pacific region contributed 53.4% of global revenue in 2024 and is projected to grow at a 28.6% CAGR from 2024 to 2030, reinforcing its leadership in the floating solar panels market. China’s CHN Energy grid-connected a 320 MW open-sea array that now ranks as the largest single floating unit worldwide. India’s Omkareshwar Floating Solar Park came online in January 2025, plugging 600 GWh a year into Madhya Pradesh’s grid while conserving valuable farmland. Indonesia’s 145 MW Cirata plant exemplifies Southeast Asia’s ambitious scale as the nation pursues a 23% renewables target by 2025. The region’s intense land competition and favorable policy feed-in tariffs ensure the floating solar panels market will remain a principal decarbonization tool there.
Europe stands as the second-largest cluster, energized by regulatory clarity. Germany’s July 2024 decision to lift the 15% surface cap unlocked a pipeline of 1 GW in advanced planning. Spain’s reservoir decree has fast-tracked public-water tenders, which now attract major EPC consortia. Multi-purpose floaters are appearing in Italy’s quarry lakes and France’s irrigation ponds, demonstrating geographic versatility and enhancing system resilience against energy price volatility.
North America remains an emerging arena, but it holds huge latent potential once capex premiums are compressed. California’s USD 15 million canal pilot illustrates the state’s commitment to coupling water savings with solar supply. Arizona’s Gila River Indian Community strung panels across a 3,000-foot irrigation stub, conserving 10 acre-feet per year. Policy momentum created by the Inflation Reduction Act’s clean-energy credits could widen the business case across other drought-prone states by mid-decade.

Competitive Landscape
The floating solar panel market exhibits moderate fragmentation, with the top five suppliers accounting for roughly 35% of cumulative installations. Early entrant Ciel & Terre leverages more than 2 GW of global deployments and continues refining its Hydrelio platform for various wave regimes. SolarDuck and Ocean Sun challenge incumbents through offshore-specific designs that convert naval engineering insight into PV structural resilience. SolarDuck’s triangular frames interlock like pontoons, reducing material intensity while maintaining a high freeboard, whereas Ocean Sun employs a flexible membrane that dampens wave energy and reduces mooring loads.
Strategic alliances define go-to-market tactics. Hexa Renewables and LG CNS co-develop Korean coastal plants, combining financial capability with EPC expertise. In Europe, BayWa r.e. collaborates with Zimmermann PV-Stahlbau to co-optimise float design and tracker software for Dutch peatlands. Intellectual property creation centers on corrosion-resistant polymers, automated debris cleaning, and drone-enabled inspection analytics. The mix of offshore pioneers and reservoir veterans ensures continuous innovation that will progressively lower lifecycle cost across the floating solar panels market.
Competition in the floating solar panel market is not solely technological; supply-chain localization also plays a vital role. Japanese integrators import EVA film and ethylene-vinyl acetate encapsulants from domestic chemical majors to guarantee long warranties and reassure conservative lenders. Chinese module manufacturers co-located pontoon molding lines near major dam clusters to slash logistics costs. These maneuvers help each cohort sharpen price competitiveness and open new markets without compromising reliability expectations.
Floating Solar Panels Industry Leaders
Ciel & Terre International
Sungrow Floating PV
Trina Solar Ltd
JA Solar Technology Co. Ltd
Ocean Sun AS
- *Disclaimer: Major Players sorted in no particular order

Recent Industry Developments
- January 2025: Union Minister Pralhad Joshi inaugurated India's Omkareshwar Floating Solar Park, highlighting the project as a showcase of India's clean energy ambitions and representing one of the country's largest floating solar installations.
- December 2024: NKS Solar One announced a USD 100 million investment in the first phase of a 250 MW floating solar project across Caliraya and Lumot Lakes in the Philippines, with contracts being finalized with Xian Electric and Energy China for engineering and construction.
- November 2024: Hexa Renewables commissioned the world's largest offshore floating solar plant, marking a significant milestone in offshore floating solar technology and demonstrating the commercial viability of marine installations.
- November 2024: CHN Energy completed the world's largest open-sea floating solar PV project in China, showcasing technological advancement in challenging marine environments and establishing new benchmarks for offshore floating solar deployment.


Global Floating Solar Panels Market Report Scope
| Stationary Systems |
| Tracking Systems |
| Hybrid Stationary-Tracking |
| Poly-crystalline |
| Mono-crystalline |
| Thin-film / Bifacial |
| Below 5 MW |
| 5 to 50 MW |
| Above 50 MW |
| Reservoirs/Lakes |
| Canals and Waterways |
| Offshore/Near-shore |
| North America | United States |
| Canada | |
| Mexico | |
| Europe | Germany |
| United Kingdom | |
| France | |
| Italy | |
| NORDIC Countries | |
| Russia | |
| Rest of Europe | |
| Asia-Pacific | China |
| India | |
| Japan | |
| South Korea | |
| ASEAN Countries | |
| Rest of Asia-Pacific | |
| South America | Brazil |
| Argentina | |
| Rest of South America | |
| Middle East and Africa | Saudi Arabia |
| United Arab Emirates | |
| South Africa | |
| Egypt | |
| Rest of Middle East and Africa |
| By Product Type | Stationary Systems | |
| Tracking Systems | ||
| Hybrid Stationary-Tracking | ||
| By Technology | Poly-crystalline | |
| Mono-crystalline | ||
| Thin-film / Bifacial | ||
| By Capacity Segment | Below 5 MW | |
| 5 to 50 MW | ||
| Above 50 MW | ||
| By Installation Environment | Reservoirs/Lakes | |
| Canals and Waterways | ||
| Offshore/Near-shore | ||
| By Geography | North America | United States |
| Canada | ||
| Mexico | ||
| Europe | Germany | |
| United Kingdom | ||
| France | ||
| Italy | ||
| NORDIC Countries | ||
| Russia | ||
| Rest of Europe | ||
| Asia-Pacific | China | |
| India | ||
| Japan | ||
| South Korea | ||
| ASEAN Countries | ||
| Rest of Asia-Pacific | ||
| South America | Brazil | |
| Argentina | ||
| Rest of South America | ||
| Middle East and Africa | Saudi Arabia | |
| United Arab Emirates | ||
| South Africa | ||
| Egypt | ||
| Rest of Middle East and Africa | ||


Key Questions Answered in the Report
How large is the floating solar panels market in 2025?
The floating solar panels market size stands at USD 1,057.96 million in 2025 and is forecast to surpass USD 3.38 billion by 2030 at a 26.20% CAGR.
Which region leads current deployment?
Asia-Pacific controls 53.4% of global installations thanks to land scarcity, aggressive clean-energy targets, and strong policy backing.
What design type dominates today’s installations?
Stationary floating systems represent 81.5% of capacity in 2024 due to simpler anchoring and lower maintenance needs.
Why are utilities adopting floating solar over ground mounts?
Water-borne arrays avoid land-acquisition hurdles, gain 0.6-4.4% higher energy yield from cooling, and cut reservoir evaporation by nearly 70%.
What is the biggest technical barrier limiting growth?
High up-front capex and limited insurance coverage raise financing hurdles, especially in cost-sensitive or emerging markets.
How fast are offshore floating projects scaling?
Offshore and near-shore arrays are expanding at a 35.5% CAGR through 2030 as marine-grade platforms and anchoring systems mature.
Page last updated on:


