
Software Defined Data Center Market Size and Share
Market Overview
| Study Period | 2020 - 2031 |
|---|---|
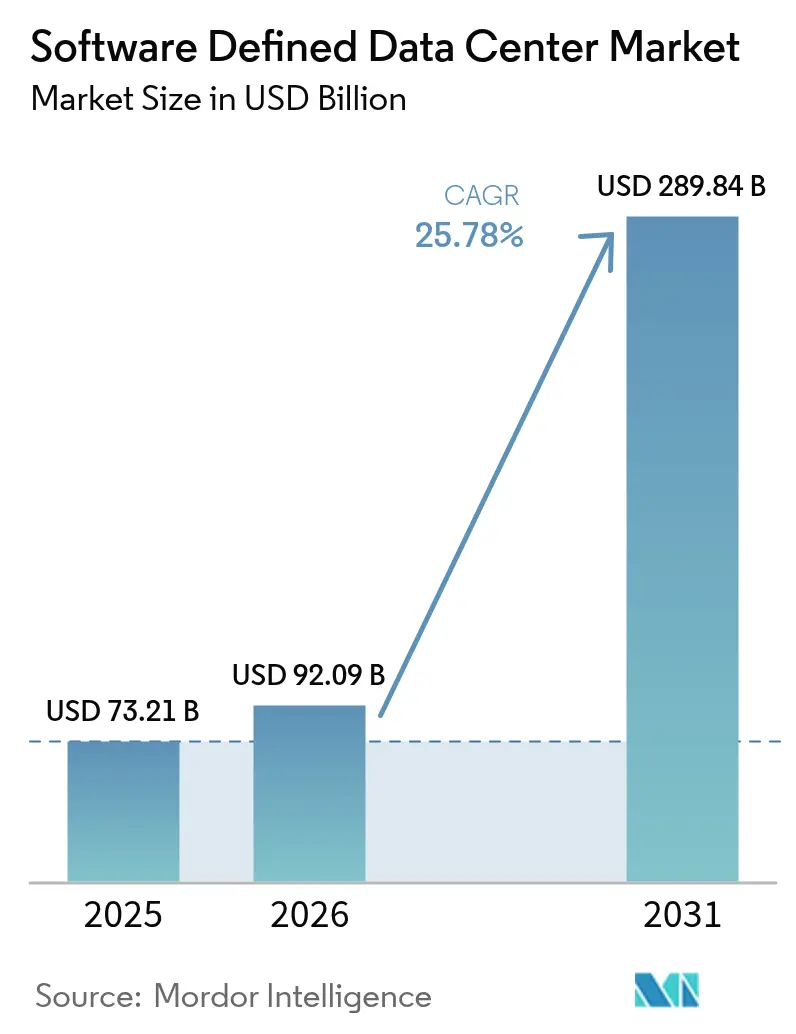
| Market Size (2026) | USD 92.09 Billion |
| Market Size (2031) | USD 289.84 Billion |
| Growth Rate (2026 - 2031) | 25.78 % |
| Fastest Growing Market | Asia Pacific |
| Largest Market | North America |
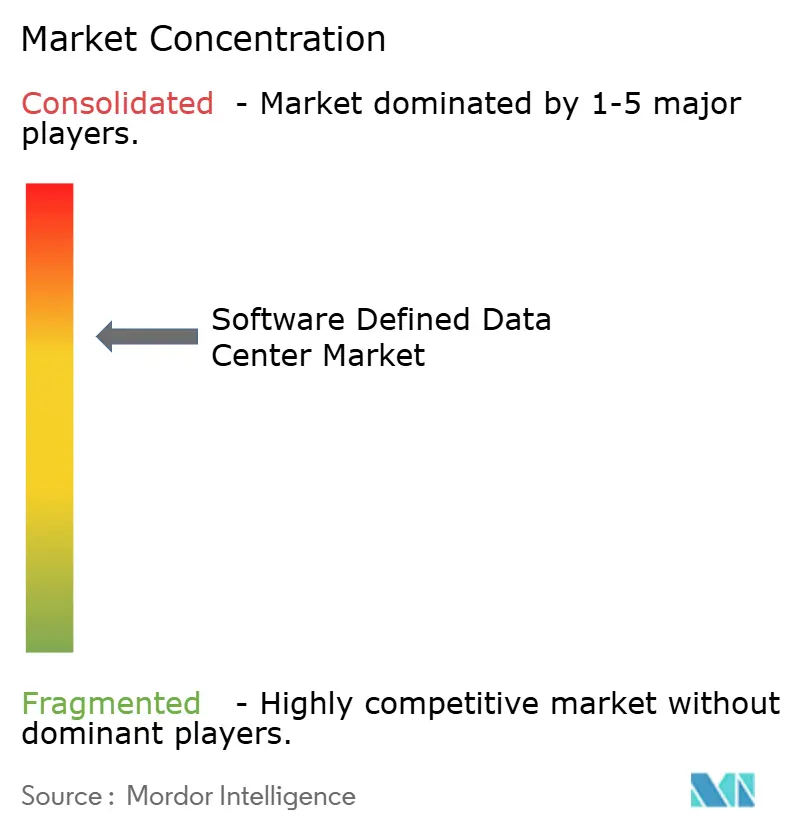
| Market Concentration | Medium |
Major Players *Disclaimer: Major Players sorted in no particular order Image © Mordor Intelligence. Reuse requires attribution under CC BY 4.0. | |
Software Defined Data Center Market Analysis by Mordor Intelligence
software-defined data center market size in 2026 is estimated at USD 92.09 billion, growing from 2025 value of USD 73.21 billion with 2031 projections showing USD 289.84 billion, growing at 25.78% CAGR over 2026-2031. Strong momentum comes from enterprise demand for agile infrastructure, cloud-first strategies, and steady advances in virtualization and automation platforms. Hyperscaler build-outs, coupled with rapid algorithmic workloads, are prompting record capital spending that spills over to colocation and edge operators. Sustained investment in AI-enabled data center infrastructure management, stricter carbon targets, and the arrival of nuclear micro-reactors for on-site generation further reshape competitive dynamics. Vendors able to unify compute, storage, and networking under policy-driven software layers are capturing wallet share from legacy hardware suppliers, while service partners monetize complex migration and managed operations mandates.
Key Report Takeaways
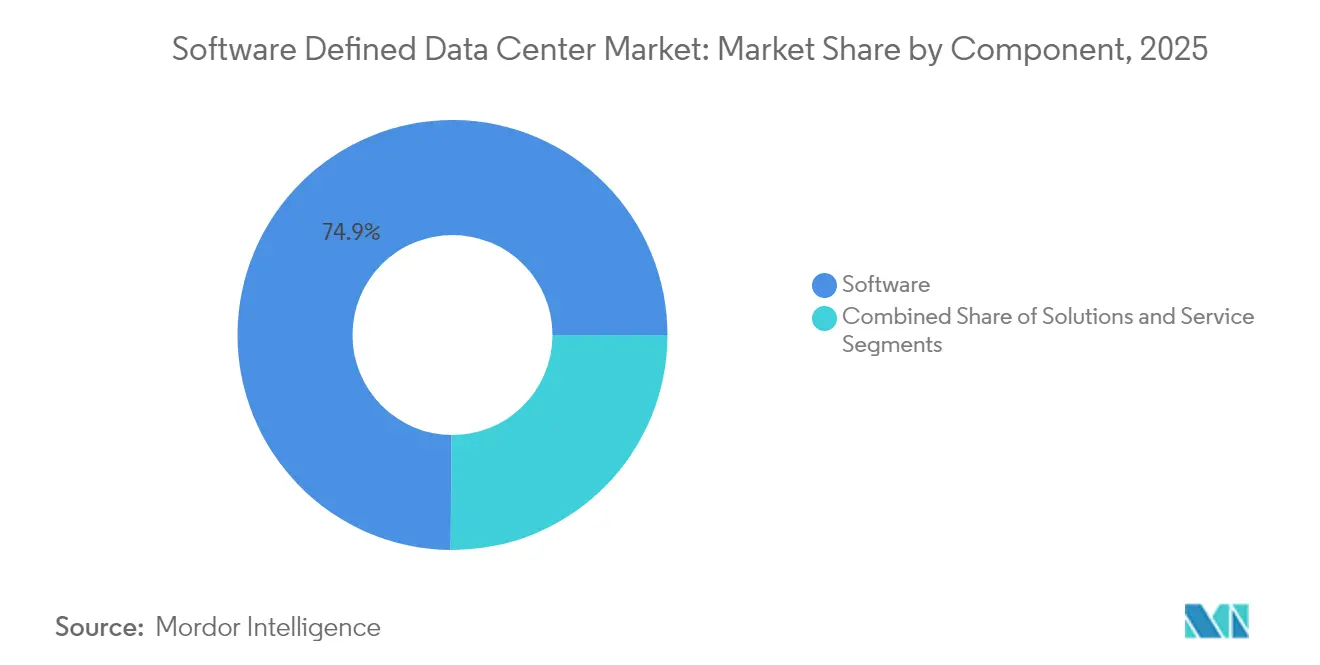
- By component, software products held 74.86% of 2025 revenue, while automation and orchestration tools are set to expand at a 27.63% CAGR through 2031.
- By deployment model, private environments commanded 40.72% of the software-defined data center market share in 2025, yet hybrid configurations post the highest growth outlook at 25.94% through 2031.
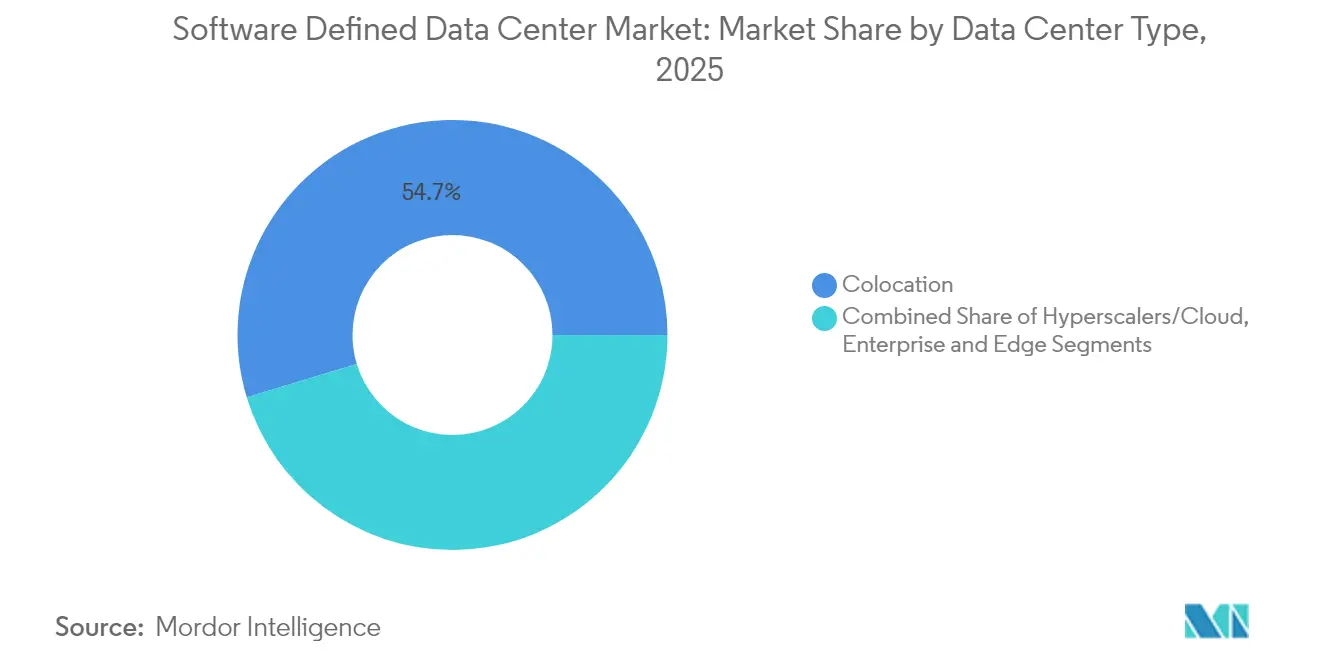
- By data center type, colocation facilities contributed 54.67% of 2025 revenue, whereas hyperscaler and cloud service provider sites are projected to climb at a 30.05% CAGR to 2031.
- By end-user vertical, IT and telecom companies generated the largest contribution at 41.12% in 2025; government and defense workloads represent the fastest trajectory at 26.38% CAGR through 2031.
Note: Market size and forecast figures in this report are generated using Mordor Intelligence’s proprietary estimation framework, updated with the latest available data and insights as of 2026.
Market Trends and Insights
Drivers Impact Analysis of Software Defined Data Center Market*
| Driver | ( ~ ) % Impact on CAGR Forecast | Geographic Relevance | Impact Timeline |
|---|---|---|---|
| Cost reduction in hardware and resource use | +6.8% | Global; pronounced in North America and Europe | Medium term (2-4 years) |
| Cloud and virtualization boom among enterprises | +5.2% | Global; strong in North America, Europe, developed APAC | Short term (≤ 2 years) |
| Hyper-converged and composable infrastructure uptake | +3.5% | North America, Europe, developed APAC | Medium term (2-4 years) |
| AI-driven DCIM and digital-twin optimisation | +3.2% | North America, Europe, rising in APAC | Medium term (2-4 years) |
| Nuclear micro-reactors unlocking rack-level densities | +2.4% | North America; pilot sites in Texas | Long term (≥ 4 years) |
| Edge-native micro-SDDC orchestration at 5G sites | +1.5% | Global; early adoption in North America, Europe, APAC | Medium term (2-4 years) |
| Source: Mordor Intelligence | |||
Cost reduction in hardware and resource use
Widespread decoupling of hardware and software lowers capital outlays and shrinks refresh cycles. Enterprises running full-stack SDDC platforms report infrastructure cost savings of 34% and a 564% three-year ROI on VMware Cloud Foundation deployments. Automated provisioning tightens utilization, letting firms cut data center footprints by 50% without performance degradation. Lower power and cooling bills compound the benefit, reinforcing project paybacks across regions.
Cloud and virtualization boom among enterprises
Virtualized compute, storage, and network pools underpin hybrid strategies that reconcile latency-sensitive workloads with public-cloud elasticity. Financial institutions using software defined data center market platforms achieved 40% faster message processing and 30% less downtime after modernizing middleware stacks intuitive.cloud. Kubernetes-ready hosts run side by side with virtual machines, simplifying DevOps pipelines and hastening rollouts.[2]Intuitive Cloud, “Enhancing Financial Messaging Infrastructure With Red Hat AMQ,” intuitive.cloud
Hyper-converged and composable infrastructure uptake
Pre-engineered nodes such as Dell EMC VxRail accelerate time-to-value and centralize lifecycle governance. Integrated Kubernetes in vSphere streamlines container orchestration, while composable fabrics dynamically compose bare-metal clusters for data-intensive analytics. Financial services and healthcare operators value predictable performance and simplified patching across regulated estates.[1]Dell Technologies, “VMware Cloud Foundation on Dell EMC VxRail,” delltechnologies.com
AI-driven DCIM and digital-twin optimisation
Artificial-intelligence engines embedded in DCIM suites model thermal loads, predict failures, and trigger self-healing policies. Digital twins mirror facility layouts, allowing operators to test changes without risk and drive 30% energy savings alongside reduced outages. Vendors integrating inference algorithms directly into virtualization layers gain a margin edge.[3]FS, “Revolutionizing Data Centers: Top 10 Technology Trends,” fs.com
Restraints Impact Analysis of Software Defined Data Center Market*
| Restraint | ( ~ ) % Impact on CAGR Forecast | Geographic Relevance | Impact Timeline |
|---|---|---|---|
| Data-security and compliance complexities | -1.9% | Global; intense in North America, EU | Medium term (2-4 years) |
| Legacy integration and migration costs | -1.5% | Global; largest in mature IT markets | Short term (≤ 2 years) |
| Grid-power scarcity and interconnect delays | -1.0% | North America, Europe, developing APAC | Medium term (2-4 years) |
| Increased vendor consolidation/TCO risk | -0.7% | Global | Short term (≤ 2 years) |
| Source: Mordor Intelligence | |||
Data-security and compliance complexities
Regulations such as the EU Digital Operational Resilience Act mandate tighter controls from January 2025, pushing financial institutions to verify cyber resilience across virtual layers. Abstracted resource pools challenge perimeter defenses, driving demand for unified key-management hubs like Fortanix Data Security Manager that integrate with VMware Sovereign Cloud. Compliance audits prolong project timelines and raise consulting spend.
Legacy integration and migration costs
Enterprises with decades-old monolithic stacks face application rewrites, data replication, and skill gaps that inflate capex and opex. Complex refactoring projects often encounter hidden dependencies, leading to scope creep and missed deadlines. Phased rollouts and coexistence architectures help mitigate risk but stretch ROI timeframes.
*Our forecasts treat driver/restraint impacts as directional, not additive. The impact forecasts reflect baseline growth, mix effects, and variable interactions.
Software Defined Data Center Market Segment Analysis
By Component:
Automation Drives Operational TransformationThe software-defined data center market size for software components reached USD 54.84 billion in 2025, equating to 74.86% of overall revenue. Orchestration engines and policy-based controllers are expanding at a 27.63% CAGR, underlining enterprise appetite for hands-free provisioning. Early adopters record sub-12-month paybacks on workflow automation and drift remediation. Security plug-ins, AI observability modules, and developer tool chains widen the addressable base as ecosystems mature.
Services contribute the remaining share, encompassing advisory, customization, and 24×7 managed operations. Providers bundle migration playbooks, reference architectures, and consumption-based billing to ease entry for heavily regulated verticals. Hardware innovations shift toward composable designs but stay governed by software policies, reinforcing the primacy of code-driven infrastructure.



By Deployment Model:
Hybrid Strategies Balance Control and FlexibilityPrivate instances captured 40.72% of the software-defined data center market in 2025, favored by organizations securing sensitive data. VMware Cloud Foundation exemplifies turnkey stacks that mimic public-cloud economies while retaining on-premises governance. Hybrid estates, however, are projected to post the highest 25.94% CAGR as firms seek elasticity for spiky workloads without abandoning sunk assets.
Rackspace SDDC Flex merges hosted private clouds with hyperscale extensions under a consumption model, illustrating how service providers blur deployment categories. Public-only footprints remain relevant for cloud-native firms, yet even they demand consistent policy engines across zones to avoid tool sprawl.
By Data Center Type:
Hyperscalers Accelerate Infrastructure InnovationColocation venues supplied 54.67% of 2025 revenue, offering neutral campuses where enterprises interconnect to multiple clouds. Operators invest in liquid cooling, blank-space expansions, and sovereign-cloud suites to retain demand. Hyperscalers are accelerating at a 30.05% CAGR, propelled by AI-centric clusters that may add 171-219 GW of global demand by 2031.
As grid connection queues lengthen, nuclear micro-reactors and on-site renewables gain traction. Edge micro-facilities located at 5G towers further broaden the taxonomy, enabling mission-critical latency guarantees for autonomous vehicles and AR streaming.
By End-user Vertical:
Government Sector Embraces ModernizationIT and telecom firms held the largest stake, leveraging continuous integration pipelines and network slicing to monetize 5G and OTT services. Government and defense agencies are scaling fastest at 26.38% CAGR as policies like the Federal Data Center Consolidation Initiative drive virtualization. Secure community clouds, sovereign encryption, and zero-trust blueprints dominate bid requirements.
The BFSI community pursues strict uptime and data residency through stretched clusters and active-active architectures. Healthcare systems apply SDDC to electronic health records and telemedicine, posting measurable boosts in data retrieval speed and clinician productivity. Retail chains integrate point-of-sale analytics and supply-chain telemetry in unified fabric overlays to enhance fulfilment.
Geography Analysis
North America Software Defined Data Center Market
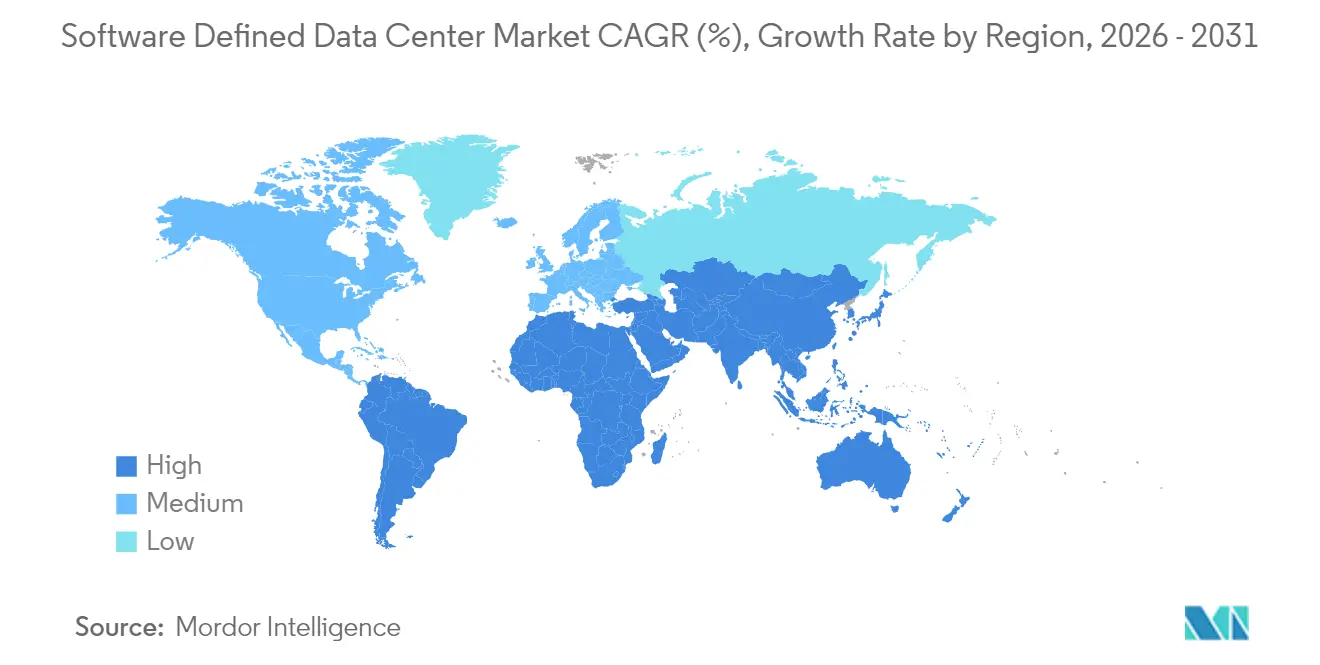
North America generated 47.05% of 2025 revenue, a consequence of early virtualization adoption, deep cloud ecosystems, and hyperscaler expansion corridors. Nuclear micro-reactor announcements in Texas signal creative approaches to power adequacy. Regulatory clarity around data-sovereignty zones fuels cross-border disaster-recovery pairings between the United States and Canada, while Mexico’s fintech sector ramps up hybrid footprints for open-banking initiatives.
APAC Software Defined Data Center Market
The Asia-Pacific software-defined data center market will rise at a 27.49% CAGR to 2031, aided by sovereign cloud grants, e-commerce surges, and digital-bank licensing rounds. Hyperscalers lease bulk capacity yet still rely on third-party developers to secure land, power, and permits. Singapore maintains hub status through carrier-dense campuses employing novel liquid cooling to meet power caps. India, Japan, and China inaugurate gigawatt-scale campuses, while Australia backs edge rollouts to serve remote mining operations.
EMEA Software Defined Data Center Market
Europe adopts SDDC in response to sovereignty and carbon targets. DORA’s January 2025 deadline is spurring financial institutions to harden cyber-resilience, expanding budgets for encrypted per-tenant overlays. Northern markets lead in adoption, and southern states accelerate via public-cloud landing zones and green-hydrogen pilots. The Middle East and Africa see rising activity in the UAE and Saudi Arabia, where utility-scale solar farms couple with modular data halls for clean-energy hosting.

Regulatory Landscape
Regulation affecting software-defined data center (SDDC) platforms is tightening around resilience, cybersecurity, and portability obligations that directly shape virtualization, orchestration, and managed-service contracting. In the United States, OMB Memorandum M-25-03 (January 2025) implements the Federal Data Center Enhancement Act baseline requirements for federal agency data center reliability, resiliency, and cybersecurity, and it raises procurement scrutiny for policy-driven automation, logging, and zero-trust controls across virtual layers.
In Europe, the Data Act (Regulation (EU) 2023/2854) became applicable on September 12, 2025, requiring cloud providers to remove technical and contractual barriers to customer switching. This reinforces demand for interoperable management planes, standardized APIs, and data portability across hybrid deployments. Separately, US federal actions in 2025 that streamline permitting for large data center projects and elevate national security considerations, including qualifying-project treatment for major projects, add compliance and reporting requirements that affect where SDDC stacks are deployed for sovereign and government-adjacent workloads.
Competitive Landscape
Incumbents such as VMware (now under Broadcom), Microsoft, Dell Technologies, and Cisco collectively control a significant portion of the software-defined data center market. Broadcom’s closing of the VMware acquisition centralizes licensing leverage and stirs customer reassessment of multi-vendor strategies. Technology alliances grow as suppliers fuse network fabrics, CPUs, GPUs, and storage-class memory into validated reference stacks. TerraPower and Sabey’s memorandum to pursue micro-reactor deployments demonstrates convergence between energy and IT operators.
Cloud-native challengers extend control planes into on-premises racks, obviating separate tool chains and eroding incumbent renewal pools. Product differentiation centers on AI-assisted remediation, sovereign-cloud blueprints, and frictionless workload mobility. VMware Cloud Foundation’s recognition as the 2025 “Most Innovative Cloud Infrastructure Solution” underscores the premium on integrated manageability. Sustainability features - carbon dashboards, workload placement engines, liquid-cooling integrations - serve as emerging tiebreakers in large RFPs.
Consolidation among managed service providers continues as firms seek geographic reach and specialized compliance skills. Hardware OEMs embrace consumption pricing to compete with cloud-like models, while semiconductor vendors leverage purpose-built DPU and NPU accelerators to offload infrastructure tasks. The resulting ecosystem encourages modular, vendor-agnostic architectures that preserve customer bargaining power.
Software Defined Data Center Industry Leaders
VMware Inc.
Microsoft Corporation
Dell Technologies
Cisco Systems, Inc.
Huawei Technologies Co., Ltd.
- *Disclaimer: Major Players sorted in no particular order
Software Defined Data Center Market Companies Covered in this Report
- VMware Inc.
- Microsoft Corp.
- Dell Technologies
- Cisco Systems
- Hewlett Packard Enterprise
- IBM Corp.
- Huawei Technologies
- Oracle Corp.
- Citrix Systems
- NEC Corp.
- Nutanix Inc.
- Amazon Web Services
- Google Cloud Platform
- Broadcom (VMware division)
- Juniper Networks
- Arista Networks
- Red Hat (IBM)
- Equinix Inc.
- Lenovo Group
- Rackspace Technology

Market Opportunities and Future Outlook
Private and hybrid SDDC standardization is a clear whitespace as enterprises operationalize AI and regulated workloads with consistent control planes across on-premises and cloud. VMware by Broadcom moved the platform baseline forward with VMware Cloud on AWS SDDC version 1.26 (January 2026, incorporating vSphere 8.0 Update 3) and introduced VMware Cloud Foundation 9.0 (March 2026), which adds NVMe memory tiering aimed at reducing server total cost of ownership versus DRAM-heavy configurations. The update aligns with buyers prioritizing automation, performance-per-watt, and predictable unit economics.
A second opportunity is the convergence of SDDC software with the power and interconnect architectures required for dense AI clusters. Enphase Energy highlighted 800 V DC rack power architectures using its IQ Solid State Transformer technology (July 2026), while 3M and Microsoft announced a partnership to deploy 3M Expanded Beam Optical technology in Azure hyperscale data centers (July 2026) to improve fiber connection density and maintainability. These changes push orchestration, observability, and policy-based placement deeper into facility constraints, expanding demand for SDDC automation tools that integrate with higher-voltage power distribution, accelerated networking, and sovereign-private-cloud operating models.
Recent Industry Developments in Software Defined Data Center Market
- July 2026: 3M and Microsoft announced a strategic partnership to deploy 3M Expanded Beam Optical (EBO) technology in Azure hyperscale data centers. The announcement targets higher fiber connection density and faster maintenance cycles, supporting more scalable network fabrics for software-defined, AI-heavy infrastructure. It also strengthens the link between physical-layer connectivity and software-driven operations in hyperscale environments.
- June 2025: Broadcom released VMware Cloud Foundation (VCF) 9.0, advancing the companys private-cloud platform roadmap for standardized SDDC deployments. The release reinforces a unified software stack approach across compute, storage, and networking policy layers, influencing enterprise refresh decisions and partner reference architectures. It also intensifies competitive pressure on alternative hybrid-cloud management and automation suites.
- June 2024: Dell Technologies and Broadcom extended their commitment to jointly engineered hyperconverged solutions aligned to VMware stacks. The collaboration supports validated, integrated infrastructure options that reduce deployment complexity for enterprises modernizing toward SDDC operating models. It also helps hardware-software co-engineering compete against disaggregated architectures and cloud-managed on-prem offerings.


Software Defined Data Center Market Report Scope and Research Methodology
Market Definition and Coverage
The market is defined as global revenue generated from software and services that virtualize and centrally manage compute, storage, and networking resources inside a data center, enabling automated provisioning and policy-based control.
Scope exclusions: We exclude data center facility build-out, physical servers and networking hardware, and internal-only tooling that is not sold as a commercial product.
Segments Covered in This Report
- By Component
- Solutions (SDN, SDS, SDC, Automation and Orchestration Security)
- Services (Consulting and Integration, Managed, Training and Support)
- By Deployment Model
- On-Premises
- Private Cloud
- Public Cloud
- Hybrid Cloud
- By Data Center Type
- Colocation
- Hyperscalers/Cloud
- Enterprise and Edge
- By End-user Vertical
- IT and Telecom
- BFSI
- Healthcare
- Retail and E-Commerce
- Manufacturing
- Government and Defense
- Media and Entertainment
- Energy and Utilities
- Other End Users
- By Geography
- North America
- United States
- Canada
- Mexico
- Europe
- United Kingdom
- Germany
- France
- Italy
- Spain
- Rest of Europe
- Asia-Pacific
- China
- Japan
- India
- Singapore
- Australia
- Malaysia
- Rest of Asia-Pacific
- South America
- Brazil
- Chile
- Argentina
- Rest of South America
- Middle East and Africa
- Middle East
- United Arab Emirates
- Saudi Arabia
- Turkey
- Rest of Middle East
- Africa
- South Africa
- Nigeria
- Rest of Africa
- Middle East
- North America
Data Sources, Market Sizing, and Validation
Desk Research
Desk research was used to set the market perimeter and to build the initial demand story around how data centers are getting modernized. We relied on public sources such as the U.S. Energy Information Administration for electricity use context, NIST publications for virtualization and cloud building blocks, and International Telecommunication Union materials for network readiness indicators that influence software-defined adoption.
We also used macro indicators from World Bank and OECD digital economy statistics to normalize demand drivers, along with company filings, investor presentations, and credible press to track product direction, pricing signals, and partner ecosystems. Where needed, paid subscriptions for company financials and a separate patent database were referenced to validate revenue exposure and technology activity patterns. These examples are not exhaustive, and we consulted additional public and paid sources for data collection, validation, and clarification.
Primary Interviews and Surveys
Primary work focused on interviews and short surveys with data center operators, cloud and colocation buyers, and channel partners who influence platform selection and renewal decisions. We also spoke with technical and commercial roles across North America, Europe, and Asia-Pacific, so regional buying patterns, bundling practices, and migration timing could be cross-checked before finalizing the model.
Distribution of primary research fieldwork respondents
| Company type | Respondent position | Region |
|---|---|---|
| Top tier: 36% | CXOs: 18% | APAC: 48% |
| Mid tier: 42% | Functional/Unit leaders: 24% | EMEA: 30% |
| Smaller Players: 22% | Managers: 58% | Americas: 22% |
Market-Sizing & Forecasting
Sizing starts with a top-down build where the addressable pool is reconstructed from enterprise and service-provider data center software spending, then filtered by the share tied to virtualization, orchestration, and software-defined control layers. To keep the totals realistic, we corroborate results with selective bottom-up checks, such as sampled license or subscription price ranges multiplied by estimated deployments, and channel feedback on attach rates for enablement services.
Inputs used in the model include data center capacity additions and utilization direction, virtualization penetration and refresh cycles, share of workloads moving to hybrid models, typical software subscription term lengths, and observed price progression for platform bundles. For forecasting, we use scenario analysis to stress-test adoption speed under different capex climates, automation maturity levels, and regulatory or security-driven modernization needs, and then select a central case based on what primary respondents view as most likely. When a bottom-up signal is missing for smaller regions or edge deployments, we fill gaps using proxy indicators such as capacity growth and buyer intent timing, then adjust after interview validation.
Data Validation & Update Cycle
Model outputs are checked against independent signals, including data center build activity, virtualization and cloud infrastructure adoption trends, and reported software platform revenue exposure in public filings. We review variances in steps, starting with unit and currency sanity checks, then assumption review, and then peer review by another analyst before sign-off.
The work is refreshed once a year so base-year inputs, pricing logic, and adoption curves stay current, and interim updates are made if a material event changes demand expectations. If a large variance appears during refresh, we re-contact respondents to confirm whether it is driven by bundling shifts, delayed projects, or a broader change in buying behavior.
Mordor Intelligence's Software Defined Data Center Market Size Measured Against Other Published Estimates
Published market numbers for software-defined data centers often vary because each publisher draws the line differently on what is counted as SDDC revenue, and they also use different base years and growth assumptions. Differences show up quickly when one estimate leans more on vendor roadmap narratives, while another leans more on buyer spend patterns and renewal timing.
The biggest gap drivers usually come from whether hardware and facilities costs are blended into the total, how internal hyperscaler tooling is treated, and how pricing is converted across regions and contract terms. The table shows that excluding physical infrastructure spend and counting only commercial control-layer licensing, subscriptions, and enablement services narrows the size to what is actually purchased as SDDC, which is the approach followed by Mordor Intelligence.
Benchmark comparison
| Source | Market Size | Gaps in Research Methodology |
|---|---|---|
| Mordor Intelligence | USD 92.09 B (2026) | |
| Global Research Publisher A | USD 92.46 B (2025) | Uses a 2025 base year and appears to apply a broader solution scope, which can pull in adjacent infrastructure spend and different pricing timing versus subscription term normalization. |
| Industry Research Publisher B | USD 82.77 B (2025) | Relies on a 2025 base year with a different demand curve and scope interpretation by type and component, which can shift totals if services and internal-use tooling are handled differently. |
Overall, the spread is mainly explained by base-year selection and what gets included beyond the control software layer. By tying the model to observable data center capacity signals, commercialization rules, and interview-validated pricing behavior, the estimate stays repeatable and easier to reconcile during updates.


Key Questions Answered in the Report
What is the current Software Defined Data Center Market size?
The Software Defined Data Center Market is projected to register a CAGR of 25.78% during the forecast period (2026-2031)
Who are the key players in Software Defined Data Center Market?
Microsoft Corporation, Hewlett Packard Enterprise Company, Oracle Corporation, Cisco Systems and VMware Inc. are the major companies operating in the Software Defined Data Center Market.
Which is the fastest growing region in Software Defined Data Center Market?
Asia Pacific is estimated to grow at the highest CAGR over the forecast period (2026-2031).
Which region has the biggest share in Software Defined Data Center Market?
In 2025, the North America accounts for the largest market share in Software Defined Data Center Market.
What years does this Software Defined Data Center Market cover?
The report covers the Software Defined Data Center Market historical market size for years: 2019, 2020, 2021, 2022, 2023 and 2024. The report also forecasts the Software Defined Data Center Market size for years: 2026, 2027, 2028, 2029, 2030 and 2031.
Page last updated on:
- Data Center Server Market Servers worldwide, split by tier, facility size and facility type.
- Data Center Construction Market Global construction demand, split by tier, facility size and facility type.
- Artificial Intelligence (AI) Data Center Market AI facilities worldwide, split by facility type, component and tier.
- Micro Mobile Data Center Market Global micro mobile units demand, split by rack unit size, form factor and application.
- Data Center Switch Market Switches across all regions, split by switch type, bandwidth class and switching technology.
- Data Center Interconnect Market Global interconnect demand, split by facility size and tier.
- Europe Data Center Storage Market Storage in Europe, split by storage technology, storage type and end user.
- Japan Data Center Networking Market Japan networking, split by component.
- Indonesia Data Center Networking Market Networking in Indonesia, split by component, end-user and data-center type.
- Modular Data Center Market Global modular builds demand, split by solution and services, application and build type.
- France Data Center Networking Market France's networking, split by component.
- Italy Data Center Power Market Power systems in Italy, split by component, facility type and facility size.
- China Data Center SSD Market SSDs in China, split by form factor, interface and nand technology.
- Europe Data Center Interconnect Market Interconnect in Europe, split by facility size and tier.





