SNP Genotyping Market Size and Share
Market Overview
| Study Period | 2023 - 2031 |
|---|---|
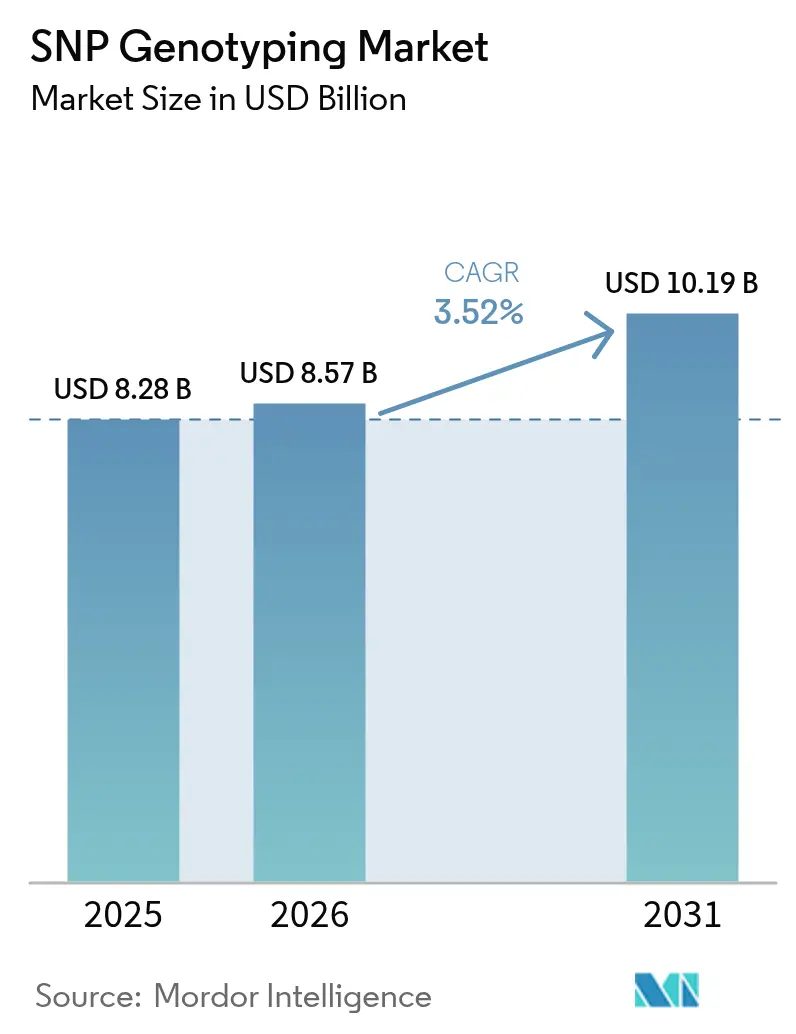
| Market Size (2026) | USD 8.57 Billion |
| Market Size (2031) | USD 10.19 Billion |
| Growth Rate (2026 - 2031) | 3.52% CAGR |
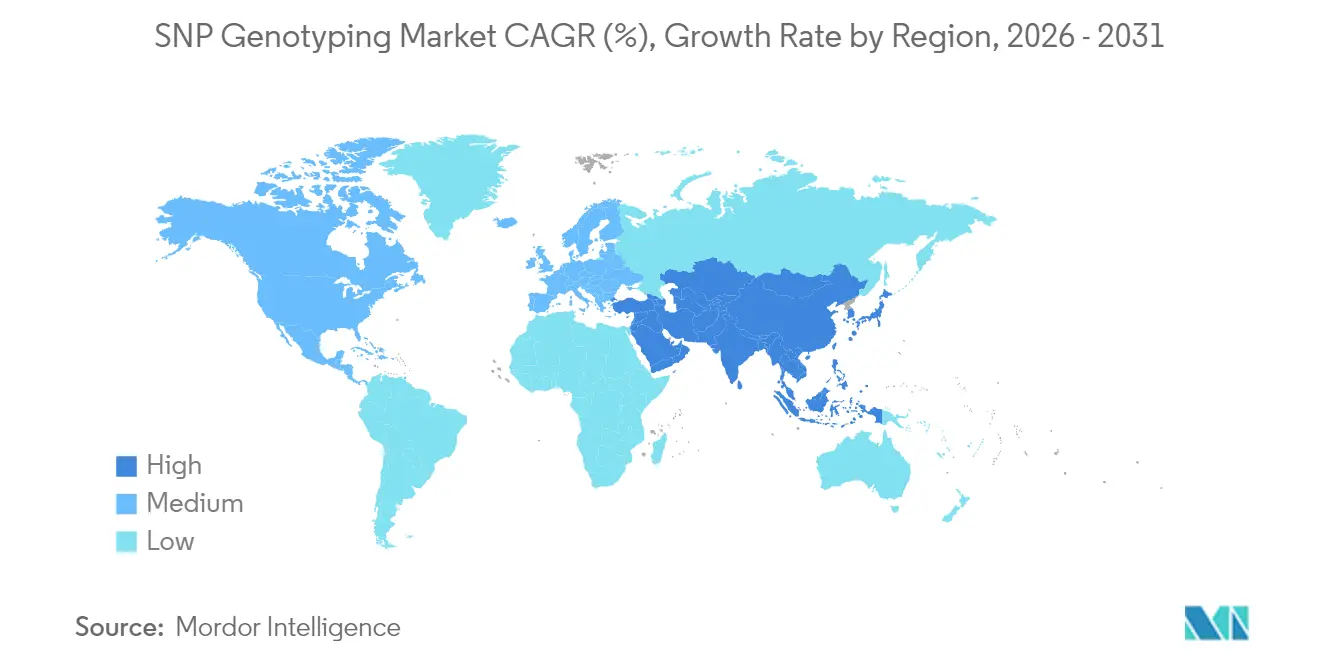
| Fastest Growing Market | Asia Pacific |
| Largest Market | North America |
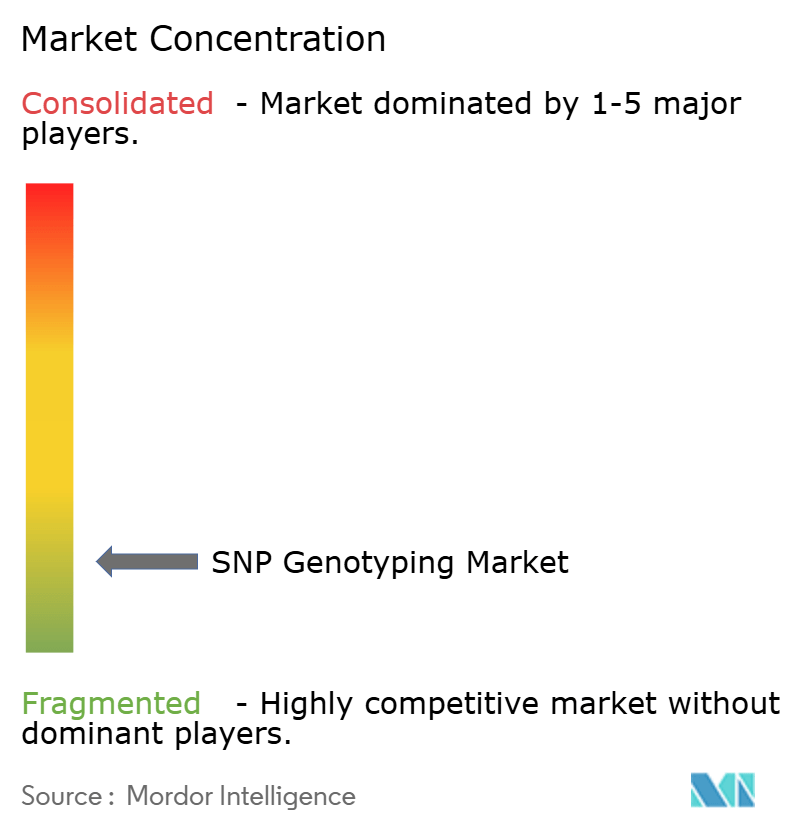
| Market Concentration | Low |
Major Players *Disclaimer: Major Players sorted in no particular order Image © Mordor Intelligence. Reuse requires attribution under CC BY 4.0. | |
SNP Genotyping Market Analysis by Mordor Intelligence
The SNP genotyping market size in 2026 is estimated at USD 8.57 billion, growing from 2025 value of USD 8.28 billion with 2031 projections showing USD 10.19 billion, growing at 3.52% CAGR over 2026-2031. Falling next-generation sequencing (NGS) costs, wider adoption of companion diagnostics, and government-backed population genomics projects underpin this measured expansion. The steady growth signals a maturing competitive environment in which platform innovation, cloud analytics, and AI-enabled automation provide differentiation levers. Pharma demand is rising as more than 30 active collaborations link drug pipelines to high-throughput SNP panels, while agrigenomics and direct-to-consumer (DTC) wellness tests diversify revenue streams. However, persistent bioinformatics talent shortages and evolving privacy regulations temper short-term upside.
Key Report Takeaways
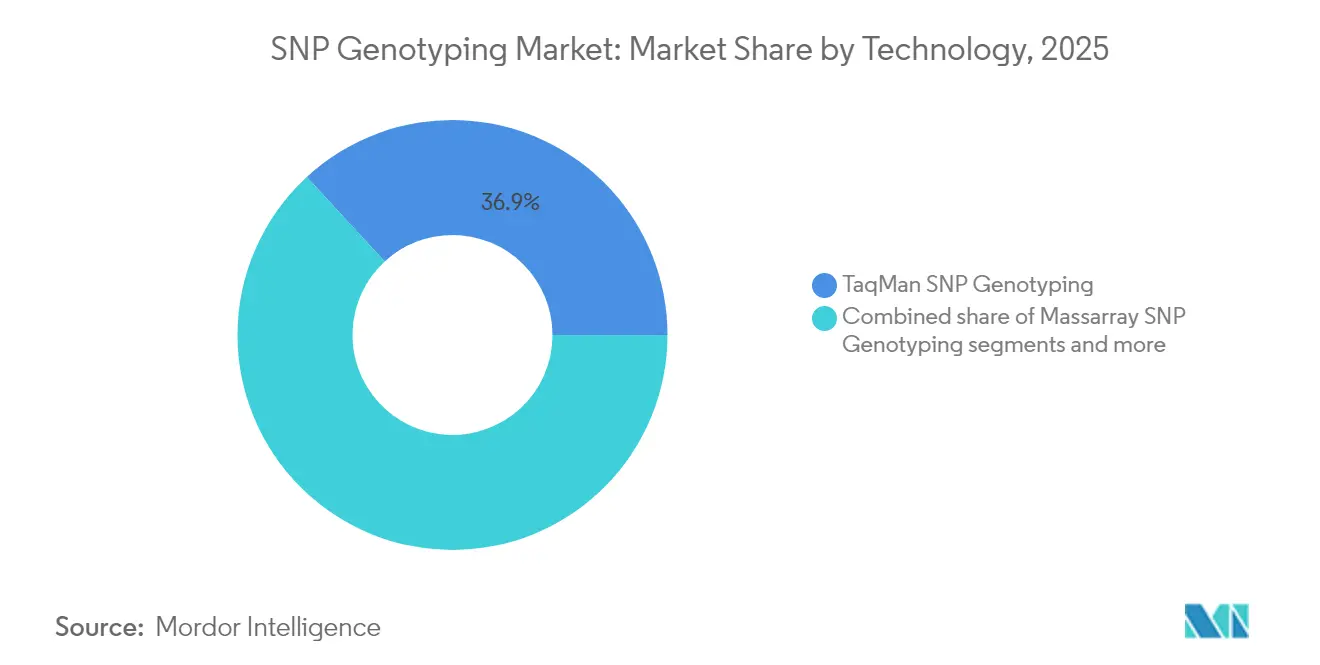
- By technology, TaqMan captured 36.85% of SNP genotyping market share in 2025, whereas other technologies are advancing at a 4.08% CAGR through 2031.
- By product type, reagents & kits commanded 32.78% share of the SNP genotyping market size in 2025, while software & services are projected to expand at a 3.74% CAGR between 2026-2031.
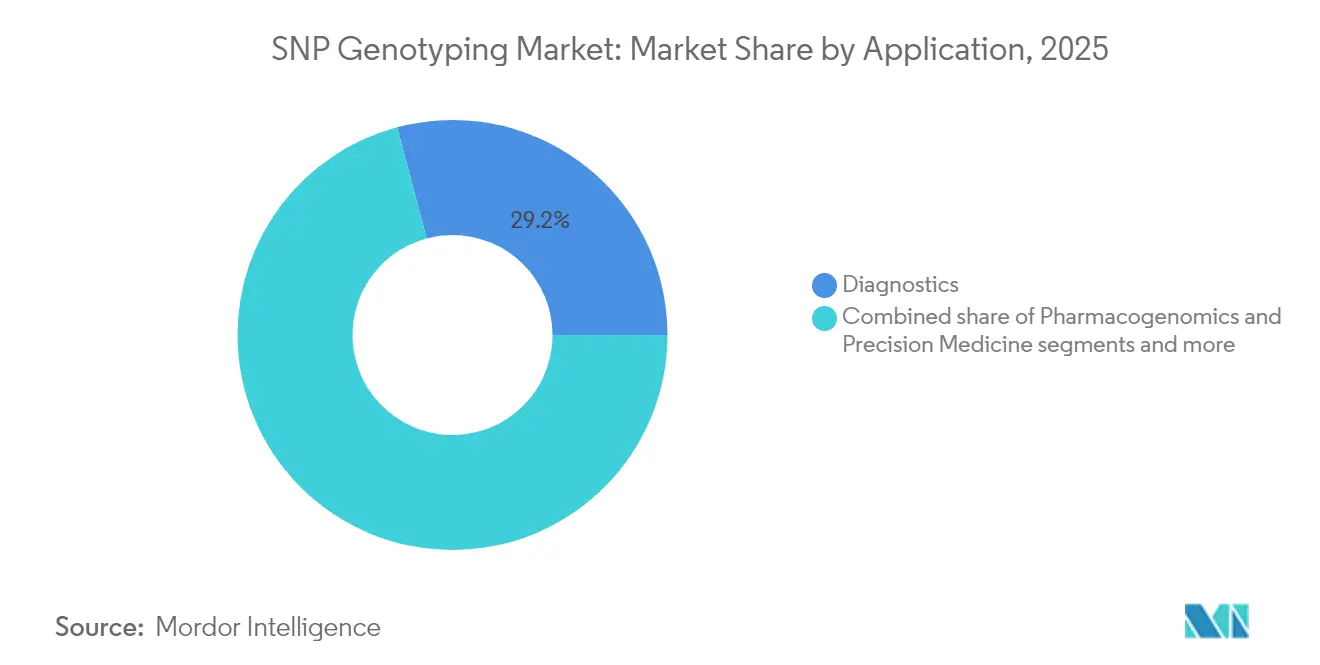
- By application, diagnostics yielded a 29.15% share of the SNP genotyping market size in 2025 and pharmacogenomics & precision medicine is progressing at a 3.79% CAGR through 2031.
- By end user, pharmaceutical & biotechnology companies held 35.10% of SNP genotyping market share in 2025; contract research organizations are set to grow fastest at 4.43% CAGR to 2031.
- By geography, North America led with 38.74% revenue share in 2025, whereas Asia-Pacific is poised for the quickest 3.98% CAGR to 2031.
Note: Market size and forecast figures in this report are generated using Mordor Intelligence’s proprietary estimation framework, updated with the latest available data and insights as of 2026.
Global SNP Genotyping Market Trends and Insights
Driver Impact Analysis*
| Driver | (~) % Impact on CAGR Forecast | Geographic Relevance | Impact Timeline |
|---|---|---|---|
| Falling NGS Costs & Throughput Explosion | +0.8% | Global, with strongest impact in APAC and emerging markets | Short term (≤ 2 years) |
| Pharmaceutical Pivot to Companion Diagnostics | +0.7% | North America & EU primary, expanding to APAC | Medium term (2-4 years) |
| Agrigenomics Demand for Climate-Resilient Crops | +0.4% | Global, concentrated in agricultural regions | Long term (≥ 4 years) |
| Growing DTC Wellness Genotyping Kits | +0.3% | North America & EU, emerging in APAC | Medium term (2-4 years) |
| AI-enabled Ultra-High-Throughput Microfluidics | +0.2% | Global, led by technology hubs | Long term (≥ 4 years) |
| Cloud-based Secure Genomic Data Marketplaces | +0.2% | Global, regulatory compliance dependent | Medium term (2-4 years) |
| Source: Mordor Intelligence | |||
Falling NGS Costs & Throughput Explosion
Surface-coating and roll-to-roll fluidics now deliver whole-genome reads for USD 15, a drop of 98% from 2020 levels, broadening access for population studies and low-resource clinics. Illumina’s NovaSeq X exemplifies the trend by pushing per-sample economics below array prices and forecasting high single-digit revenue growth through 2027. Higher lane density allows millions of SNPs to be screened in parallel, while miniaturized library prep cuts consumable spend and sample input requirements. Academic centers formerly constrained by capital budgets can now run large cohorts, accelerating discovery timelines. The cost curve therefore tilts adoption toward sequencing-based SNP genotyping and away from fixed arrays.
Pharmaceutical Pivot to Companion Diagnostics
More than 30 companion-diagnostic alliances now channel pharma investment into high-accuracy SNP panels that guide dosing and therapy selection. FDA backing for broad assays such as FoundationOne CDx, which covers 324 genes, validates multi-biomarker strategies reliant on SNP calls. Real-time platforms integrated into clinical workflows shorten eligibility decisions from days to hours, supporting same-visit prescriptions in oncology and chronic disease care. Successful precedents like Herceptin and Gleevec reinforce the commercial logic and encourage pipeline drugs to embed genotyping from Phase II onward. As pharmacogenomics shifts from research to routine, laboratory throughput, regulatory compliance, and turnaround time become decisive purchase criteria.
Agrigenomics Demand for Climate-Resilient Crops
Extreme weather raises the premium on drought-, heat-, and pest-tolerant cultivars; SNP genotyping underpins marker-assisted selection and genomic prediction in breeding pipelines. CRISPR editing coupled with SNP-identified loci accelerates trait introgression in maize, wheat, and rice, cutting variety-development cycles by two years. Recent wheat studies mapped 12 loci governing pre-harvest sprouting resistance and explained up to 10% of phenotypic variance, illustrating tangible breeding gains. Multiplex KASP assays further lower cost per data point, driving small-holder adoption in Asia and Africa. Long-term funding through initiatives such as the Agricultural Genome to Phenome program locks in sustained reagent demand.
Growing DTC Wellness Genotyping Kits
Consumer interest in nutrition, fitness, and preventive health pushes the global DTC segment past USD 4 billion by 2025. South Korea expanded permissible wellness loci from 12 to 70, showing how regulation can unlock consumer markets while reserving clinical claims for physicians. Pharma also values the data; Regeneron’s USD 256 million buyout of 23andMe’s assets underscores the monetization of large-scale SNP databases for target discovery. Employer-sponsored wellness programs add a B2B channel, though privacy concerns require stringent consent and encryption protocols. Higher sample volumes feed the consumables cycle and introduce new user segments to precision medicine concepts.
Restraint Impact Analysis*
| Restraint | (~) % Impact on CAGR Forecast | Geographic Relevance | Impact Timeline |
|---|---|---|---|
| Shortage of Qualified Bioinformaticians | -0.6% | Global, most acute in emerging markets | Medium term (2-4 years) |
| Regulatory Patchwork on Genetic Data Privacy | -0.4% | EU & North America primary, expanding globally | Long term (≥ 4 years) |
| Patent Thickets around Probe Chemistries | -0.3% | Global, concentrated in developed markets | Long term (≥ 4 years) |
| Supply-chain Risk for Rare Earth Fluorophores | -0.2% | Global, Asia-Pacific supply concentration | Short term (≤ 2 years) |
| Source: Mordor Intelligence | |||
Shortage of Qualified Bioinformaticians
Eighty-two percent of genomics firms report difficulty hiring data scientists who can unify AI, statistics, and molecular biology skills. Rapid output from high-throughput platforms overwhelms existing analysis pipelines, forcing labs to outsource or delay projects. Limited academic seats in computational genomics prolong the gap, while salary inflation hits smaller firms hardest. Emerging markets feel the pinch most acutely, restricting local uptake even where instrument costs fall. Over the medium term, reskilling programs and cloud automation will ease but not eliminate the constraint.
Regulatory Patchwork on Genetic Data Privacy
GDPR classifies genetic data as sensitive, requiring explicit consent and limiting secondary uses; member-state add-ons further complicate compliance. In the U.S., HIPAA’s minimum-necessary rule plus state-level statutes like CCPA raise additional hurdles for cross-border cloud storage. NIST’s evolving cybersecurity frameworks reflect persistent re-identification risks with fewer than 100 SNPs, mandating continuous risk assessment. Fragmentation inflates legal costs, slows multinational studies, and favors vendors with robust compliance toolkits. Long-term harmonization remains uncertain, dampening the SNP genotyping market’s expansion into fully global data exchanges.
*Our forecasts treat driver/restraint impacts as directional, not additive. The impact forecasts reflect baseline growth, mix effects, and variable interactions.
Segment Analysis
By Technology: TaqMan Holds Ground while AI Platforms Accelerate
TaqMan captured 36.85% of SNP genotyping market share in 2025 through established real-time PCR accuracy and validated probe chemistries suited for regulated diagnostics. AI-enabled microfluidic systems now challenge that dominance, posting 4.08% CAGR as they automate single-cell handling at 98% identification precision. MassARRAY sustains usage in high-sample academic screens, though its growth plateaus as sequencing costs compress.
Early adopters exploit machine-learning-guided PCR conditions to improve forensic results from degraded DNA, expanding utility beyond pristine samples. Patent barriers around probe designs insulate incumbents, yet novel multivalent binding chemistries hint at future breakthroughs. As AI integration deepens, purchasing decisions pivot on throughput gains and workflow automation rather than raw chemistry alone.


By Product Type: Consumables Lead; Software & Services Climb
Reagents & kits represented 32.78% of revenue in 2025, underscoring a consumables-driven model that delivers 88% of top vendors’ sales and anchors recurring cash flows. Software & services are the fastest-growing slice at 3.74% CAGR as cloud-native analytics platforms unlock multi-omics integration and regulatory-grade audit trails.
Instrument upgrades proceed on five-year cycles, keeping hardware sales steady but subdued. Meanwhile, automated library prep stations mitigate contamination risk and standardize results, adding pull-through for consumables. Compliance features such as ISO 27001 alignment within Connected Analytics strengthen vendor lock-in for enterprise users.
By Application: Diagnostics Dominate; Pharmacogenomics Gains Pace
Diagnostics commanded 29.15% of SNP genotyping market size in 2025, driven by reimbursed tests for oncology, cardiology, and rare disease risk. Pharmacogenomics & precision medicine is rising fastest at 3.79% CAGR as payers recognize value in genotype-guided dosing that reduces adverse events.
Agrigenomics remains a stable niche benefiting from food-security funding, while forensics adopts high-sensitivity panels to solve cold cases. Drug discovery workflows ingest population-scale SNP datasets to stratify clinical trials and predict responder subgroups, sustaining service revenues for contract labs.
By End User: Pharma Leads; CROs Expand Rapidly
Pharmaceutical & biotechnology companies held 35.10% revenue share in 2025, reflecting internal pipeline needs and regulatory submission requirements. Yet contract research organizations (CROs) are set for the swiftest 4.43% CAGR as outsourcing accelerates post-pandemic and U.S. restrictions redirect work away from Chinese providers toward India and Europe.
Academic centers pursue population studies funded by regional genomics initiatives, while clinical labs adapt to FDA’s phased oversight of laboratory-developed tests, investing in compliance upgrades that favor platform standardization.
Geography Analysis
North America’s 38.74% share stems from entrenched R&D spending, reimbursement pathways, and regulatory clarity exemplified by the 2024 LDT rule that phases in premarket reviews over four years. Illumina and Thermo Fisher collectively reported more than USD 15 billion in 2024 genetics-related revenue, reinforcing a deep domestic supply chain.
Asia-Pacific posts the fastest 3.98% CAGR through 2031 as China’s USD 9 billion precision-medicine program and India’s Genome India Project seed vast cohort studies. Cost advantages and skilled talent pools attract outsourced sequencing workloads amid U.S.-China tensions, giving regional CROs a tailwind.
Europe grows steadily on the back of academic consortia and national health service pilots, though GDPR compliance overhead tempers momentum. Oxford Nanopore’s emergence and a 142-company genomic startup base demonstrate a vibrant, if regulation-heavy, ecosystem.

Competitive Landscape
Moderate consolidation prevails: the top five vendors account for an estimated half of revenue, led by Illumina’s USD 4.33 billion sequencing franchise. Incumbents protect share through end-to-end platforms, broad intellectual-property estates, and companion-diagnostic alliances with big pharma.
AI-enabled microfluidic startups target workflow automation and cost disruption, while cloud marketplaces for de-identified genomic data open alternative revenue models. Regulatory rigor becomes a strategic moat; FDA’s 2024 warning to Agena Bioscience illustrates the compliance stakes. The U.S. Biosecure Act shifts demand toward non-Chinese vendors, reshaping global supply dynamics.
IP filings around multivalent probes and enzymatic chemistries hint at future leapfrogs. Meanwhile, ecosystem partnerships such as Labcorp-Ultima Genomics tighten integration between diagnostics providers and platform innovators.
SNP Genotyping Industry Leaders
Thermo Fisher Scientific Inc.
Agilent Technologies
Bio-Rad Laboratories Inc.
Illumina Inc.
LGC Group
- *Disclaimer: Major Players sorted in no particular order

Recent Industry Developments
- May 2025: Regeneron acquired 23andMe assets for USD 256 million to bolster genetics-based drug discovery.
- January 2025: Thermo Fisher announced Q4 2024 revenue of USD 11.40 billion and launched the MagMAX Sequential DNA/RNA kit for SNP workflows.


Global SNP Genotyping Market Report Scope
As per the scope of the report, single-nucleotide polymorphism (SNP) refers to mutations found at a specific locus or single base-pair mutation containing two alleles. SNPs aid in understanding the correlations between the genotype and behavior indicated by all living organisms. The SNP genotyping market is segmented by technology, usage and geography. By technology, the market is segmented into TaqMan SNP genotyping, massarray SNP genotyping, SNP GeneChip arrays, and other technologies. Other technologies include SNP Pyrosequencing, Real-time PCR-based SNP Genotyping and others. By usage, the market is segmented into pharmacogenomics and diagnostic field. By geography, the market is segmented into North America, Europe, Asia-Pacific, Middle-East and Africa, and South America. For each segment, the market size is provided in terms of USD value.
| TaqMan SNP Genotyping |
| Massarray SNP Genotyping |
| SNP GeneChip Arrays |
| Other Technologies |
| Instruments & Workstations |
| Reagents & Kits |
| Software & Services |
| Diagnostics |
| Pharmacogenomics & Precision Medicine |
| Agriculture & Animal Genetics |
| Forensics |
| Drug Discovery & Development |
| Pharmaceutical & Biotechnology Companies |
| Academic & Research Institutes |
| Contract Research Organizations |
| Clinical & Diagnostic Laboratories |
| North America | United States |
| Canada | |
| Mexico | |
| Europe | Germany |
| United Kingdom | |
| France | |
| Italy | |
| Spain | |
| Rest of Europe | |
| Asia-Pacific | China |
| India | |
| Japan | |
| South Korea | |
| Australia | |
| Rest of Asia-Pacific | |
| South America | Brazil |
| Argentina | |
| Rest of South America | |
| Middle East and Africa | GCC |
| South Africa | |
| Rest of Middle East and Africa |
| By Technology (Value) | TaqMan SNP Genotyping | |
| Massarray SNP Genotyping | ||
| SNP GeneChip Arrays | ||
| Other Technologies | ||
| By Product Type (Value) | Instruments & Workstations | |
| Reagents & Kits | ||
| Software & Services | ||
| By Application (Value) | Diagnostics | |
| Pharmacogenomics & Precision Medicine | ||
| Agriculture & Animal Genetics | ||
| Forensics | ||
| Drug Discovery & Development | ||
| By End User (Value) | Pharmaceutical & Biotechnology Companies | |
| Academic & Research Institutes | ||
| Contract Research Organizations | ||
| Clinical & Diagnostic Laboratories | ||
| By Geography (Value) | North America | United States |
| Canada | ||
| Mexico | ||
| Europe | Germany | |
| United Kingdom | ||
| France | ||
| Italy | ||
| Spain | ||
| Rest of Europe | ||
| Asia-Pacific | China | |
| India | ||
| Japan | ||
| South Korea | ||
| Australia | ||
| Rest of Asia-Pacific | ||
| South America | Brazil | |
| Argentina | ||
| Rest of South America | ||
| Middle East and Africa | GCC | |
| South Africa | ||
| Rest of Middle East and Africa | ||


Key Questions Answered in the Report
How big is the SNP Genotyping Market?
The SNP Genotyping Market size is expected to reach USD 8.57 billion in 2026 and grow at a CAGR of 3.52% to reach USD 10.19 billion by 2031.
What is the current SNP Genotyping Market size?
In 2026, the SNP Genotyping Market size is expected to reach USD 8.57 billion.
Who are the key players in SNP Genotyping Market?
Thermo Fisher Scientific Inc., Agilent Technologies, Bio-Rad Laboratories Inc., Illumina Inc. and LGC Group are the major companies operating in the SNP Genotyping Market.
Which is the fastest growing region in SNP Genotyping Market?
Asia Pacific is estimated to grow at the highest CAGR over the forecast period (2026-2031).
Which region has the biggest share in SNP Genotyping Market?
In 2025, the North America accounts for the largest market share in SNP Genotyping Market.
What years does this SNP Genotyping Market cover, and what was the market size in 2025?
In 2025, the SNP Genotyping Market size was estimated at USD 8.57 billion. The report covers the SNP Genotyping Market historical market size for years: 2022, 2023 and 2024. The report also forecasts the SNP Genotyping Market size for years: 2026, 2027, 2028, 2029, 2030 and 2031.
Page last updated on:


