X-Ray Detectors Market Size and Share
Market Overview
| Study Period | 2020 - 2031 |
|---|---|
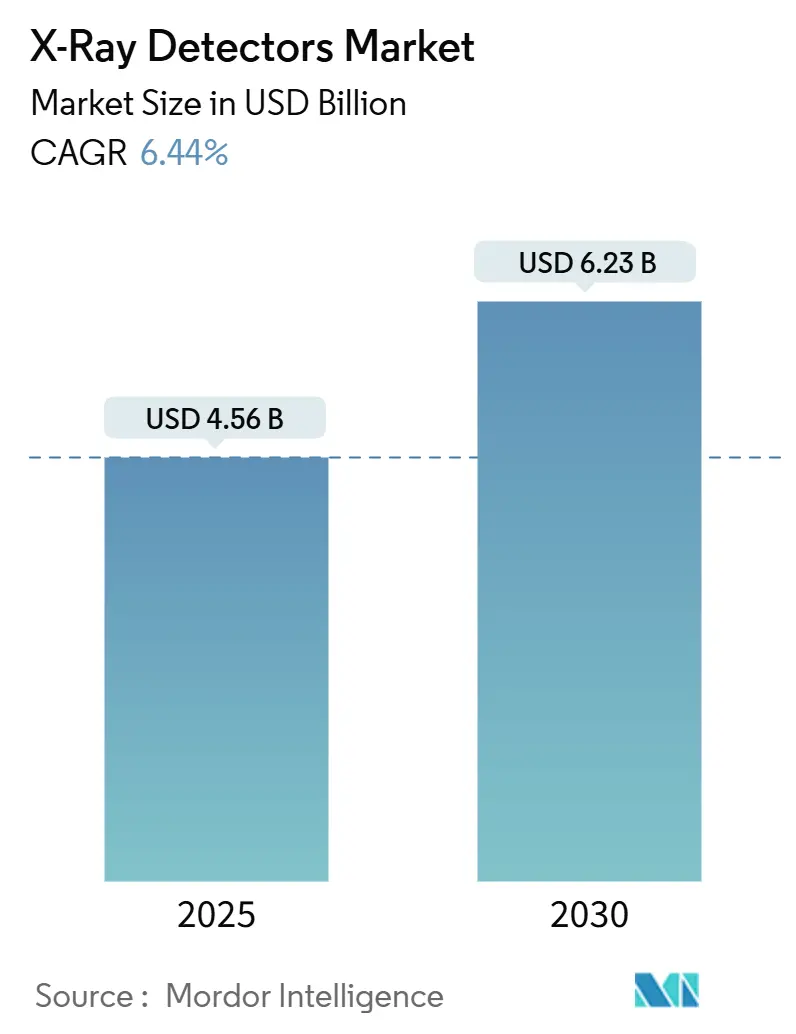
| Market Size (2026) | USD 4.56 Billion |
| Market Size (2031) | USD 6.23 Billion |
| Growth Rate (2025 - 2030) | 6.44% CAGR |
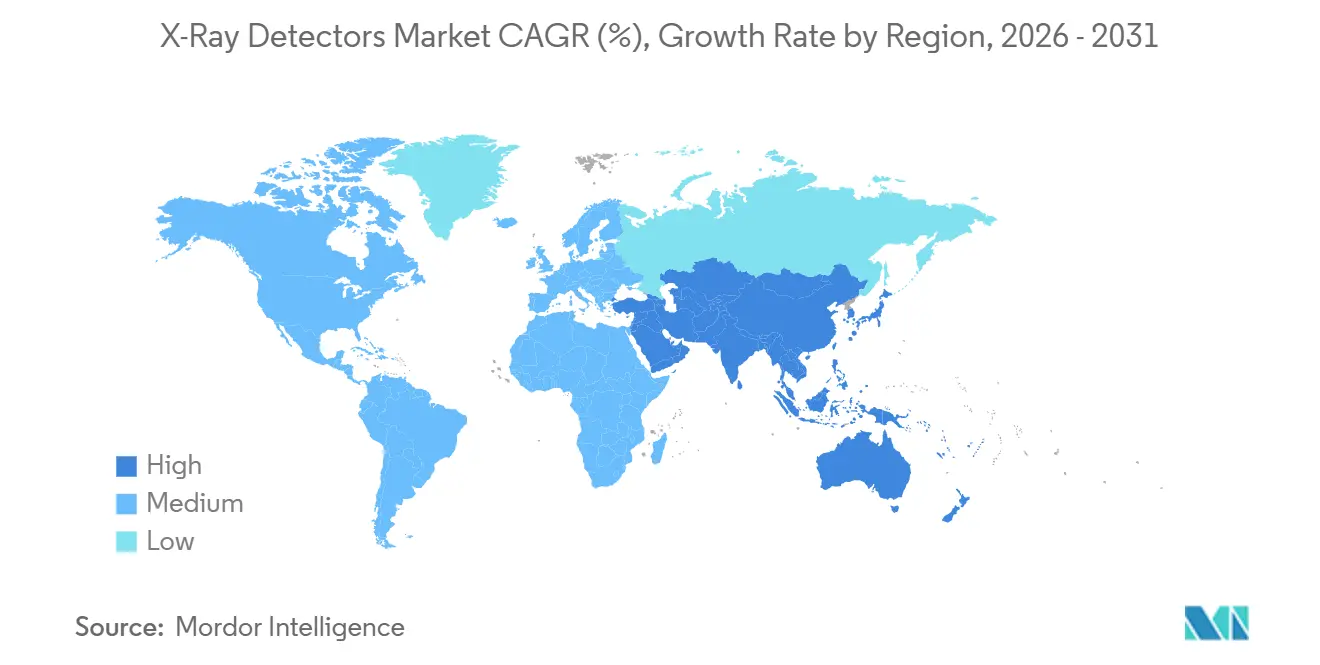
| Fastest Growing Market | Asia Pacific |
| Largest Market | North America |
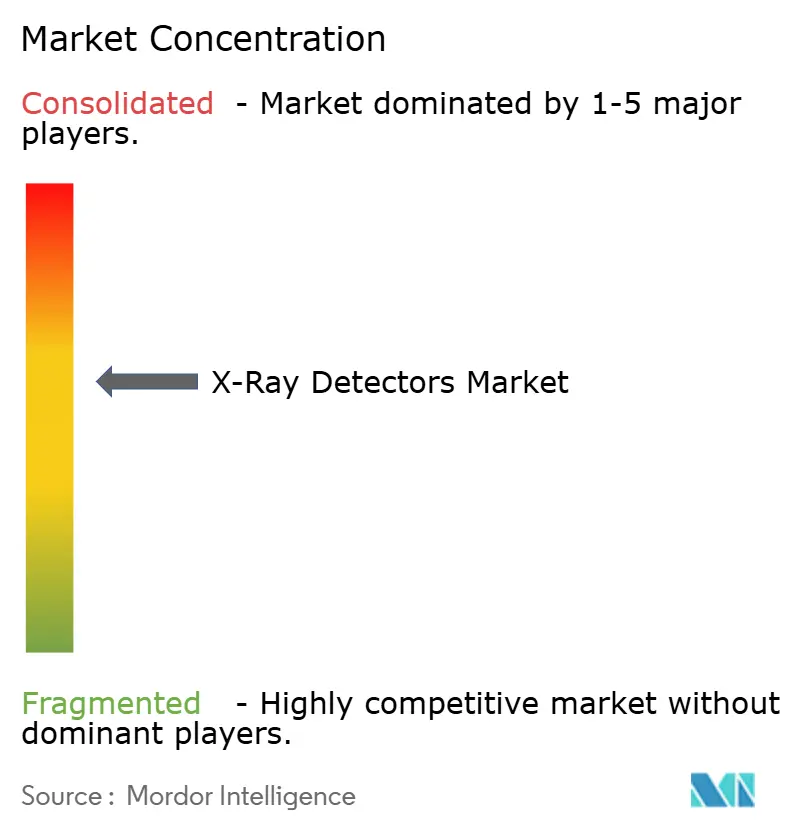
| Market Concentration | Medium |
Major Players *Disclaimer: Major Players sorted in no particular order Image © Mordor Intelligence. Reuse requires attribution under CC BY 4.0. | |
X-Ray Detectors Market Analysis by Mordor Intelligence
The X-ray detectors market size is valued at USD 4.56 billion in 2026 and is projected to reach USD 6.23 billion by 2031, advancing at a 6.44% CAGR. Demand concentrates around direct-conversion flat panel technology, point-of-care portability, and semiconductor localization programs that shorten lead times for amorphous selenium and cadmium telluride substrates. Hospitals prioritize dose-efficient detectors that align with Image Gently campaigns, while emergency departments accelerate the adoption of wireless technology to reduce patient transport. Governments in India, the United States, and the European Union link chip-fabrication incentives to medical device self-sufficiency, thereby strengthening supply security. Competitive dynamics hinge on vertical integration, AI-ready firmware, and cybersecurity certification as vendors defend margins against lower-priced Asian entrants.
Key Report Takeaways
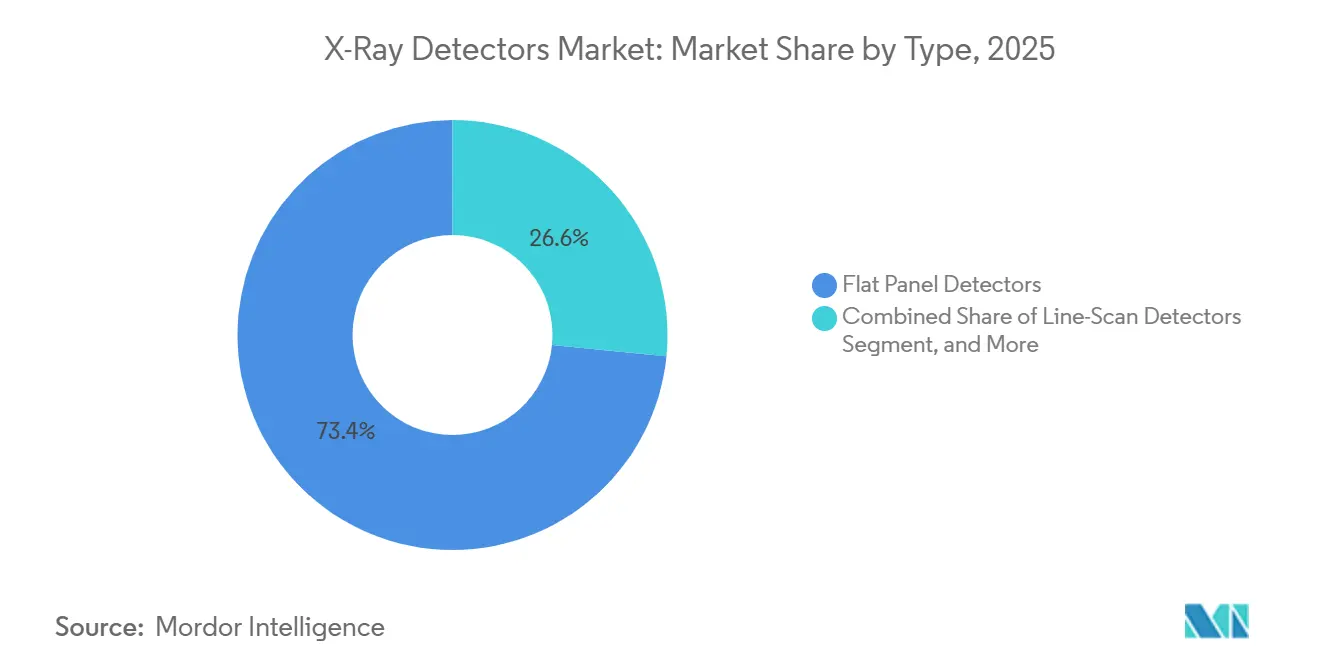
- By type, flat panel detectors commanded 73.42% revenue share in 2025, and direct flat panel units are forecast to expand at a 7.49% CAGR through 2031.
- By portability, fixed panels held 62.38% of 2025 demand, while portable panels are projected to post a 6.83% CAGR to 2031.
- By application, medical imaging contributed 68.13% of revenue in 2025, and veterinary imaging is projected to grow at a 7.61% CAGR over the forecast period.
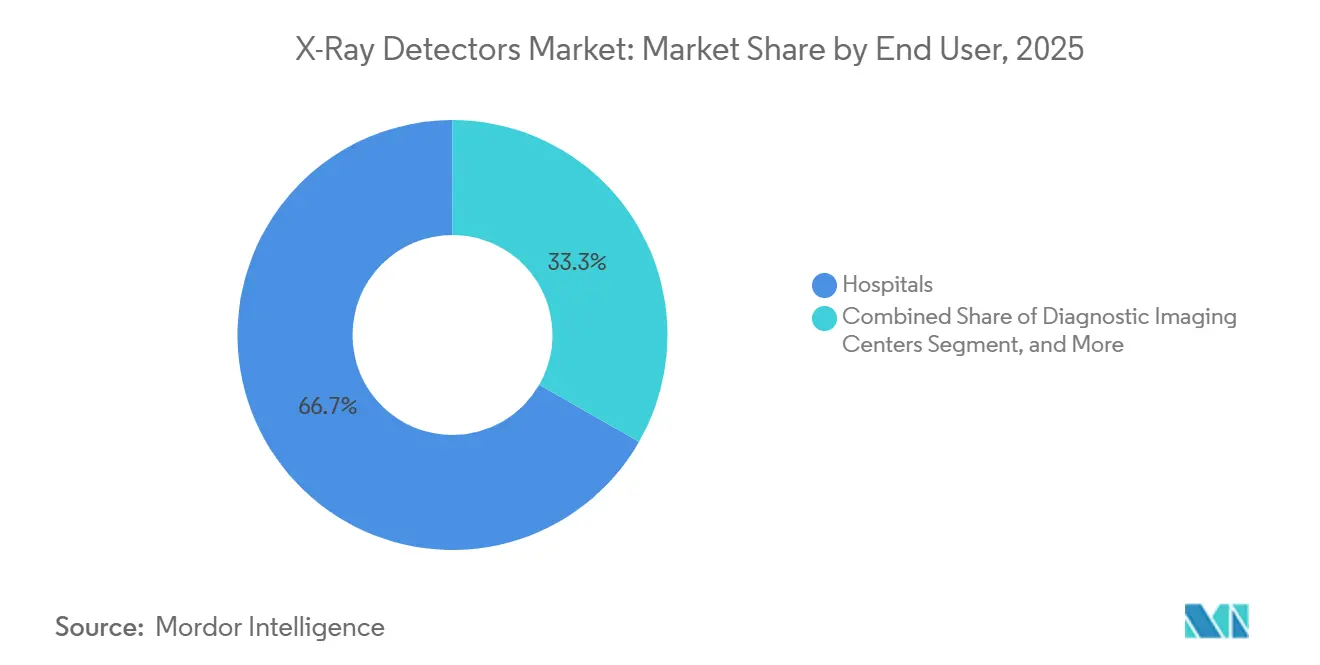
- By end user, hospitals generated 66.73% of 2025 sales, whereas diagnostic imaging centers are expected to grow at a 7.69% CAGR.
- By panel size, large-area formats captured a 56.71% share in 2025, and small-area detectors are expected to grow fastest at a 6.96% CAGR.
- By geography, North America led with 38.92% of the 2025 revenue, and the Asia-Pacific region is likely to advance at a 7.41% CAGR.
Note: Market size and forecast figures in this report are generated using Mordor Intelligence’s proprietary estimation framework, updated with the latest available data and insights as of January 2026.
Global X-Ray Detectors Market Trends and Insights
Drivers Impact Analysis*
| Driver | (~) % Impact on CAGR Forecast | Geographic Relevance | Impact Timeline |
|---|---|---|---|
| Rising Adoption of Direct-Conversion Flat Panel Detectors | +2.1% | North America, Europe, urban Asia-Pacific tertiary hospitals | Medium term (2-4 years) |
| Rapid Expansion of Point-of-Care and Portable Imaging Demand | +1.4% | Emergency departments and ICUs worldwide | Short term (≤ 2 years) |
| Integration of AI-Enhanced Image Processing Workflows | +0.9% | North America and Europe leadership, Asia-Pacific follow-on | Medium term (2-4 years) |
| Growing Non-Destructive Testing Needs in EV and Aerospace Industries | +0.7% | China, South Korea, Germany, North America | Long term (≥ 4 years) |
| Government Reimbursements Favoring Digital Radiography Upgrades | +0.8% | United States, Europe, selected Asia-Pacific markets | Medium term (2-4 years) |
| Semiconductor Supply-Chain Localization Incentives | +0.5% | United States, European Union, India | Long term (≥ 4 years) |
| Source: Mordor Intelligence | |||
Rising Adoption of Direct-Conversion Flat Panel Detectors
Direct-conversion panels utilize amorphous selenium or cadmium telluride to directly convert X-ray photons into electrical charge, eliminating the scintillator layer that typically introduces 30-40% signal loss.[1]Agfa, “Agfa Launches New XF+ Digital Radiography Solution,” agfa.com Detective quantum efficiency exceeds 0.7 at 1 line pairs per millimeter (lp/mm), enabling a 20-25% dose reduction for chest radiography and orthopedic imaging. Hospitals now stipulate direct technology in 60% of tender documents because lower patient exposure aligns with global dose-reduction campaigns. Vendors differentiate themselves through pixel-pitch advances down to 150 µm and on-board 16-bit conversion, which boosts soft-tissue contrast. As semiconductor yield improves, panel pricing is falling into computed-radiography territory, accelerating replacement.
Rapid Expansion of Point-of-Care and Portable Imaging Demand
Emergency departments perform 40% of hospital radiographs; however, patient transfers can delay diagnosis and increase the risk of infection. Wireless panels under 3 kg now stream 14 × 17-inch images via 5 GHz Wi-Fi in under 4 seconds, enabling bedside studies without disconnecting life-support lines. WHO resolution WHA78.13 designated portable radiography as an essential device class, compelling ministries of health to budget for mobile fleets. Annual shipments therefore climb in double digits in Asia-Pacific field hospitals and U.S. critical-care wards. Lower capital cost relative to building fixed rooms broadens access in low-resource settings.
Integration of AI-Enhanced Image Processing Workflows
Convolutional neural networks embedded inside detector firmware now auto-center exposures, score image quality, and flag positioning errors within 2 seconds.[2]Integrating the Healthcare Enterprise, “AI Workflow for Imaging,” ihe.net Radiology departments document 40% technologist time savings and 15% fewer repeat exams. The American College of Radiology’s 2024 guidance requires monthly sensitivity checks to ensure algorithms remain accurate over time. Edge computing sidesteps latency and data-sovereignty concerns in Europe. AI readiness is quickly becoming a key evaluation criterion, favoring vendors with open APIs.
Growing Non-Destructive Testing Needs in EV and Aerospace Industries
Electric-vehicle battery plants inspect every weld to avert thermal runaway, driving demand for line-scan arrays that image 400 mm modules at 50 µm resolution in under 90 seconds.[3]Fraunhofer Institute EZRT, “XXL-CT,” ezrt.fraunhofer.de Aerospace primes insist on CT scanning of additively manufactured blades, prompting orders for 5m detector arcs capable of whole-airframe views. NASA’s 2024 phase-contrast breakthrough enhances composite delamination detection without the use of contrast agents, and technology transfer to equipment manufacturers is underway. Industrial throughput requirements are thus being synchronized with medical-grade image quality, thereby expanding the addressable opportunity.
Restraints Impact Analysis*
| Restraint | (~) % Impact on CAGR Forecast | Geographic Relevance | Impact Timeline |
|---|---|---|---|
| High Up-Front Cost of DR Systems and Service Contracts | -0.6% | Emerging markets and rural hospitals worldwide | Short term (≤ 2 years) |
| Complex Multi-Region Regulatory Compliance for Detector Materials | -0.4% | Global manufacturers selling into U.S., EU and China | Medium term (2-4 years) |
| Long Replacement Cycles in Hospital Radiography Suites | -0.3% | Mature installations in North America and Europe | Long term (≥ 4 years) |
| Escalating Cybersecurity Risks for Connected Detectors | -0.3% | North America and Europe under heightened scrutiny | Medium term (2-4 years) |
| Source: Mordor Intelligence | |||
High Up-Front Cost of DR Systems and Service Contracts
A full digital radiography room costs USD 150,000-300,000, which is triple the price of computed radiography. Annual service contracts add 8-12% to the total cost. Rural hospitals operating at a median margin of 1.5% defer upgrades for more than a decade. Reimbursement uplifts under the 2025 Outpatient Prospective Payment System trail equipment inflation, limiting ROI calculations. Capital-constrained facilities, therefore, cling to legacy phosphor plates despite higher doses and slower workflow.
Complex Multi-Region Regulatory Compliance for Detector Materials
Manufacturers must juggle FDA 510(k) pathways, EU Medical Device Regulation technical files, and China NMPA type testing, each with distinct labeling and safety documentation requirements. Parallel design histories lift non-recurring engineering costs by USD 0.2 million per model and stretch launch timelines by up to 12 months. Smaller innovators find the burden prohibitive, slowing technology diffusion in international markets.
*Our forecasts treat driver/restraint impacts as directional, not additive. The impact forecasts reflect baseline growth, mix effects, and variable interactions.
Segment Analysis
By Type: Direct-Conversion Flat Panels Move Center Stage
The X-ray detectors market share for flat panel technology reached 73.42% in 2025, and the segment is projected to grow at a 7.49% CAGR through 2031. Direct panels are gaining popularity because they suppress light scatter and achieve a modulation transfer function above 0.5 at 5 lp/mm. Indirect panels remain popular where budget constraints favor lower upfront cost, but advances in needle-structured cesium iodide are narrowing the quality gap. Computed radiography is projected to retreat at a 2.1% CAGR as film processing is eliminated from hospital budgets, although 18% of the installed base in low-income regions still relies on phosphor plates. Charge-coupled devices dominate niche dental channels, while line-scan arrays are growing in airport security installations that adopt dual-energy CT. Resilient demand across industrial and veterinary verticals keeps legacy formats profitable yet declining.
A steady pipeline of direct-conversion rollouts is recalibrating procurement economics. Vendors report that 55% of new flat panel orders now specify amorphous selenium photoconductors. Scaling yields and localized fabrication under the CHIPS Act are expected to reduce the direct panel cost per 14 × 17-inch unit to approximately USD 12,000 by 2028, thereby catalyzing uptake in community imaging centers. Meanwhile, indirect panels serve as a value tier for price-sensitive markets, with supplier roadmaps centered on thinner scintillators and AI-driven denoising to prolong their relevance.


By Portability: Wireless Mobility Takes Hold
Fixed systems retained 62.38% of 2025 sales; however, the portable category is tracking a 6.83% CAGR, thanks to gains in clinical workflow. Hospitals equipping ICUs with battery-powered detectors slash bedside exam turnaround from 45 minutes to under 10 minutes, freeing technologist capacity. The X-ray detectors market size for portable units is projected to expand by nearly USD 0.5 billion over the forecast horizon. Wireless protocols supporting 200 exposures per charge and sub-4-second image transfer meet radiologist expectations for real-time review. Veterinary clinics are adopting handheld panels at an 8.1% CAGR to avoid sedation during the imaging of anxious pets.
Fixed detectors still dominate high-throughput fluoroscopy suites where fiber connectivity ensures 30 fps acquisition, and large-area panels fulfill long-leg and full-spine requirements without stitching. Nevertheless, the WHO classification of mobile radiography as an essential device and donor-funded procurement in emerging economies is tilting incremental volume toward portable products, gradually eroding the share of fixed equipment.
By Application: Veterinary Imaging Registers the Fastest Rise
Medical imaging contributed 68.13% of 2025 revenue, anchored by 1.2 billion annual procedures. However, veterinary imaging is pacing the field with a 7.61% CAGR as global pet ownership climbs and insurance penetration rises to 25% in North America. Updated shielding rules require clinics to migrate from film, and flat-panel vendors bundle compact generators and software optimized for animal anatomy. Dental offices are migrating from film to digital intraoral sensors at a 5.9% CAGR, driven by instant readouts and reduced chemical waste.
Security screening accounts for 12% of current demand, driven by the deployment of dual-energy CT, which reduces false alarms by 35%. Industrial non-destructive testing adds a 6.9% CAGR tailwind as electric-vehicle battery lines and aerospace additive-manufacturing sites require 100% inspection. Other nascent uses, from food inspection to geological core analysis, evidence modest yet resilient uptake as image quality improves and detector pricing softens.
By End User: Outpatient Centers Outperform
Hospitals generated 66.73% of the 2025 turnover, but diagnostic imaging centers are expected to outstrip them, advancing at a 7.69% CAGR as payers redirect volume to lower-cost settings. X-ray detectors market size for outpatient centers is projected to swell by almost USD 0.7 billion through 2031 as reimbursement differentials widen. Specialty clinics, notably orthopedic and chiropractic offices, invest in in-house radiography to secure same-visit diagnosis. Industrial facilities sustain 11% of demand, driven by mandatory inspections in battery and aerospace assembly. Research institutes command a small but stable share through photon-counting upgrades for synchrotron and small-animal work.
Veterinary clinics represent only 3% of deliveries today, yet are expanding at an 8.1% CAGR, driven by premium pet care spending and insurer mandates for digital study submission. Remaining pockets, including dental offices and security agencies, aggregate to 7% and show consistent conversion from film and image intensifiers.
By Panel Size: Compact Formats Gain Momentum
Large-area detectors held a 56.71% share in 2025, continuing to dominate the general radiography and fluoroscopy markets. However, small-area formats are rising at a 6.96% CAGR fueled by dental, pediatric, and veterinary adoption. Medium panels, spanning 8 × 10 to 11 × 14 inches, are used in trauma bays, where lightweight designs facilitate patient positioning. The X-ray detectors market share for small-area units is expected to rise as intraoral sensors surpass film, offering chairside diagnosis and eliminating the need for chemical disposal.
Vendors now offer single-exposure 17 × 34-inch detectors that eliminate stitching artifacts in scoliosis imaging, while advancements in battery technology reduce the weight of portable panels to below 2.5 kg. Large-area panels remain irreplaceable for full-spine and interventional use, but the revenue mix steadily tilts toward compact and mid-range sizes as specialty applications flourish.
Geography Analysis
North America retained 38.92% of 2025 revenue and will grow at a 6.1% CAGR to 2031. Installed penetration of digital radiography exceeds 85%, so replacement, not first-time purchase, drives volume. Federal reimbursement increased by only 2.9% in 2025, lagging behind equipment inflation and stretching upgrade cycles. Security agencies add incremental demand: The TSA installed 300 checkpoint CT units in 2024 and targets 2,218 by 2030. Customs and Border Protection will roll out 153 large-scale scanners by 2028.
The Asia-Pacific is the fastest-growing region, with a 7.41% CAGR, buoyed by India’s push to build a USD 50 billion medical device sector and reduce import dependence to 60% by 2030. Production-linked incentives cover flat panel assembly, while greenfield plants expand local substrate capacity. Japan’s 8,300 hospitals are approaching full digital conversion under updated pharmaceutical device statutes, and Vietnam’s public-hospital partnership with Konica Minolta is accelerating rural penetration. China’s NMPA approval cycle shields domestic suppliers, enabling iRay and Vieworks to export competitively priced panels across Southeast Asia.
Europe contributed 26% of global sales in 2025. EU Chips Act funding of EUR 43 billion builds continental semiconductor lines, reducing 16-week lead times that plagued 2022 shortages. National health systems in Germany, the United Kingdom, and France are moving to lower patient doses and mandating EU MDR compliance. The Middle East and Africa held a 6% share, driven by hospital construction in Saudi Arabia and the UAE under Vision 2030. South America’s 5% share is expected to grow as Brazil equips Amazon region clinics with portable units and Argentina targets a 60% digital penetration rate by 2028.

Regulatory Landscape
X-ray detector commercialization is shaped by multi-region controls for medical devices and radiation-emitting products, and manufacturers typically align submissions with international standards referenced by regulators. In the United States, the FDA provides a conformance pathway for medical X-ray imaging devices using IEC standards, while performance requirements for ionizing-radiation emitting products are addressed under 21 CFR Part 1020. The FDA Quality Management System Regulation (QMSR) became effective February 2, 2026, updating CGMP expectations and placing greater emphasis on standardized quality-system documentation across device portfolios.
Safety and performance verification commonly builds from the IEC 60601-1 base standard using collateral and particular standards that cover radiation protection and modality-specific requirements (including IEC 60601-1-3 and IEC 60601-2-54). Quality control in clinical deployment is reinforced through test frameworks such as IEC 61223-3-8:2024 for acceptance and constancy tests across the imaging chain, with newer radiation-conditions references such as EN IEC 61267:2026 supporting characterization and test comparability. Canada adds parallel oversight through the Radiation Emitting Devices (RED) Act for relevant equipment classes, which increases documentation, labeling, and test-alignment work for suppliers serving North America.
Value Chain Analysis
The value chain begins with upstream materials and semiconductor inputs, including photoconductors (amorphous selenium and CdTe), scintillators (CsI), glass substrates, TFT/CMOS backplanes, ASICs, and shielding and packaging. It then moves through wafer fabrication and panel or backplane processing, scintillator coating or direct-conversion deposition, detector-module assembly (housing plus battery and wireless subsystems for portables), calibration and image-chain characterization, and finally software integration covering firmware, noise reduction, connectivity, and cybersecurity controls.
Downstream demand is split between medical OEMs and system integrators supplying hospitals and imaging centers, and industrial and security OEMs supplying NDT and inspection installations. In both paths, service, calibration, and lifecycle spares extend revenue beyond initial shipments. Supply dynamics continue to favor vertically integrated players that can control critical steps, reduce lead-time risk, and bundle hardware with proprietary processing. iRay Group highlighted a vertically integrated CT component chain at RSNA 2025, showing how internal control across multiple nodes of the stack can reduce reliance on merchant suppliers. The stack is also being pulled toward advanced semiconductor-based architectures, with GE HealthCare receiving FDA 510(k) clearance (March 2026) for a photon-counting CT offering using silicon detector technology, and Sony Semiconductor Solutions announcing the IMX711 direct-conversion X-ray CMOS sensor (June 2026) for high-speed inspection.
Competitive Landscape
The X-ray detectors market exhibits moderate concentration, with the top five players controlling roughly 52% of the revenue in 2025. Varex Imaging, Canon, Siemens Healthineers, GE HealthCare, and Fujifilm's vertical ownership of scintillators, photodiodes, and assembly lines yields an 8-12 percentage-point margin advantage over assemblers reliant on third-party components. Asian challengers, including iRay Technology, Vieworks, Rayence, and DRTECH, leverage labor arbitrage and export subsidies to underprice incumbents by up to 20% in developing markets.
Technology is the main battleground. Canon and Siemens invest in photon-counting architectures that enable intrinsic spectral imaging. Agfa and Carestream refine amorphous-selenium panels with 150 µm pitch for mammography precision. Start-ups such as KA Imaging secure clearances for dual-energy portable detectors that output bone-suppressed views from a single exposure, cutting dose by 30%.
Regulation forms a durable moat. Maintaining concurrent FDA, EU MDR, and NMPA approvals can cost USD 0.5-1.2 million per detector family and stretch to 24 months, discouraging new entrants. Cybersecurity scrutiny under FDA pre-market guidance and the EU Cyber Resilience Act further raises compliance barriers, elevating the value of certified platforms.
X-Ray Detectors Industry Leaders
Varex Imaging Corporation
Thales Group
Canon Inc.
iRay Technology Co. Ltd
Vieworks Co. Ltd
- *Disclaimer: Major Players sorted in no particular order

Market Opportunities and Future Outlook
One clear whitespace is the overlap between supply-chain localization and performance upgrades in flat-panel detector manufacturing. Varex Imaging inaugurated a facility at the Andhra Pradesh MedTech Zone (AMTZ) in Visakhapatnam (December 2025) that includes domestic CsI coating capability, while Vieworks completed a major expansion at its Hwaseong site (November 2025) to increase manufacturing footprint for flat panel detectors and industrial cameras. These moves broaden regional sourcing options for OEMs and providers seeking shorter lead times and multi-sourcing resilience, especially in Asia-Pacific procurement programs that prioritize portable and digital radiography adoption.
A second opportunity is the shift from conventional energy-integrating panels toward spectral and next-generation detector architectures, including photon-counting CT and emerging materials systems aimed at improving sensitivity and dose efficiency. Canon introduced Ultimion, described as Japan’s first domestically produced photon-counting CT (April 2026), and GE HealthCare’s photon-counting CT detector clearance (March 2026) indicates broader platformization of advanced detector types beyond research settings. In parallel, 2026 research activity describes translation roadmaps for perovskite-based X-ray detectors and new architectures targeting suppressed dark current and improved stability, supporting a pipeline for future panel formats across low-dose imaging and higher-resolution needs in both medical and industrial inspection.
Recent Industry Developments
- April 2026: Canon launched Ultimion, described as Japan’s first domestically produced photon-counting CT scanner, using photon-counting detector technology for high-resolution spectral imaging. The launch highlights continued investment in spectral detector platforms that can differentiate premium CT offerings and elevate detector performance requirements upstream.
- November 2025: Vieworks completed a major expansion of its Hwaseong manufacturing site in South Korea, doubling production capacity for digital X-ray detectors and high-resolution industrial cameras. The added footprint strengthens supply assurance for OEM customers across medical and industrial channels and supports faster scaling of new detector generations.
- May 2024: The American College of Radiology issued 2024 guidance that includes monthly sensitivity checks for AI-supported imaging workflows. This increases operational scrutiny on connected detector systems and reinforces the need for vendors to deliver stable, testable performance as AI features move closer to the detector and acquisition chain.


Research Methodology Framework and Report Scope
Market Definition and Coverage
For this study, the x-ray detectors market covers revenue earned from detectors used to capture x-ray images across medical, dental, industrial inspection, security screening, and veterinary uses. Values are measured in USD and reflect demand for detector systems sold into these end uses.
Scope exclusions: We exclude standalone x-ray generators, full imaging rooms, and broader imaging software unless it is bundled and priced as part of the detector offering.
Segmentation Overview
- By Type
- Flat Panel Detectors
- Indirect Flat Panel Detectors
- Direct Flat Panel Detectors
- Computed Radiography Detectors
- Charge Coupled Device Detectors
- Line-Scan Detectors
- Other Types
- Flat Panel Detectors
- By Portability
- Fixed Detectors
- Portable Detectors
- By Application
- Medical Imaging
- Dental Imaging
- Security Screening
- Industrial Non-Destructive Testing
- Veterinary Imaging
- Other Applications
- By End User
- Hospitals
- Diagnostic Imaging Centers
- Specialty Clinics
- Industrial Facilities
- Research Institutes
- Veterinary Clinics
- By Panel Size
- Large-Area Detectors
- Medium-Area Detectors
- Small-Area Detectors
- By Geography
- North America
- United States
- Canada
- Mexico
- Europe
- Germany
- United Kingdom
- France
- Russia
- Rest of Europe
- Asia-Pacific
- China
- Japan
- India
- South Korea
- Australia
- Rest of Asia-Pacific
- Middle East and Africa
- Middle East
- Saudi Arabia
- United Arab Emirates
- Rest of Middle East
- Africa
- South Africa
- Egypt
- Rest of Africa
- Middle East
- South America
- Brazil
- Argentina
- Rest of South America
- North America
Data Sources, Market Sizing, and Validation
Desk Research
Desk work starts with building the demand map for x-ray imaging and inspection, and then linking it back to detector shipments, replacement cycles, and pricing. We relied on public sources such as the US FDA device databases, International Electrotechnical Commission (IEC) standards references, World Health Organization imaging access publications, and OECD health statistics to anchor adoption signals.
To connect the market to real-world spending patterns, we also reviewed customs and trade statistics for relevant detector and imaging components, peer-reviewed journals on detector materials and performance, and public procurement and tender portals for radiology and security equipment. Company annual reports, investor decks, and product catalogs were used to confirm product positioning, average selling price ranges, and regional availability, and a paid subscription covering company financials and another covering patent activity were used selectively to fill gaps in financial disclosures and innovation trends. These desk sources are illustrative only, and many other references were also checked for data collection, validation, and clarification.
Primary Interviews and Surveys
Primary inputs were gathered through expert interviews and structured surveys with detector suppliers, channel partners, and large-volume end users, so assumptions from desk research could be tested in practical terms. Because this is a global market, responses were balanced across APAC, EMEA, and the Americas, with additional focus on pricing shifts, lead times, replacement frequency, and the split between fixed and portable demand.
Distribution of primary research fieldwork respondents
| Company type | Respondent position | Region |
|---|---|---|
| Top tier: 37% | CXOs: 18% | APAC: 43% |
| Mid tier: 45% | Functional/Unit leaders: 40% | EMEA: 31% |
| Smaller Players: 18% | Managers: 42% | Americas: 26% |
Market-Sizing & Forecasting
Sizing is built using a top-down approach where imaging and inspection activity, installed base direction, and procurement intensity are used to reconstruct the addressable detector spend by region. This is then cross-checked with selective bottom-up approximations, such as sampled average selling prices multiplied by estimated shipment volumes for key detector formats, plus channel checks to adjust for mix changes.
In the model, a few practical inputs carry most of the weight, including the split between flat panel and computed radiography detector demand, the portable versus fixed purchase mix, typical replacement cycles in hospitals and industrial sites, and the pricing gap between small and large panel sizes. Utilization and adoption signals, such as diagnostic imaging procedure growth and security screening equipment refresh programs, are used to keep totals realistic when segment growth rates are applied. When disclosure gaps appear for smaller suppliers or niche applications, we interpolate using nearby price points and a conservative share of the installed base, and then validate that the implied volumes do not break capacity and import trends.
Forecasts are built using scenario analysis supported by a short list of shared drivers agreed during primary discussions, and year-to-year smoothing is applied when pricing or replacement cycles create temporary spikes. The output is a set of market values in USD that stays traceable to a limited number of repeatable steps and observable indicators.
Data Validation & Update Cycle
Validation is done by triangulating the model outputs against independent signals, including regional procedure and procurement direction, trade flows for relevant components, and the implied detector replacement volume. If an estimate looks out of pattern, the assumptions are re-checked, and follow-up calls are triggered to re-confirm pricing, mix, and timing before totals are finalized.
A multi-step review is followed, where a second analyst stress-tests key drivers, and then final numbers are checked for year-over-year variance and logical consistency across regions and end uses. Reports are refreshed annually, and interim updates are made when material events impact pricing, supply, or demand. Before delivery, a fresh pass is completed so the latest publicly available information is reflected in the final view.
Mordor Intelligence's X Ray Detectors Market Size Compared With Other Published Estimates
Published market sizes for x-ray detectors often differ because the scope is not always aligned, and the same year may be measured using different price points, shipment assumptions, and currency timing. Differences also come from how each publisher treats bundled items, replacement versus new installations, and the refresh cadence of the underlying inputs.
Some estimates lean toward a factory-gate view that can include related services, and others mix in adjacent imaging hardware that sits outside the detector bill of materials. The spread in the table is mainly explained by what gets counted around the detector, how panel-size and portability mix is priced, and whether the base year is anchored to verified demand signals like procedure growth and procurement cycles, which Mordor Intelligence uses to keep the 2026 total tied to detector-only revenue with application-level checks.
Benchmark comparison
| Source | Market Size | Gaps in Research Methodology |
|---|---|---|
| Mordor Intelligence | USD 4.56 B (2026) | |
| Industry Publisher A | USD 4.02 B (2026) | Uses a different base-case build where adoption and replacement timing is treated more conservatively, which can understate near-term demand in faster-refresh applications like portable systems. |
| Global Publisher B | USD 5.76 B (2026) | Reports a factory-gate style revenue view that can include related services and broader value capture, which pushes the total above a detector-only spend model. |
Taken together, the comparison shows that scope and pricing logic drive most of the gap, not a single growth assumption. By keeping the inputs tied to observable demand drivers, and then validating the implied volumes and pricing against multiple signals, the final market size stays easy to audit and consistent to update year after year.


Key Questions Answered in the Report
What is the current global value of the X-ray detectors market?
The X-ray detectors market size stands at USD 4.56 billion in 2026 and is projected to reach USD 6.23 billion by 2031.
Which detector technology is growing the fastest?
Direct-conversion flat panel detectors are forecast to expand at a 7.49% CAGR through 2031 as hospitals prioritize low-dose, high-DQE imaging.
Why are portable detectors gaining traction in hospitals?
Wireless panels cut bedside exam time to under 10 minutes, reduce infection risks linked to patient transport, and align with WHO guidance that prioritizes mobile radiography for essential care.
Which region will post the highest growth?
Asia-Pacific is set to record a 7.41% CAGR to 2031, propelled by India’s production-linked incentive schemes and expanded equipment procurement across Southeast Asia.
How concentrated is vendor competition?
The market is moderately concentrated, with the top five suppliers controlling about 52% of revenue, leading to a concentration score of 6.
What is driving veterinary adoption of digital radiography?
Rising pet ownership and updated shielding standards are pushing clinics to swap film for flat panel detectors, resulting in a 7.61% CAGR for veterinary imaging demand.
Page last updated on:


