Mobile 3D Market Size and Share
Market Overview
| Study Period | 2020 - 2031 |
|---|---|
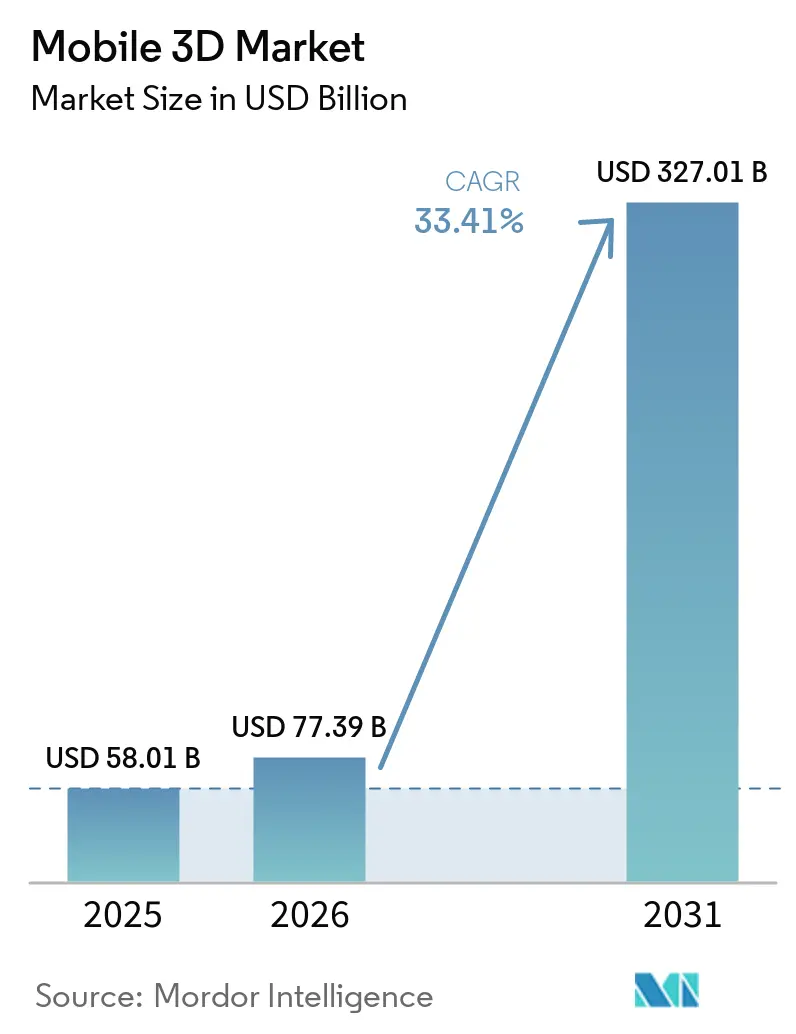
| Market Size (2026) | USD 77.39 Billion |
| Market Size (2031) | USD 327.01 Billion |
| Growth Rate (2026 - 2031) | 33.41% CAGR |
| Fastest Growing Market | Asia Pacific |
| Largest Market | North America |
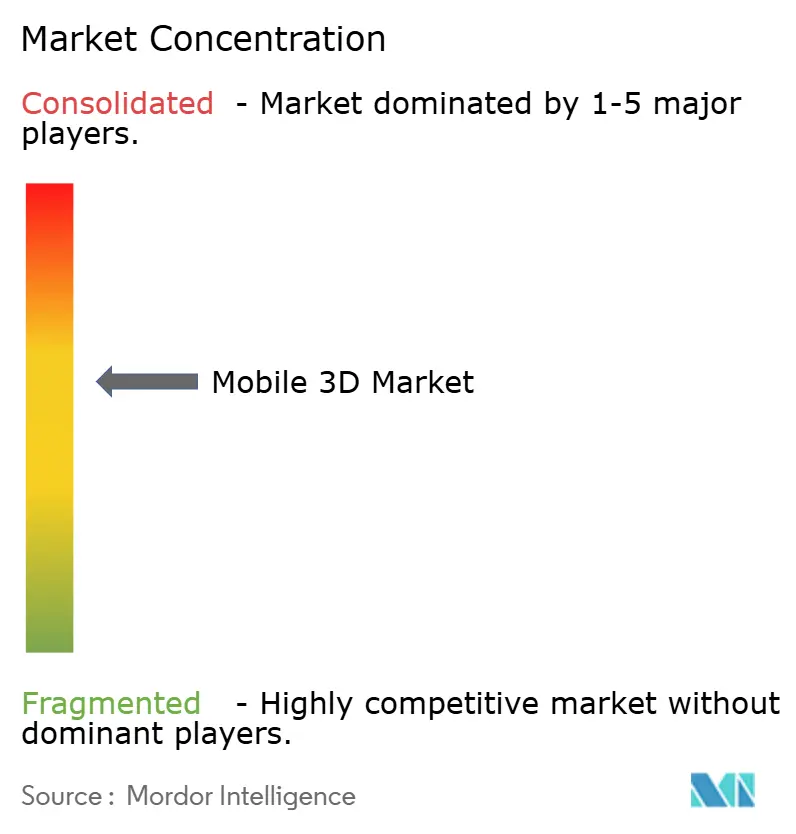
| Market Concentration | Medium |
Major Players *Disclaimer: Major Players sorted in no particular order Image © Mordor Intelligence. Reuse requires attribution under CC BY 4.0. | |
Mobile 3D Market Analysis by Mordor Intelligence
Mobile 3D market size in 2026 is estimated at USD 77.39 billion, growing from 2025 value of USD 58.01 billion with 2031 projections showing USD 327.01 billion, growing at 33.41% CAGR over 2026-2031. Robust growth reflects the pairing of edge-AI processing with advanced depth-sensing modules that turn everyday handsets into spatial-computing tools. Declining OLED micro-display costs widen access to high-resolution spatial content across smartphones, foldables, and wearables. Time-of-Flight (ToF) sensors strengthen mobile imaging while Light-Field processors reach 4K hologram quality at 30 fps, signaling the next wave of depth-capture innovation.[1]National Research Council of Science and Technology, “FPGA SoC Achieves Real-Time 4K Hologram Rendering,” etri.re.kr Enterprise productivity gains, AR gaming uptake, and 5G network rollouts further elevate user demand. Supply-chain reshuffles around VCSEL emitters and SPAD sensors reshape bargaining power among component makers, while thermal management and battery endurance remain design constraints.
Key Report Takeaways
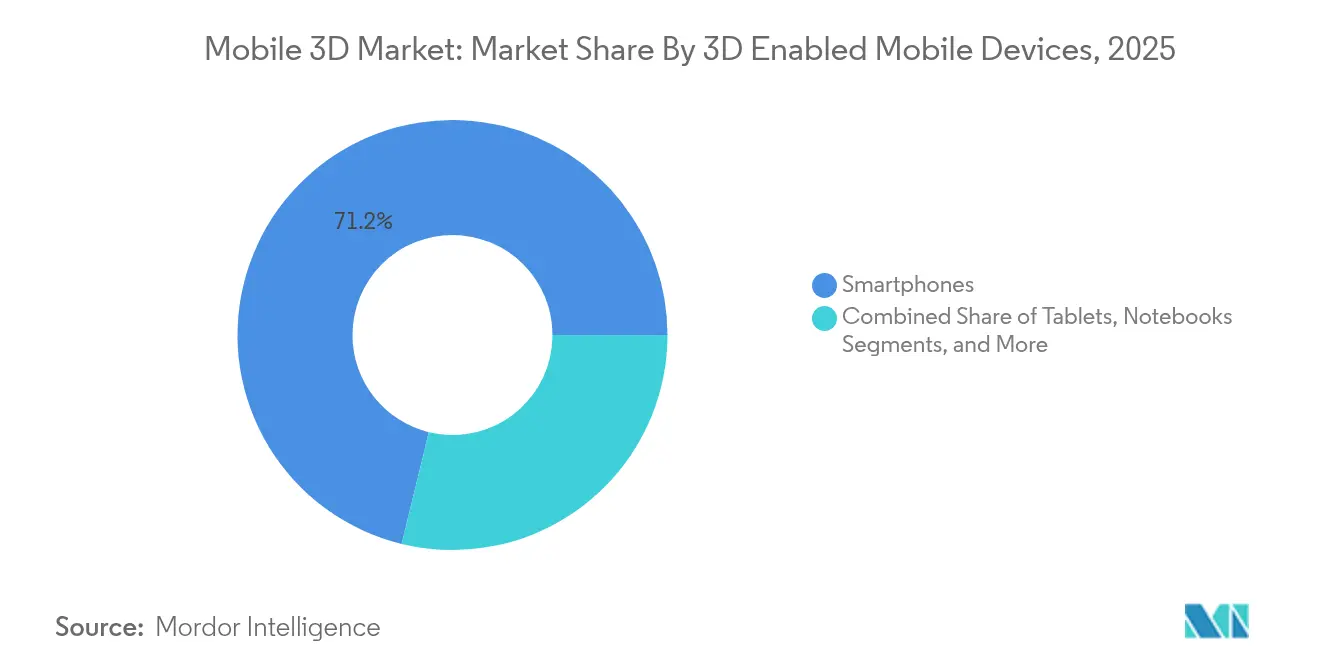
- By 3D-enabled mobile devices, smartphones led with 71.20% of the Mobile 3D market share in 2025; AR/VR eyewear is projected to expand at a 34.85% CAGR through 2031.
- By device components, 3D image sensors accounted for 45.80% of the Mobile 3D market size in 2025; OLED micro-displays are tracking a 34.20% CAGR to 2031.
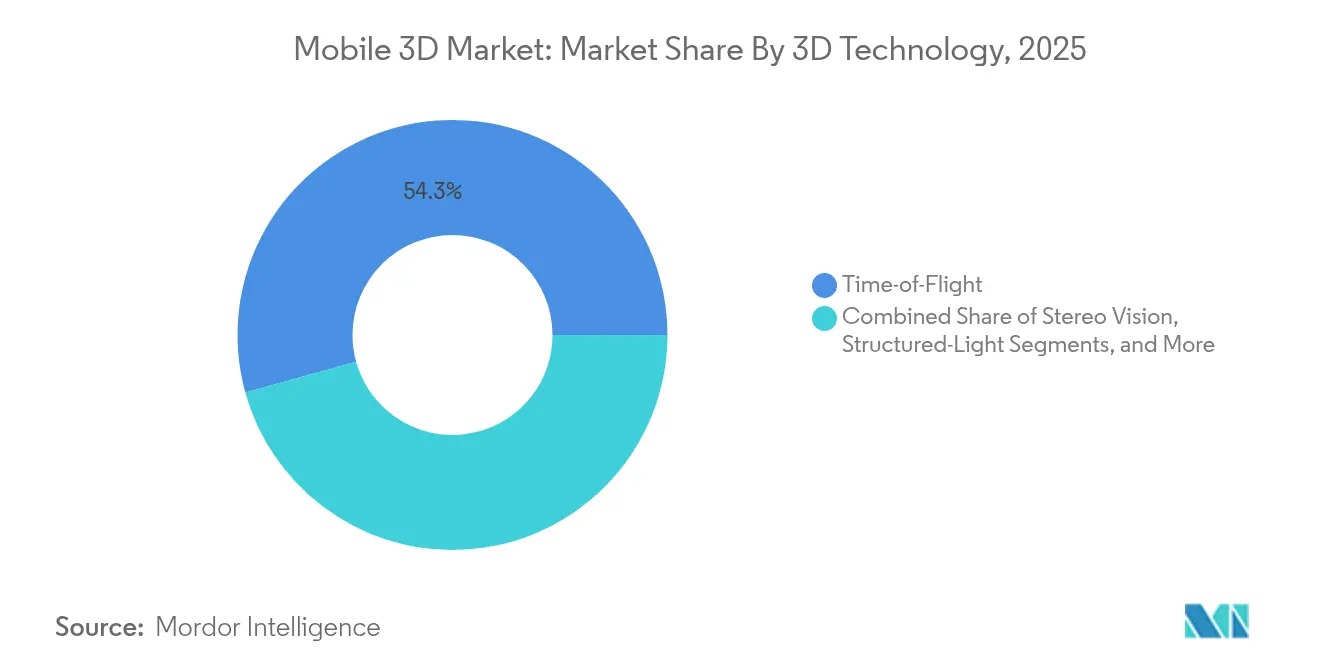
- By 3D technology, ToF captured 54.30% of the Mobile 3D market share in 2025, while Light-Field is forecast to grow at 35.20% CAGR.
- By application, mobile gaming held 31.05% revenue share of the Mobile 3D market size in 2025; Industrial and Enterprise AR is set to advance at 33.95% CAGR to 2031.
- By geography, North America commanded a 39.40% share of the Mobile 3D market in 2025; Asia Pacific exhibits the fastest trajectory with a 39.10% CAGR to 2031.
Note: Market size and forecast figures in this report are generated using Mordor Intelligence’s proprietary estimation framework, updated with the latest available data and insights as of 2026.
Global Mobile 3D Market Trends and Insights
Drivers Impact Analysis*
| Driver | (~) % Impact on CAGR Forecast | Geographic Relevance | Impact Timeline |
|---|---|---|---|
| Rise in smartphone penetration and 5G upgrades | +8.2% | Global, APAC leading | Medium term (2-4 years) |
| Rapid adoption of 3D sensing camera modules | +7.8% | North America and EU premium, APAC mass market | Short term (≤ 2 years) |
| Surge in mobile AR gaming and social-media use | +6.4% | Global urban clusters | Short term (≤ 2 years) |
| Cost decline of OLED micro-displays | +5.9% | APAC manufacturing hubs, global consumption | Medium term (2-4 years) |
| Edge-AI on-device 3D reconstruction | +4.1% | Premium device markets | Long term (≥ 4 years) |
| Foldable and dual-screen form-factors | +2.4% | Developed-market premium tiers | Long term (≥ 4 years) |
| Source: Mordor Intelligence | |||
Rapid Adoption of 3D Sensing Camera Modules (ToF / Structured-Light)
Time-of-Flight and structured-light arrays now underpin precise depth capture for portrait imaging and augmented-reality overlays. Sony expanded its Thai laser-diode plant in 2024 to meet surging demand, adding 2,000 jobs to scale VCSEL output.[2]Sony Semiconductor Solutions Group, “Sony to Expand Production of Laser Diodes in Thailand,” sony-semicon.co.jpSamsung’s ISOCELL Vizion 33D boosts range accuracy, and Apple’s spatial-video feature on iPhone 15 Pro underlines consumer appetite for native 3D capture. Meta’s indirect-ToF patent improves motion-blur mitigation and power efficiency, enhancing responsiveness in compact form factors. Industrial sectors gain from object measurement precision that supports robotics and automation.
Surge in Mobile AR Gaming and Social-Media Filters
AR games and face filters popularized by Instagram drive habitual use of 3D features. Academic review of 42,000 Instagram effects found beautification filters represented 20% of uploads, illustrating demand for real-time facial augmentation. Ericsson reports that 5G subscribers show materially higher AR engagement due to stable bandwidth. Qualcomm’s on-device Stable Diffusion generates photorealistic scenes under 15 seconds, opening creator tools to millions of handsets.[3]Qualcomm Developer Network, “Real-Time Gaussian Splatting on Snapdragon Platforms,” developer.qualcomm.com These developments lower barriers for user-generated 3D content and amplify network effects across social platforms.
Edge-AI on-Device 3D Reconstruction for Offline AR
Snapdragon 8 Elite reaches 45 TOPS, supporting models beyond 13 billion parameters without cloud connectivity. The performance headroom enables instant scene understanding essential for factory inspection and remote support. Sony’s ToF AR SDK optimizes algorithms for handset power limits, shortening development cycles for industrial partners. Growing reliance on edge inference improves privacy compliance and mitigates latency.
Cost Decline of OLED Micro-Displays Enabling Spatial Content
Apple’s Vision Pro illustrates cost sensitivity, with Sony-supplied 4K micro-OLEDs accounting for 21% of the device bill of materials, according to Panasonic. LG Display has ordered Sunic deposition tools, and BCDTEK invested USD 970 million in a 12-inch micro-OLED fab, accelerating price erosion.[4]OLED-Info, “LG Display Orders Equipment for Micro-OLED Production,” oled-info.com Tandem white OLED stacks hit 95% Rec. 2020 gamut, while LG’s 10,000-nit prototype resolves outdoor luminance constraints. Cheaper, brighter panels unlock mainstream AR wearables.
Restraints Impact Analysis*
| Restraint | (~) % Impact on CAGR Forecast | Geographic Relevance | Impact Timeline |
|---|---|---|---|
| High cost of 3D hardware and content creation | -4.8% | Global, acute in price-sensitive regions | Medium term (2-4 years) |
| Battery drain and thermal limits | -3.6% | Worldwide, cross-device concern | Short term (≤ 2 years) |
| VCSEL supply-chain bottlenecks | -2.9% | Premium device segments worldwide | Short term (≤ 2 years) |
| Lack of open cross-platform file standards | -1.7% | Enterprise deployments globally | Long term (≥ 4 years) |
| Source: Mordor Intelligence | |||
High Cost of 3D Hardware and Content Creation
Vision Pro’s manufacturing cost of USD 1,519 exposes the premium burden of micro-OLED and sensor assemblies. Content teams also face steep learning curves, limiting smaller studios. Howden nonetheless reports measurable maintenance savings from custom AR workflows despite upfront spend. Component scale-up is pushing prices lower, yet mainstream affordability remains a mid-term challenge, especially in emerging markets where feature-phone transitions still play out.
Battery Drain and Thermal Limits in Intensive 3D Processing
Even with quantization and pruning, large vision models tax mobile power budgets. Continuous 3D capture can trigger thermal throttling that degrades frame rates. Sony’s SPAD sensors reduce per-frame energy by single-photon detection but overall system draw is still high. Device makers add vapor-chamber cooling and adaptive performance scaling, yet battery chemistry advances progress slowly.
*Our forecasts treat driver/restraint impacts as directional, not additive. The impact forecasts reflect baseline growth, mix effects, and variable interactions.
Segment Analysis
By 3D Enabled Mobile Devices: Smartphones Drive Volume, AR/VR Leads Growth
Smartphones captured 71.20% of the Mobile 3D market in 2025, reflecting the installed base advantage and annual hardware refresh cycles. Flagship handsets now bundle ToF arrays, AI accelerators, and OLED displays, forming the baseline for spatial computing roadmaps. Samsung’s Galaxy S25 series exemplifies this with AI-powered ProVisual imaging that turns everyday photos into depth-mapped 3D assets. Foldables introduce layered interfaces that deepen user immersion, while tablets and notebooks extend 3D collaboration to larger canvases.
AR/VR eyewear commands a smaller numerator today but posts the fastest ascent at 34.85% CAGR. Meta’s Reality Labs, despite USD 4.4 billion operating losses, booked record revenue, underscoring latent consumer pull. Google and Samsung will debut Android XR glasses in 2026, signaling platform-level commitment. These devices bridge entertainment and enterprise, from immersive games to on-site maintenance overlays. As volumes scale, the Mobile 3D market size for wearables will close the gap with smartphones over the forecast window.


By Device Components: Sensors Lead Share, Displays Drive Innovation
3D image sensors held 45.80% of the Mobile 3D market size in 2025, serving as the cornerstone for depth capture across phones, tablets, and headsets. Sony’s Thai expansion secures diode capacity for both automotive LiDAR and mobile ToF modules, easing short-term bottlenecks. VCSEL emitters remain supply-constrained, prompting OEMs to dual-source where possible.
OLED micro-displays are the momentum story, growing 34.2% annually. Cost curves bend downward as LG Display and Chinese entrants ramp deposition lines, shortening lead times. Display innovation also spurs demand for dedicated 3D GPUs and ISPs that manage higher pixel densities without latency spikes. The components segment illustrates a virtuous loop: lower part costs lift adoption, which in turn funds further process improvements, keeping the Mobile 3D market innovation cycle brisk.
By 3D Technology: ToF Dominates, Light-Field Accelerates
ToF systems maintained a 54.30% Mobile 3D market share in 2025, underpinned by mature supply chains and balanced price-to-performance ratios. Samsung’s patent on reliability-weighted depth estimation highlights ongoing refinements that stretch ToF relevance into mid-cycle devices.
Light-Field technology, though nascent, is racing ahead at 35.20% CAGR. Korean FPGA-based hologram processors achieve 30 ms latency at 4K, a threshold once limited to lab demos. Advances in quasicrystal metasurfaces that project multiple images without crosstalk widen potential beyond phones to security tagging and retail signage. Hybrid stacks combining ToF with stereo or Structured-Light continue to appear in premium handsets to unify accuracy with eye-safe power budgets.
By 3D Applications: Gaming Leads Usage, Enterprise AR Grows Fastest
Mobile gaming captured 31.05% of revenue in 2025, monetizing 3D graphics through in-app purchases and advertising tie-ins. Popular titles layer physics-accurate depth cues that enhance realism and retention. Maps and navigation apps add photorealistic cityscapes that improve orientation.
Industrial and Enterprise AR, although smaller in absolute dollars, is scaling at 33.95% CAGR as maintenance teams and production lines validate strong ROI. Advanced Semiconductor Engineering cut safety patrol times entirely by using hands-free AR checklists. Medical training, retail virtual try-on, and architectural visualization round out the use-case roster. The widening palette of business outcomes ensures that the Mobile 3D market will not rely solely on entertainment for growth.
Geography Analysis
North America led with a 39.40% Mobile 3D market share in 2025, buoyed by enterprise investments and high discretionary income. Meta’s cumulative AR/VR outlay topping USD 100 billion amplifies regional R&D momentum. Industrial firms report productivity gains from AR-enabled workflows, while consumers readily adopt premium smartphones that showcase bleeding-edge 3D features.
Asia Pacific is the growth pacesetter at a 39.10% CAGR through 2031. China’s 3D industrial camera revenue reached CNY 2.362 billion (USD 334 million) in 2024 on the back of robotics demand. The region contributes USD 880 billion of mobile value-added to GDP, positioning it as both supplier and demand center. Korean and Japanese firms push display and holo-processor research, while contract manufacturers in Vietnam and India absorb new assembly mandates for AR wearables.
Europe records steady take-up driven by Industry 4.0 projects in automotive and aerospace. Regulation supports secure data handling, encouraging enterprises to trial edge-AI 3D tools. Middle East and Africa and Latin America remain nascent Mobile 3D markets, yet rising 5G penetration and urbanization lay groundwork for accelerated adoption once hardware costs dip.


Competitive Landscape
The Mobile 3D market shows moderate fragmentation with layered competition from silicon to software. Apple and Samsung employ vertical integration to differentiate cameras, displays, and operating systems. Apple’s shift toward Sony SPAD sensors curbs reliance on Coherent and Lumentum, signaling supplier diversification. Samsung’s collaboration with Google on Project Moohan XR brings an alternative platform that counters Meta’s Reality OS.
Qualcomm anchors the silicon tier by optimizing AI inference for 3D workloads, winning design slots across Android flagships. Meta inks patents for indirect ToF while reinforcing its hardware roadmap via EssilorLuxottica, ensuring ecosystem stickiness for Ray-Ban smart glasses. Component specialists like ams-Osram push high-temperature VCSELs that raise reliability. The pace of partnerships and IP filings highlights a race to secure functional moats in sensing, display, and AI layers.
Supply-chain concentration around key wafer processes remains a vulnerability. Natural disasters or geopolitical shocks can impair diode or micro-display availability, as seen in previous VCSEL constraints. Firms now lock in multi-geography fabs and sign long-term silicon photonics agreements to hedge risk. Competitive intensity is likely to persist as incumbents and disruptors chase a Mobile 3D market that rewards both scale and specialization.
Mobile 3D Industry Leaders
Samsung Electronics Co Ltd
NVidia Corporation
Sharp Corporation
Apple Inc.
HTC Corporation
- *Disclaimer: Major Players sorted in no particular order

Recent Industry Developments
- June 2025: Meta and Anduril submitted a USD 100 million bid to provide the EagleEye AR system to the U.S. Army, extending commercial 3D tech into defense.
- June 2025: Sony Semiconductor Solutions unveiled the IMX479 stacked SPAD depth sensor capable of 300-meter LiDAR, targeting automotive and future mobile deployments.
- May 2025: Google committed USD 150 million with Warby Parker to develop Android XR smart glasses powered by Gemini AI.
- April 2025: Samsung confirmed Project Moohan XR headset launch in its Q1 call, marking the first consumer product running Android XR.


Research Methodology Framework and Report Scope
Market Definitions and Key Coverage
Our study defines the mobile 3D market as all revenue earned from hardware, firmware, and software that capture, process, or display stereoscopic or depth-enhanced content on battery-powered devices, primarily smartphones, foldables, tablets, and lightweight AR/VR headsets.
Scope exclusion: devices tethered to external graphics processors or fixed power sources remain outside our lens.
Segmentation Overview
- By 3D Enabled Mobile Devices
- Smartphones
- Foldable and Dual-Screen Phones
- Tablets
- Notebooks
- AR/VR Eyewear and Head-Mounted Displays
- Other 3D-Enabled Devices
- By Device Components
- 3D Image Sensors (ToF, Structured-Light)
- 3D Displays and OLED Micro-Displays
- Depth-Sensing Modules and VCSELs
- 3D GPUs / ISPs
- Software SDKs and Middleware
- By 3D Technology
- Time-of-Flight (ToF)
- Structured-Light
- Stereo Vision
- Light-Field / Holographic
- Other Emerging Technologies
- By 3D Applications
- Mobile Gaming
- Maps and Navigation
- Animations and 3D Content Creation
- Advertising and Social-Media Filters
- Industrial and Enterprise AR
- Other Applications
- By Geography
- North America
- United States
- Canada
- Mexico
- South America
- Brazil
- Argentina
- Rest of South America
- Europe
- United Kingdom
- Germany
- France
- Italy
- Russia
- Rest of Europe
- Asia Pacific
- China
- India
- Japan
- South Korea
- ASEAN
- Rest of Asia Pacific
- Middle East and Africa
- Middle East
- Saudi Arabia
- United Arab Emirates
- Turkey
- Rest of Middle East
- Africa
- South Africa
- Nigeria
- Rest of Africa
- Middle East
- North America
Detailed Research Methodology and Data Validation
Primary Research
Analysts held structured interviews with chipset designers, OLED stack suppliers, mobile game publishers, and carrier device-procurement leads across Asia-Pacific, North America, and Europe. Insights on 3D sensor bill-of-materials, ASP progression, and user uptake validated desk findings and clarified gray areas in emerging holographic phones.
Desk Research
We began with open datasets such as the GSMA Mobile Economy, ITU ICT Indicators, IEEE Sensors Journal, Eurostat trade codes, and US FCC equipment authorizations, which give baseline volumes, component attach rates, and regulatory signals. Corporate 10-Ks, investor decks, and association portals for mobile gaming and XR complemented those figures. Our team also taps D&B Hoovers and Dow Jones Factiva for company-level revenue splits and deal activity. These references illustrate rather than exhaust the secondary pool that informed the model.
Market-Sizing & Forecasting
A top-down reconstruction starts with global smartphone and tablet shipments, applies depth-camera and 3D-display penetration ratios, and multiplies by region-specific blended ASPs. Supplier roll-ups and channel checks offer a selective bottom-up view that fine-tunes totals. Key variables include ToF sensor attach rate, mobile GPU ASP trends, 5G user base growth, XR-ready content hours streamed, and average game spend per 3D-capable handset. Multivariate regression links these drivers to revenue through 2030, while scenario analysis adjusts for supply-chain shocks or GPU node shifts. Gaps in granular unit data are bridged by weighted moving averages from quarterly vendor disclosures.
Data Validation & Update Cycle
Our outputs pass anomaly screens, cross-checks against independent shipment audits, and a peer review before sign-off. Reports refresh each year, and we trigger interim revisions when component costs swing sharply or a flagship OEM launches depth-sensing models ahead of plan. Clients therefore receive the latest vetted view.
Why Our Mobile 3D Baseline Commands Trusted and Confident Decisions
Published estimates vary; differing device scopes, ASP assumptions, and refresh cadences push totals apart. We acknowledge those swings upfront, so users grasp what sits inside each number.
Key gap drivers include whether tablets and AR viewers are counted alongside phones, if advertising revenue joins hardware sales, and how quickly analysts roll newer VCSEL-based sensors into forecasts. Mordor's page reports a balanced base case, whereas some publishers lean aggressive by folding wider XR hardware or, conversely, conservative by tracking only autostereoscopic displays.
Benchmark comparison
| Market Size | Anonymized source | Primary gap driver |
|---|---|---|
| USD 58.01 B (2025) | Mordor Intelligence | - |
| USD 113.22 B (2025) | Regional Consultancy A | Includes AR glasses and in-app ad revenue, inflating scope |
| USD 60.14 B (2025) | Industry Association B | Derives totals from handset shipments only, with limited ASP validation |
The comparison highlights that Mordor analysts blend disciplined scope selection, timely ASP tracking, and annual refreshes, which together deliver a transparent, reproducible baseline clients can rely on for strategic bets.


Key Questions Answered in the Report
What is the current size and growth outlook for the mobile 3D market?
The market generated USD 77.39 billion in 2026 and is projected to reach USD 327.01 billion by 2031, advancing at a robust 33.41% CAGR over 2026-2031.
Which device category shows the fastest growth potential?
AR/VR eyewear is projected to expand at a 34.85% CAGR through 2031, outpacing smartphones even though handsets still command the largest share.
Why is Asia Pacific viewed as the strongest expansion region?
The region is on track for a 39.10% CAGR owing to large-scale electronics manufacturing, rising 5G penetration, and fast-growing consumer demand in China, India, and South-East Asia.
What technical hurdles limit wider adoption of mobile 3D technology?
High hardware and content costs, battery drain and thermal constraints, and VCSEL supply-chain bottlenecks are the primary obstacles hampering mass-market uptake.
How do component price declines influence market opportunities?
Rapid cost reductions in OLED micro-displays—driven by new fab investments from LG Display and Chinese manufacturers—are broadening spatial-content access across phones, foldables, and head-worn devices.
Who are the leading players and how concentrated is the market?
Apple, Samsung, Meta, Sony, and Qualcomm hold slightly above 60% combined share, giving the industry a moderate concentration score of 6 on a 1–10 scale.
Page last updated on:


