Simulation Software Market Size and Share
Market Overview
| Study Period | 2020 - 2031 |
|---|---|
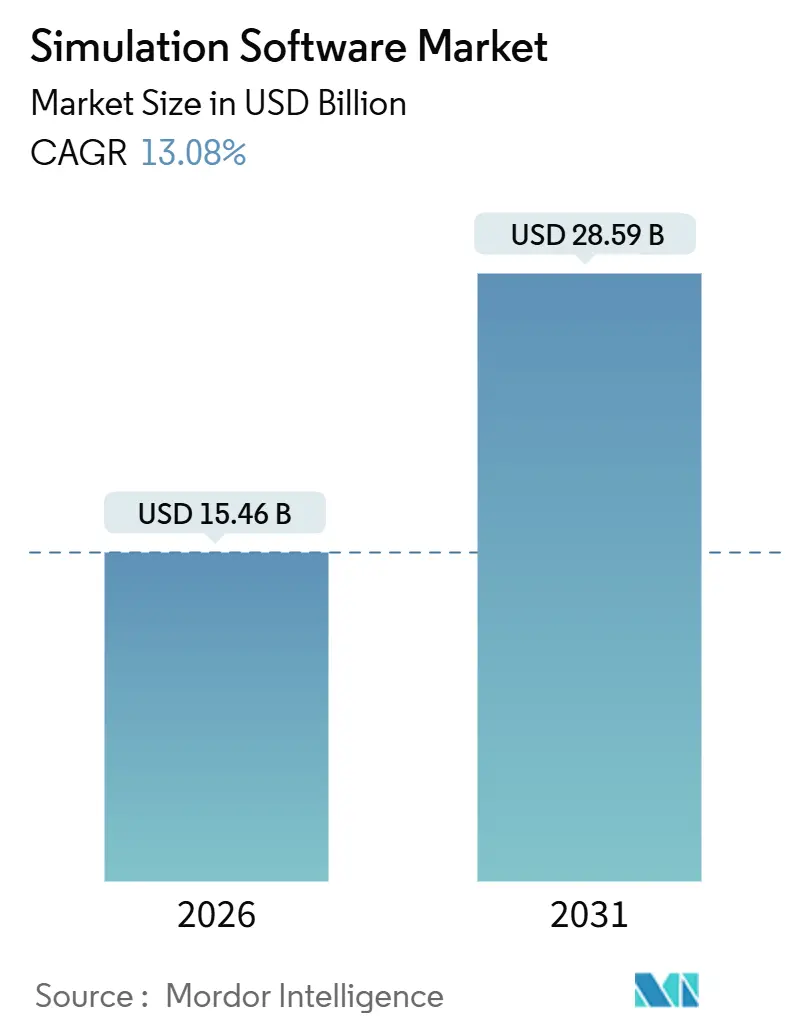
| Market Size (2026) | USD 15.46 Billion |
| Market Size (2031) | USD 28.59 Billion |
| Growth Rate (2026 - 2031) | 13.08% CAGR |
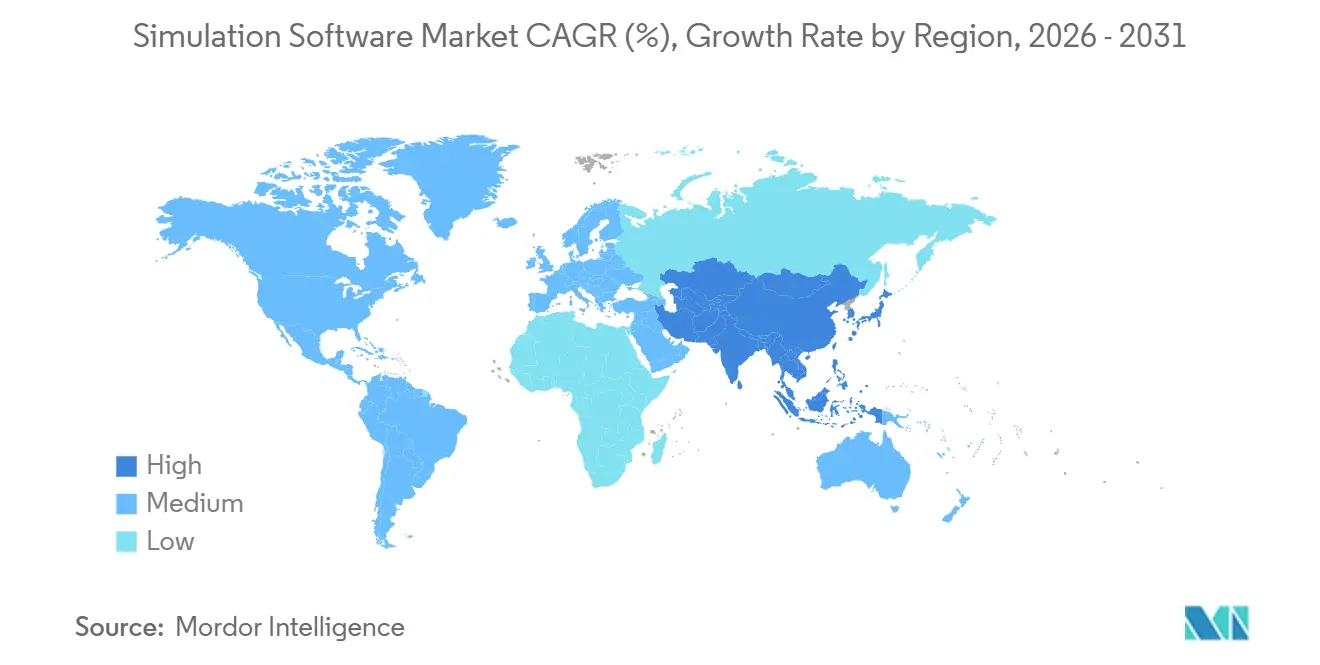
| Fastest Growing Market | Asia Pacific |
| Largest Market | North America |
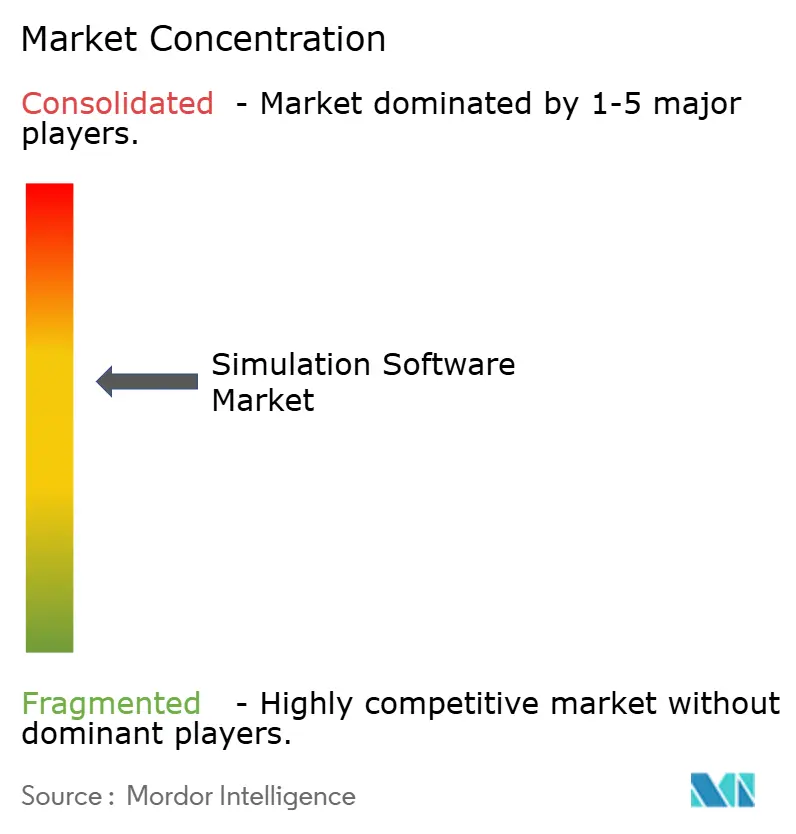
| Market Concentration | Medium |
Major Players *Disclaimer: Major Players sorted in no particular order Image © Mordor Intelligence. Reuse requires attribution under CC BY 4.0. | |
Simulation Software Market Analysis by Mordor Intelligence
The simulation software market size is valued at USD 15.46 billion in 2026 and is projected to reach USD 28.59 billion by 2031, advancing at a 13.08% CAGR. Expanding cloud-native infrastructure, regulatory pressure for virtual sustainability assessments, and the maturation of digital-twin ecosystems are broadening the addressable base of engineering teams. Automotive, aerospace, and semiconductor leaders now run millions of virtual scenarios each month to compress prototype cycles and de-risk capital spending. Mid-market manufacturers are adopting pay-as-you-go solvers that previously demanded dedicated high-performance clusters, while AI-driven surrogate models shorten design exploration time. At the same time, data-exchange standards remain fragmented, and domain-specific physics talent scarcity slows adoption outside mature economies.
Key Report Takeaways
- By deployment type, on-premises installations held 60.11% of 2025 revenue, while cloud and SaaS configurations are growing at a 13.22% CAGR through 2031.
- By end-user industry, automotive led with 28.32% revenue share in 2025, whereas healthcare and life sciences is forecast to expand at a 13.58% CAGR.
- By simulation type, computational fluid dynamics captured 32.47% of 2025 revenue; discrete-event and process simulation is advancing at a 14.01% CAGR.
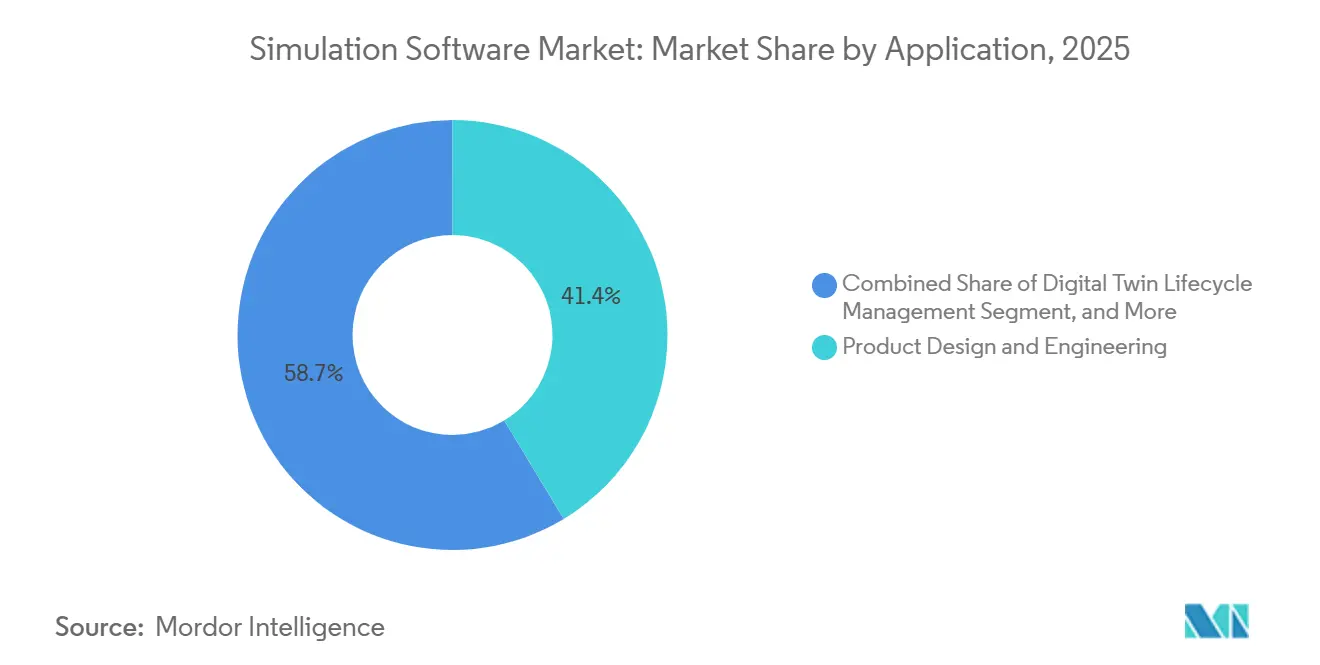
- By application area, product design and engineering accounted for 41.35% of 2025 spending, while digital-twin lifecycle management is projected to grow at a 13.99% CAGR.
- By component, software licenses represented 54.71% of 2025 revenue and platform and integration services are pacing at a 13.85% CAGR.
- By geography, North America commanded 36.46% revenue share in 2025, yet Asia Pacific is poised to lead growth with a 14.60% CAGR through 2031.
Note: Market size and forecast figures in this report are generated using Mordor Intelligence’s proprietary estimation framework, updated with the latest available data and insights as of January 2026.
Global Simulation Software Market Trends and Insights
Drivers Impact Analysis*
| Driver | (~) % Impact on CAGR Forecast | Geographic Relevance | Impact Timeline |
|---|---|---|---|
| Rising Cloud-Native Simulation Adoption | +2.30% | Global, with North America and Europe leading enterprise SaaS migration | Medium term (2-4 years) |
| Automotive Demand for Virtual Validation | +2.10% | Global, concentrated in Germany, United States, Japan, China, South Korea | Short term (≤ 2 years) |
| Rapid Uptake of Digital-Twin Initiatives | +1.90% | North America, Europe, Asia Pacific manufacturing hubs | Medium term (2-4 years) |
| AI-Driven Generative Simulation Workflows | +1.70% | North America and Europe early adopters, expanding to Asia Pacific | Long term (≥ 4 years) |
| ESG-Mandated Virtual Sustainability Assessments | +1.50% | Europe (EU taxonomy), North America (SEC climate disclosure), spreading globally | Medium term (2-4 years) |
| 5G, Open RAN Network-Function Virtualization Testing | +1.20% | Asia Pacific, North America, Europe telecom infrastructure markets | Short term (≤ 2 years) |
| Source: Mordor Intelligence | |||


Rising Cloud-Native Simulation Adoption
Enterprises accelerated the lift-and-shift of solver workloads to public clouds during 2025 as subscription pricing replaced perpetual licenses, eliminating upfront hardware capital. Ansys benchmarks on Amazon Web Services Graviton processors cut computational fluid dynamics runtimes by 30% and reduced hourly costs, making elastic compute viable for short design sprints.[1]“Ansys Cloud Solutions,” ANSYS, ansys.com Siemens broadened its Xcelerator as a Service catalogue, giving mid-market manufacturers access to finite-element and multibody solvers without maintaining on-premises clusters.[2]“Siemens Xcelerator Platform,” Siemens, siemens.com Gartner reported that 40% of new simulation seats sold in 2025 used SaaS delivery, up from 28% in 2023. The switch democratizes high-fidelity physics for smaller firms that previously relied on outsourced engineering, and it allows large incumbents to burst peak workloads without idle capacity. Cloud adoption still contends with egress fees and data-sovereignty rules, but forward pricing curves favour hyperscale usage for iterative design.
Automotive Demand for Virtual Validation
Original equipment manufacturers trimmed physical crash prototypes as virtual test benches matured. Volvo disclosed a 60% reduction in physical crash builds for its 2025 electric platform after calibrating finite-element occupant safety models against historical data. New Society of Automotive Engineers norms let regulators accept simulation results for battery thermal runaway, shifting homologation cost upstream to software. MathWorks enhanced Simulink with high-resolution electrochemical battery models, enabling 10-year degradation forecasts within normal design windows.[4]“Battery Simulation in Simulink,” MathWorks, mathworks.com As electric-vehicle platforms proliferate, engineering teams now run more than 100,000 virtual scenarios per program to evaluate lightweighting, crashworthiness, and range trade-offs. This virtualization trims tooling rework, accelerates launches, and squeezes warranty risk.
Rapid Uptake of Digital-Twin Initiatives
The National Institute of Standards and Technology released an interoperability framework in 2024 that clarified data-exchange rules between sensor streams and simulation kernels, reducing integration frictions. General Electric connected computational fluid dynamics models to real-time telemetry on 12 gas-turbine sites, extending overhaul intervals by 18 months and proving value at scale. Bentley Systems added live traffic stress simulation to its iTwin platform, allowing bridge owners to prioritize maintenance budgets with quantified risk. IEEE working groups defined open APIs that couple discrete-event and continuous-time solvers, supporting multi-physics digital twins. As cloud costs fall and edge devices proliferate, digital twins are graduating from pilots to core asset-management tools.
AI-Driven Generative Simulation Workflows
Autodesk’s Fusion 360 generative engine produced aerospace brackets that met load targets while trimming mass by 40%, highlighting how machine-learning can front-load design exploration. Altair’s SimAI surrogate models approximate aerodynamic drag in seconds, letting engineers iterate thousands of shapes before committing to grid-based solvers. McKinsey estimated that AI-assisted workflows cut early-stage design cycles by up to 70%, although certification still demands traditional simulation precision. Physics-informed neural networks are emerging as mesh-free solvers for well-characterized flows, but regulatory bodies have yet to approve them for safety-critical domains. The convergence of AI and simulation will eventually redistribute engineering hours from model setup to concept innovation.
Restraints Impact Analysis*
| Restraint | (~) % Impact on CAGR Forecast | Geographic Relevance | Impact Timeline |
|---|---|---|---|
| High Total Cost of Ownership for HPC Infrastructure | -1.80% | Global, acute in emerging markets with limited capital budgets | Short term (≤ 2 years) |
| Data Interoperability and Standards Gaps | -1.40% | Global, fragmented across industry verticals | Medium term (2-4 years) |
| IP Security Concerns in Cloud Outsourcing | -1.10% | Defense, aerospace, pharmaceutical sectors in North America, Europe, Asia | Short term (≤ 2 years) |
| Scarcity of Vertical-Domain Simulation Talent | -0.90% | Emerging Asia Pacific, Latin America, Africa | Long term (≥ 4 years) |
| Source: Mordor Intelligence | |||
High Total Cost of Ownership for HPC Infrastructure
NVIDIA H100 units listed above USD 30,000 in 2025, and a 64-GPU crash-analysis rack consumed roughly USD 90,000 in annual electricity at German industrial tariffs. Such economics deter mid-tier suppliers from scaling virtual validation. Cloud burst capacity lowers entry hurdles, but always-on workloads can outstrip on-premises amortization after the first year. Many firms therefore operate hybrid estates, reserving internal clusters for steady thermal analysis and bursting to cloud for peak aerodynamics studies. Without subsidies or shared facilities, price shock keeps smaller manufacturers on legacy design-build-test loops and limits the diffusion of digital-twin practices.
Data Interoperability and Standards Gaps
ISO STEP AP242 revisions in 2024 improved geometric handover but still omit mesh metadata and joint definitions, forcing manual recreation when shifting between solvers. Automotive suppliers report that converting computational fluid dynamics files for downstream thermal analysis consumes up to one-fifth of project hours. Cloud platforms that embed multiple solvers can mask file issues, yet enterprises with sunk license costs resist ecosystem lock-in. The Simulation Interoperability Standards Organization is drafting neutral schemas, but adoption differs across aerospace, energy, and electronics. Until tooling converges, duplicative modelling and version mismatches will erode the simulation’s promised time-to-insight.
*Our forecasts treat driver/restraint impacts as directional, not additive. The impact forecasts reflect baseline growth, mix effects, and variable interactions.
Segment Analysis
By Deployment Type - Cloud Gains Momentum While On-Premises Dominates
In value terms, on-premises estates accounted for 60.11% of 2025 revenue, driven by automotive and defense firms that keep intellectual property behind firewalls. The simulation software market size tied to cloud and SaaS delivery is advancing at a 13.22% CAGR, faster than the overall trajectory, as mid-market users adopt subscription models for peak workloads. Siemens added 1,200 new cloud customers in 2025, highlighting how elastic compute opens doors for companies without traditional HPC budgets.
Hybrid topologies are common: steady crash suites run on internal clusters, while transient thermal studies burst to public clouds during design sprints. Orchestration complexity and data-transfer latency still limit true workload portability, yet pricing curves favour cloud for variable demand. Over the forecast horizon, SaaS revenue should account for the majority of incremental gains, though on-premises residuals will persist in export-controlled domains where compute sovereignty is required.


By End-User Industry - Healthcare Surges While Automotive Retains Lead
Automotive accounted for 28.32% of 2025 revenue in the simulation software market, powered by electric-vehicle crash simulations, autonomous-driving sensor fusion, and lightweight body-in-white analysis. Healthcare and life sciences, however, are projected to grow at a 13.58% CAGR through 2031 as in-silico trials reduce animal testing costs and accelerate device approvals under evolving FDA guidance.
Pharma companies employ physiologically based pharmacokinetic models to screen candidates before wet labs, and medical-device firms validate implant durability in silico to shorten regulatory cycles. Outside these two verticals, aerospace retains steady demand for aerodynamic and radiation studies, while electronics manufacturers use thermal solvers to contain chip-level hotspots. The simulation software industry also benefits from rising telecom activity as operators design 5G Open RAN rollouts with virtual network emulators.
By Simulation Type - Discrete-Event Expands as CFD Leads
Computational fluid dynamics held 32.47% share of 2025 revenue, reflecting its indispensability in aerospace thermal management, turbine efficiency, and automotive aerodynamics. Discrete-event simulation, though smaller, is the fastest-rising category at 14.01% CAGR as manufacturers digitize warehouse flows and optimize supply chains.
Finite-element analysis remains foundational for structural integrity across many sectors, while electromagnetic solvers are in high demand for 5G antenna tuning and radar cross-section minimization. System-level modelling platforms such as Simulink enable early architecture trade-offs without committing to detailed geometry. Momentum behind discrete-event tools underscores a shift toward operational resilience, with companies modelling line balancing and logistics variability to protect margins in volatile demand cycles.
By Application Area - Digital Twins Outpace Traditional Design
Product design and engineering attracted 41.35% of 2025 spending, cementing its role as the anchor use case. Yet digital-twin lifecycle management is set to expand at 13.99% CAGR, and its share of the simulation software market size will rise as utilities and manufacturers stream sensor data into physics-based models to predict failures.
Live calibration of twins on turbines, elevators, and bridges enables predictive maintenance and reduces unplanned downtime. Research teams leverage simulation for novel material discovery, while process-optimization applications fine-tune energy consumption at factories. Training and safety modules integrate multibody dynamics with VR headsets so technicians can rehearse hazardous tasks without physical exposure.

By Component - Platform Integration Accelerates Beyond Licenses
Software licenses contributed 54.71% of 2025 revenue, but spending on platform and integration services is growing at 13.85% CAGR as enterprises orchestrate multi-vendor workflows on Kubernetes backbones. Vendors that bundle orchestration, version control, and automated meshing win mindshare over standalone solver purveyors.
Services firms now offer outcome-based pricing, charging only for validated design deliverables. The simulation software market share captured by pure-play solvers could erode if they do not align with open APIs and microservice architectures that allow clients to mix best-of-breed tools.
Geography Analysis
North America retained 36.46% of 2025 revenue, bolstered by aerospace primes, Detroit-area automotive hubs, and Silicon Valley chip designers. The simulation software market size across the region benefits from early SaaS uptake and mature cloud governance frameworks. Europe follows closely, driven by automotive electrification mandates and the Corporate Sustainability Reporting Directive that pushes lifecycle environmental simulation. Germany, France, and the United Kingdom anchor demand, aided by local champions Siemens and Dassault Systèmes.
Asia Pacific is the growth engine, scaling at a 14.60% CAGR through 2031. China’s Ministry of Industry and Information Technology subsidizes digital twins among small manufacturers, while India’s engineering-services providers extend simulation talent pools to global clients. Japan focuses on Industry 4.0 factory modelling, and South Korea’s semiconductor majors intensify thermal and electromagnetic analysis to meet AI chip performance thresholds. Southeast Asian nations, led by Vietnam and Thailand, attract electronics and automotive assembly lines that now embed discrete-event simulation into plant layout decisions.
South America and the Middle East show modest uptake centered on Brazilian aerospace and Gulf infrastructure megaprojects. African demand is concentrated in South African mining and automotive, hindered by limited HPC access. Overall uptake outside the tri-polar clusters depends on cloud cost curves and university curricula that can replenish scarce simulation expertise.

Regulatory Landscape
Regulation is increasingly formalizing when simulation results can substitute for physical testing, which raises expectations around model credibility, traceability, and toolchain governance. In life sciences, the International Council for Harmonisation (ICH) adopted the M15 Guideline in January 2026, setting common principles for Model-Informed Drug Development (MIDD) that influence how modeling and simulation evidence is assessed and discussed during regulatory interactions and submissions. In transportation, the United Kingdoms Automated Vehicles Act 2024 embeds simulation-based methods within the safety evaluation and authorization process, while UNECE workstreams are developing requirements for the credibility of simulation toolchains for virtual testing of automated driving systems.
Sector-specific compliance is also pushing vendors toward standardized capability definitions and digital-thread interoperability. In April 2026, the European Commission adopted Implementing Regulation (EU) 2026/781, updating requirements for flight simulation training devices and introducing an FSTD capability signature approach that ties simulator capability to specific training and checking tasks. In April 2026, the US Nuclear Regulatory Commission issued Draft Regulatory Guide DG-1384 to update RG 1.149 by endorsing ANSI/ANS 3.5-2018 for nuclear power plant simulation facilities used for operator training and licensing, reinforcing the need for validated, auditable simulation facilities. Standards bodies are extending the digital-twin backbone, including ISO 23247-5:2026 on the manufacturing digital thread, which supports more consistent data exchange and lifecycle management for simulation-driven operations.
Competitive Landscape
Five integrated suppliers (Ansys, Dassault Systèmes, Siemens Digital Industries Software, Altair Engineering, and Autodesk) accounted for roughly 55-60% of 2025 revenue. They defend share through tight CAD integration, cloud alliances with AWS and Microsoft Azure, and multi-year enterprise agreements. Ansys filed GPU patents that trimmed CFD runtimes by 40%, while Siemens embedded AI-based meshing that cuts preprocessing hours by 30%.
Strategic consolidation intensified when Synopsys bought Ansys for USD 35 billion in January 2025, merging electronic design automation with multi-physics solvers to offer end-to-end silicon-to-system optimization. Smaller specialists focus on electromagnetic compatibility, reservoir modelling, or process simulation. Open-source packages such as OpenFOAM appeal to academia and cost-sensitive shops but lack certification workflows demanded by regulated industries.
Start-ups training neural operators on historical datasets promise near-real-time predictions, but their commercial viability depends on regulatory recognition of AI-generated results. Cloud delivery and subscription pricing pressure margins, forcing vendors to emphasize platform stickiness over solver superiority. The resulting battleground favours providers that harmonize heterogeneous physics solvers within data-centric environments that span design, manufacturing, and operations.
Simulation Software Industry Leaders
Ansys Inc.
Dassault Systèmes
Siemens Digital Industries Software
Altair Engineering Inc
Autodesk Inc.
- *Disclaimer: Major Players sorted in no particular order

Market Opportunities and Future Outlook
Opportunities are emerging where buyers need continuously operating, physics-grounded digital twins linked to operational data, rather than one-off engineering studies. In energy and electrification, ETAP announced ETAP 2026 in May 2026 with AI-augmented, physics-based electrical digital twin capabilities and an expanded library of more than 23,000 validated equipment models, reinforcing demand for validated model libraries and integration services that reduce time-to-deploy. In industrial production, the April 2026 Dassault Systemes and OMRON partnership to integrate 3DEXPERIENCE with the Sysmac automation platform points to a route for simulation software to move closer to shop-floor control, creating room for vendors that can package virtual commissioning, line balancing, and quality scenarios in repeatable workflows.
Large, complex infrastructure and compute-intensive facilities are also becoming targets for simulation platforms that can combine geometry, telemetry, and AI-driven optimization. Jacobs released a Data Center Digital Twin solution in March 2026 using the NVIDIA Omniverse DSX blueprint to simulate and optimize gigawatt-scale AI data centers, supporting an expanding addressable base in data center design, operations, and energy management. In mining operations, idoba released idoba.sim v2.0 in July 2026 to combine development and production modeling within a single simulation run, pointing to demand for domain-specific operational simulation beyond traditional manufacturing. Alongside these use cases, consolidation in CAE and EDA, including Siemens completing the Altair acquisition (March 2025) and Synopsys completing the Ansys acquisition (July 2025), increases focus on interoperable data models and partner ecosystems for customers running multi-vendor toolchains across mechanical, electromagnetic, and system simulation.
Recent Industry Developments
- June 2026: Dassault Systemes partnered with PariSante Campus to support digital health startups through the 3DEXPERIENCE Lab and OUTSCALE for Entrepreneurs programs. The initiative broadens access to simulation and virtual twin tooling for healthcare and life sciences use cases, reinforcing the markets shift toward regulated, data-governed modeling workflows.
- July 2025: Synopsys completed its acquisition of Ansys for approximately USD 34.9 billion. The combination links semiconductor EDA with multiphysics and system simulation, strengthening end-to-end silicon-to-systems development workflows and raising competitive pressure on standalone solver vendors.
- March 2025: Siemens completed its acquisition of Altair Engineering for approximately USD 10 billion. Folding Altairs simulation, HPC, and industrial AI capabilities into Siemens Xcelerator expanded an integrated platform approach and accelerated consolidation among top-tier simulation software suppliers.


Research Methodology Framework and Report Scope
Market Definition and Coverage
This market is defined as revenue earned from simulation software used to model and test real world behavior in a virtual environment, across engineering, manufacturing, and process use cases. It covers packaged and cloud delivered tools that help users simulate performance, safety, and operating outcomes before physical build or deployment.
Scope exclusions: The sizing excludes stand alone gaming engines, VR training content sold without a solver, and pure visualization plug-ins that do not run a simulation model.
Segmentation Overview
- By Deployment Type
- On-Premise
- Cloud / SaaS
- By End-User Industry
- Automotive
- Aerospace and Defense
- Electrical and Electronics
- Energy, Oil and Mining
- IT and Telecom
- Healthcare and Life Sciences
- Education and Research
- Other End-User Industries
- By Simulation Type
- Finite-Element Analysis (FEA)
- Computational Fluid Dynamics (CFD)
- Multibody and Dynamics
- Discrete-Event and Process Simulation
- Electromagnetic and RF
- System-Level and 1-D
- By Application Area
- Product Design and Engineering
- Research and Development / Innovation
- Process and Operations Optimization
- Training, Safety and Digital Mock-Up
- Digital Twin Lifecycle Management
- By Component
- Software Licences
- Services and Consulting
- Platform and Integration
- By Geography
- North America
- United States
- Canada
- Mexico
- South America
- Brazil
- Argentina
- Rest of South America
- Europe
- Germany
- United Kingdom
- France
- Italy
- Netherlands
- Russia
- Rest of Europe
- Asia Pacific
- China
- Japan
- India
- South Korea
- ASEAN
- Rest of Asia Pacific
- Middle East
- United Arab Emirates
- Saudi Arabia
- Rest of Middle East
- Africa
- South Africa
- Nigeria
- Rest of Africa
- North America
Data Sources, Market Sizing, and Validation
Desk Research
Desk research was used to set the market boundary, build the initial demand and supply logic, and document assumptions that can be traced to public evidence. We relied on public sources such as US Bureau of Economic Analysis data on software spending, US Census trade statistics where relevant for software services, Eurostat industry indicators, World Bank macro series, and OECD digital economy publications to ground the regional demand pool.
To link the market to real adoption signals, we also reviewed sources such as patent databases for simulation related filings, regulator and standards body publications where simulation is used for verification, and peer reviewed engineering journals that discuss solver usage trends. These were supplemented with company annual reports, earnings call transcripts, product literature, and reputable press coverage, then cross checked with paid subscriptions for company financials and news intelligence. We also used a patent database to check citation patterns and whether they align with the solver based scope. This list is illustrative only, since many other public and internal reference sources were also consulted during data collection and validation.
Primary Interviews and Surveys
Primary interviews and surveys were used to pressure test the model and narrow variables that are hard to lock using only public data, especially pricing, deployment mix, and how services get bundled with licenses. We spoke with software publishers, channel partners, system integrators, and enterprise users across APAC, EMEA, and the Americas so that regional buying cycles and vertical level demand differences were reflected in the final assumptions.
Distribution of primary research fieldwork respondents
| Company type | Respondent position | Region |
|---|---|---|
| Top tier: 39% | CXOs: 12% | APAC: 46% |
| Mid tier: 42% | Functional/Unit leaders: 35% | EMEA: 35% |
| Smaller Players: 19% | Managers: 53% | Americas: 19% |
Market-Sizing & Forecasting
Market sizing starts with a top-down build where software spend and engineering intensity signals are reconstructed into an addressable pool for simulation use, and then filtered by adoption indicators by industry and region. That result is checked with selective bottom-up approximations using sampled vendor revenue splits, channel feedback on deal sizes, and ASP times volume logic for key license and subscription bundles, which helps adjust for under or over counting.
Inputs used in the model include the mix shift from perpetual licenses to subscription, cloud versus on premises deployment share, average contract duration and renewal behavior, services attachment rate, and sector level engineering activity (such as vehicle, aerospace, and industrial production cycles). For forecasting, we used scenario analysis supported by simple multivariate relationships between software spending growth, industrial output trends, and cloud adoption, then aligned the output with the consensus ranges heard in expert calls. Where a supplier roll-up could not be cleanly separated by simulation only revenue, gaps were handled through conservative allocation rules and then rechecked during interviews.
Data Validation & Update Cycle
Validation is done by comparing modeled totals against independent signals, such as software spending trends, disclosed segment commentary, and region wise demand patterns that show up in adoption discussions. If a region or vertical moves outside expected ranges, the assumptions are revisited, outliers are challenged, and follow up outreach is triggered to understand what changed.
Before sign-off, the workbook goes through multiple analyst reviews that focus on unit consistency, pricing logic, currency conversions, and year over year movement checks. Reports are refreshed annually, and interim updates are made when material events affect spending or licensing behavior. Prior to delivery, the model is reviewed again so clients receive the latest updated view based on the newest available public data and feedback.
Mordor Intelligence's Simulation Software Market Size Measured Against Other Published Estimates
Published market sizes for simulation software can look far apart because the inputs behind them are not always aligned, even when the titles sound similar. Differences usually come from how licenses versus services are counted, how cloud subscriptions are annualized, and which adjacent tools are allowed into the scope.
A second driver is timing, since currency conversion dates and price uplift assumptions can shift the total meaningfully when contracts are global and multi year. When ASPs are assumed to rise quickly without being rechecked against renewal behavior, or when estimates are not revisited after major pricing and packaging changes, the spread across published figures becomes wider.
Benchmark comparison
| Source | Market Size | Gaps in Research Methodology |
|---|---|---|
| Mordor Intelligence | USD 15.46 B (2026) | |
| Global Consultancy A | USD 26.58 B (2025) | Uses an earlier base year and a broader revenue frame that can pull in adjacent digital engineering and analytics software, and it is not always clear how multi year subscriptions are normalized to annual revenue. |
| Industry Publisher B | USD 14.59 B (2024) | Starts from a lower base year and applies a faster growth curve, which can reflect more aggressive ASP progression and a different split of services versus software in the counted revenue. |
What the table shows is that refresh cadence, currency timing, and how subscription ASPs are annualized can shift the market total even before growth assumptions are debated, and those checks are explicitly re-run in Mordor Intelligence. With the scope kept tight around simulation solvers and closely linked revenue, the outcome stays traceable to clear drivers that can be repeated and explained.


Key Questions Answered in the Report
What is the current value of the simulation software market?
The market is worth USD 15.46 billion in 2026.
How fast is the sector growing?
Revenue is forecast to expand at a 13.08% CAGR through 2031.
Which region shows the highest growth momentum?
Asia Pacific is advancing at a 14.60% CAGR owing to electric-vehicle and smart-factory investments.
Why are digital twins important for asset operators?
They combine real-time sensor data with physics models to predict failures and extend maintenance intervals, as demonstrated at gas-turbine plants.
What challenge limits adoption among small manufacturers?
The high total cost of GPU-based HPC clusters and ongoing electricity expenses impede large-scale simulation use.
How is AI reshaping simulation workflows?
Generative models now propose design geometries that meet load targets, allowing engineers to evaluate thousands of options in minutes before running full-fidelity validation.
Page last updated on:


