Set-Top Box Market Size and Share
Market Overview
| Study Period | 2020 - 2031 |
|---|---|
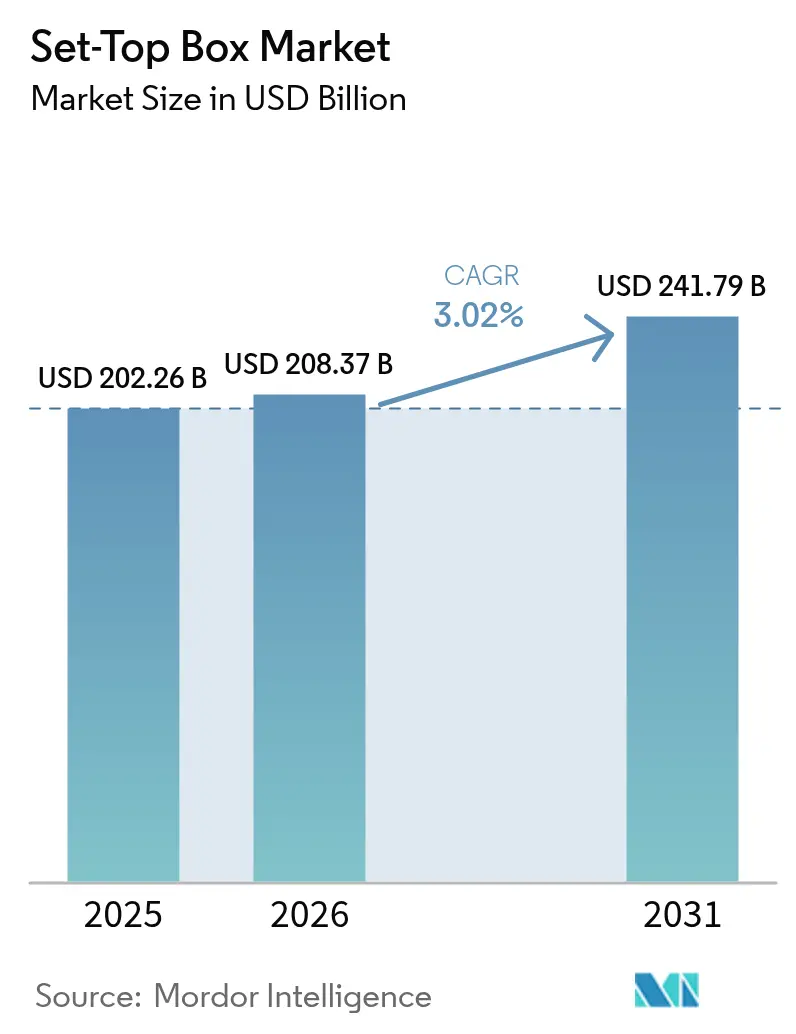
| Market Size (2026) | USD 208.37 Billion |
| Market Size (2031) | USD 241.79 Billion |
| Growth Rate (2026 - 2031) | 3.02% CAGR |
| Fastest Growing Market | Asia Pacific |
| Largest Market | North America |
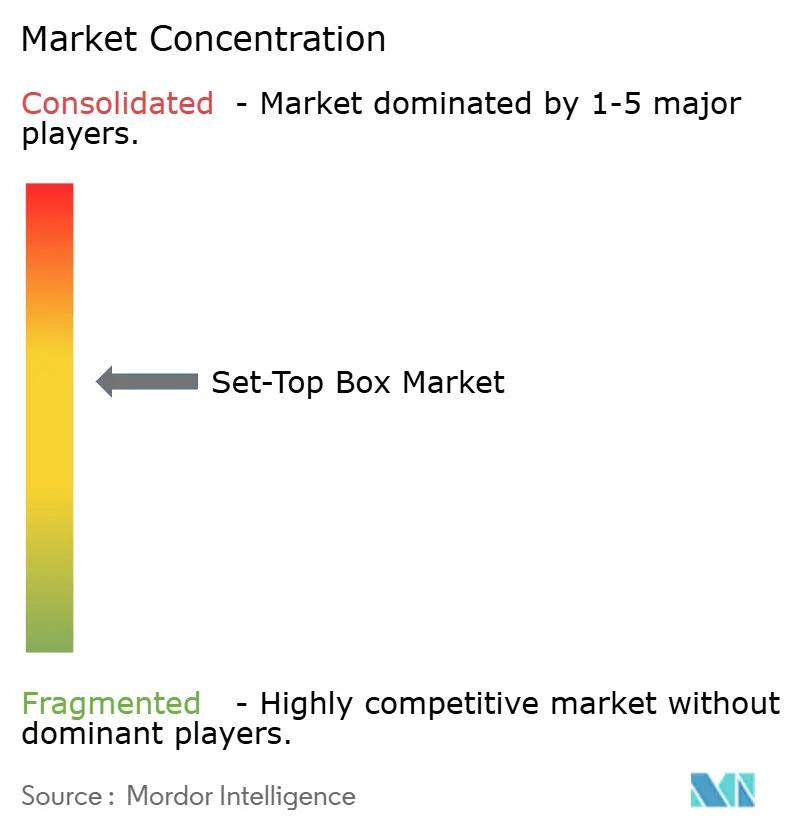
| Market Concentration | Medium |
Major Players *Disclaimer: Major Players sorted in no particular order Image © Mordor Intelligence. Reuse requires attribution under CC BY 4.0. | |
Set-Top Box Market Analysis by Mordor Intelligence
The set-top box market size was valued at USD 202.26 billion in 2025 and estimated to grow from USD 208.37 billion in 2026 to reach USD 241.79 billion by 2031, at a CAGR of 3.02% during the forecast period (2026-2031). Fibre-to-the-home deployments in Europe and the Asia Pacific are accelerating the shift from satellite receivers to internet-protocol and hybrid architectures, while North American cable operators offset subscriber losses with higher average selling prices for 4K units. Operator adoption of Android TV and Reference Design Kit middleware compresses development cycles, lowers operating expenses, and enables over-the-air feature updates. Growing catalogues of 4K and high-dynamic-range sports content ahead of the 2026 FIFA World Cup and 2028 Olympic Games spur demand for ultra-high-definition devices. At the same time, stricter European Union Ecodesign and Waste Electrical and Electronic Equipment rules increase compliance costs, prompting vendors to redesign power supplies and improve energy efficiency.
Key Report Takeaways
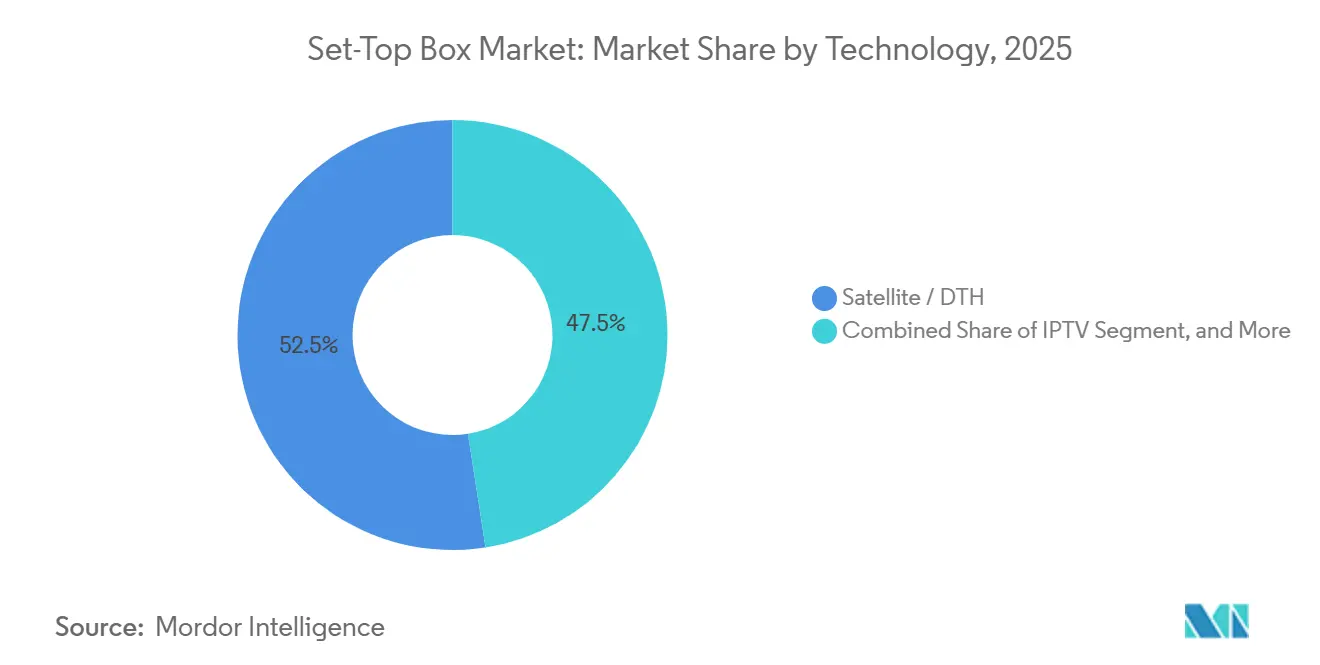
- By technology, satellite and direct-to-home platforms led the set-top box market with 52.46% market share in 2025, while internet protocol television is forecast to expand at a 3.82% CAGR through 2031.
- By resolution, high-definition receivers commanded 48.32% of the set-top box market share in 2025, whereas ultra-high-definition and 4K devices are projected to grow at a 3.66% CAGR over 2026-2031.
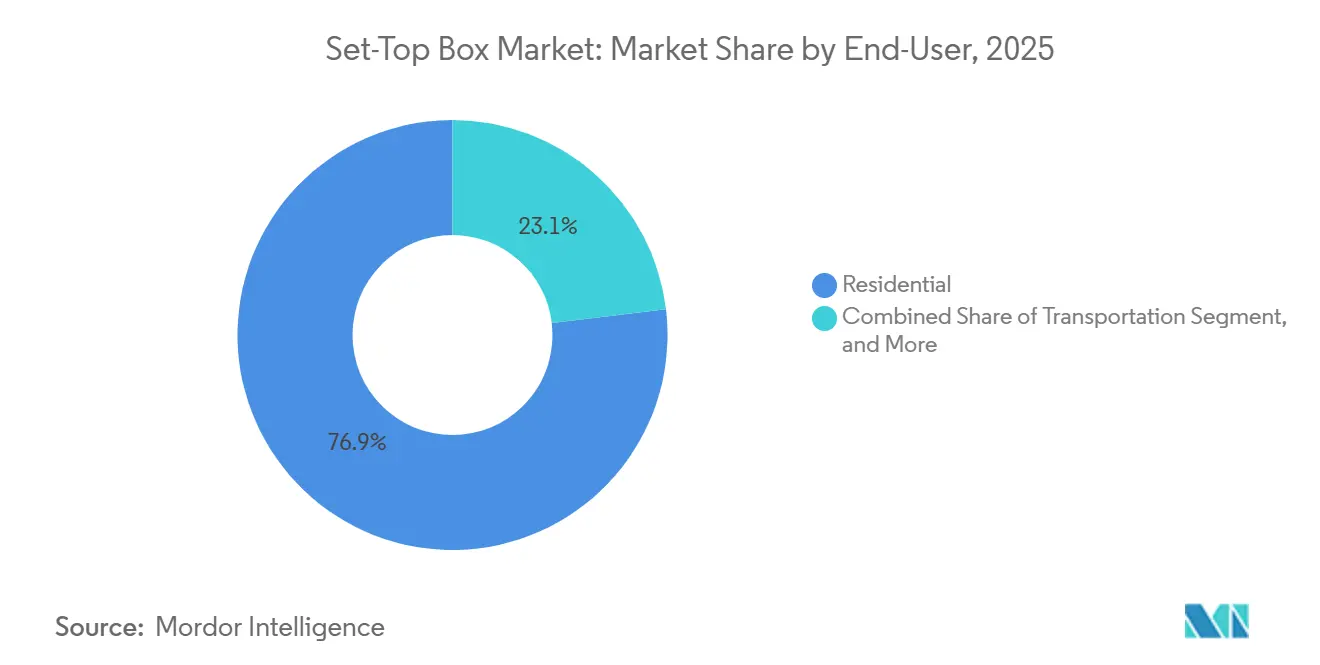
- By end user, residential subscribers accounted for 76.91% of the set-top box market share in 2025, yet the transportation segment is poised to grow at a 3.86% CAGR during the forecast period.
- By operating system, Android TV captured 47.83% revenue share in 2025 and is expected to rise at a 3.89% CAGR through 2031.
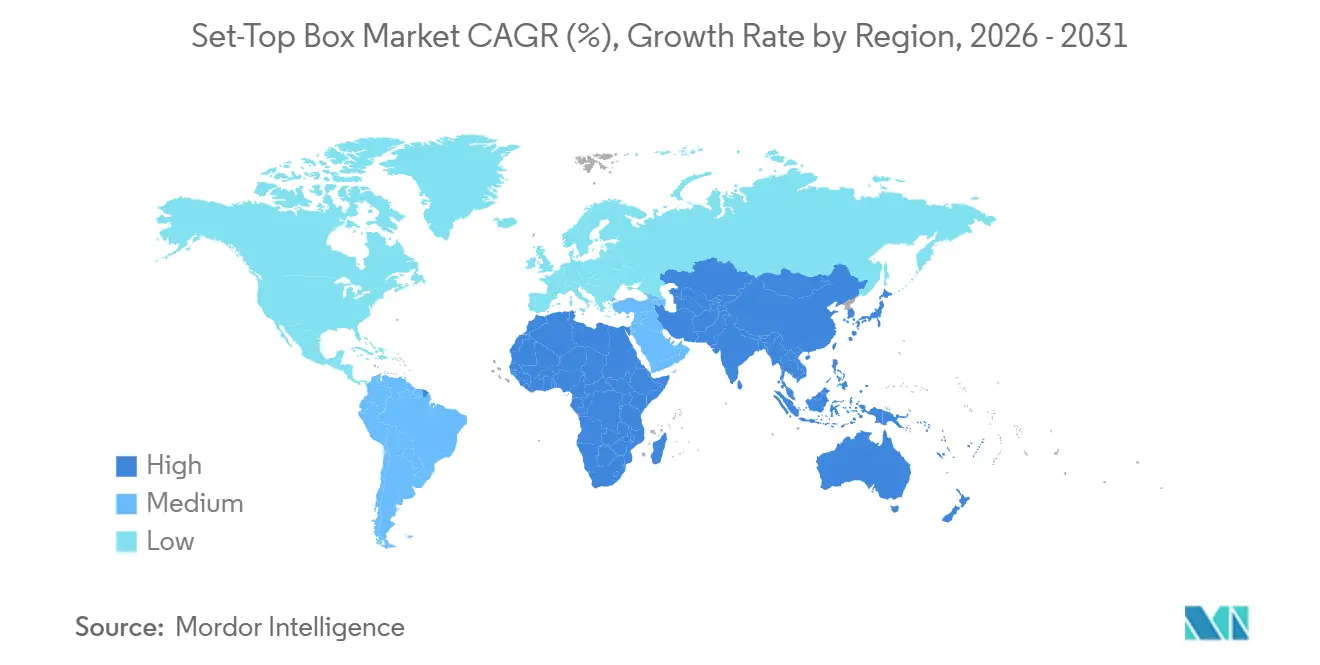
- By geography, North America accounted for 33.67% of the set-top box market share in 2025, but the Asia Pacific is set to record the fastest regional growth at a 4.11% CAGR from 2026-2031.
Note: Market size and forecast figures in this report are generated using Mordor Intelligence’s proprietary estimation framework, updated with the latest available data and insights as of 2026.
Global Set-Top Box Market Trends and Insights
Drivers Impact Analysis*
| Driver | (~) % Impact on CAGR Forecast | Geographic Relevance | Impact Timeline |
|---|---|---|---|
| Fibre-Backed Migration to IP/Hybrid STBs | +0.9% | Europe, Asia Pacific core, spill-over to North America | Medium term (2-4 years) |
| Open-Source RDK and Android TV Lowering Opex | +0.7% | Global, with early gains in Europe, North America, India | Short term (≤ 2 years) |
| Digitisation Stimulus in Africa and South-East Asia | +0.6% | Africa (Nigeria, Kenya, South Africa), Southeast Asia (Indonesia, Philippines, Vietnam) | Long term (≥ 4 years) |
| 4K and HDR Sports Channels Ahead of Mega-Events | +0.5% | Global, concentrated in Europe, North America, Middle East | Short term (≤ 2 years) |
| Bundled OTT Aggregation in Emerging-Market DTH | +0.4% | Asia Pacific, Middle East and Africa, South America | Medium term (2-4 years) |
| ESG-Driven Low-Power CPE Refresh Cycles | +0.3% | Europe, North America, select Asia Pacific markets | Long term (≥ 4 years) |
| Source: Mordor Intelligence | |||
Fibre-Backed Migration to IP/Hybrid STBs
Fibre-to-the-home penetration exceeded 50% of broadband households in France, Spain, and Portugal by mid-2025, letting operators retire copper and shift video from satellite multicast to internet-protocol unicast. BT Group’s plan to shut the public-switched telephone network by January 2027 forces millions of United Kingdom viewers to upgrade to IP or hybrid receivers.[1]BT Group, “Annual Report and Form 20-F 2024/25,” bt.com Hybrid boxes eliminate dish-installation costs, leverage existing home gateways, and support terrestrial free-to-air fallback, thereby reducing subsidies. Openreach counted 15 million fibre premises at end-2025, translating into an expected 8 million legacy-box replacements over 2026-2028. Ireland’s regulator now requires fixed-wireless operators to offer hybrid broadcast-broadband compatibility, cementing demand for dual tuners.
Open-Source RDK and Android TV Lowering Opex
Reference Design Kit middleware and Android TV shorten product cycles from 18 months to under 12 months and cut middleware fees by roughly 30-40% compared with proprietary stacks. Liberty Global rolled out RDK boxes across Virgin Media O2 in 2024, enabling remote interface updates that reduced field service calls.[2]Liberty Global, “Investor Presentation Q4 2024,” libertyglobal.com Comcast reported a 25% drop in customer-care calls after deploying its RDK-based Flex streaming device. In India, Tata Play’s Android hybrid launched in late 2024 and reached 1.2 million activations by December 2025, proving the appeal of pre-loaded apps. Voice-assistant integration and Google Play access make Android TV especially attractive to younger subscribers, lowering churn.
Digitisation Stimulus in Africa and South-East Asia
Mandated analog switch-offs continue to spur volume. Nigeria’s regulator distributed about 3 million subsidized receivers ahead of its revised December 2024 deadline.[3]National Broadcasting Commission of Nigeria, “Digital Switchover Progress Report 2024,” nbc.gov.ng Kenya’s digital-television penetration climbed to 78% by March 2025, up from 65% in 2023, driven by low-cost terrestrial boxes. Indonesia earmarked IDR 500 billion (USD 32 million) in 2024 to connect 5 million rural households by 2026. The Philippines finalized DTT standards in mid-2024, opening public tenders for compliant receivers. These programs expand the entry-level addressable base and set up replacement demand once initial grants expire.
4K and HDR Sports Channels Ahead of Mega-Events
Broadcasters are racing to air premium tournaments in ultra-high definition. Sky Deutschland launched 4K HDR Bundesliga and UEFA Champions League feeds in March 2025. North American retailers logged 18% year-over-year growth in 4K-capable box sales during 2025 promotions tied to the 2026 World Cup. Although the European Broadcasting Union scaled some UEFA streams down to 1080p HDR in late 2024 due to capacity issues, overall bandwidth investment remains on track. Chipset suppliers benefit because 4K decoding demands advanced system-on-chip designs that command higher margins. As households upgrade televisions, they often opt for operator-supplied 4K receivers to guarantee compatibility.
Restraints Impact Analysis*
| Restraint | (~) % Impact on CAGR Forecast | Geographic Relevance | Impact Timeline |
|---|---|---|---|
| Cord-Cutting in North America and Western Europe | -0.8% | North America, Western Europe | Short term (≤ 2 years) |
| Grey-Market IPTV Piracy Devices | -0.4% | Global, concentrated in Europe, North America, Asia Pacific | Medium term (2-4 years) |
| Semiconductor Cost Inflation | -0.3% | Global | Short term (≤ 2 years) |
| Strict E-Waste Take-Back Mandates | -0.2% | Europe, select Asia Pacific markets | Long term (≥ 4 years) |
| Source: Mordor Intelligence | |||
Cord-Cutting in North America and Western Europe
Pay-television households in the United States shrank by about 4.8 million in 2025, continuing multiyear declines. Comcast and Charter each posted double-digit video-subscriber losses, while the United Kingdom shed 1.2 million pay-TV homes the same year. Streaming-only bundles bypass proprietary receivers, eroding unit shipments and forcing operators to launch stripped-down broadband-plus-streaming plans that often rely on consumer-purchased devices. Manufacturers, in response, pivot toward lower-margin hybrid IP units.
Grey-Market IPTV Piracy Devices
Enforcement agencies confiscated more than 50,000 illegal Android boxes in the United Kingdom in March 2025, arresting 12 individuals tied to piracy networks. The European Union Intellectual Property Office estimated 2024 piracy losses to audiovisual industries at EUR 1 billion (USD 1.1 billion). These devices, sold at deep discounts, attract price-sensitive consumers, depressing legitimate demand. Content owners invest in stronger digital rights management, yet cross-border enforcement continues to lag behind the rapid proliferation of grey-market streams.
*Our forecasts treat driver/restraint impacts as directional, not additive. The impact forecasts reflect baseline growth, mix effects, and variable interactions.
Segment Analysis
By Technology: Satellite Anchors Revenue, IP Gains Share
Satellite and direct-to-home platforms accounted for 52.46% of the set-top box market share in 2025, reflecting entrenched rural coverage and emerging-market uptake. However, internet protocol television is forecast to record the fastest growth at 3.82% through 2031 as operators exploit fibre and 5G fixed wireless networks. Cable receivers continue to retreat in North America and Western Europe, though Latin American operators still deploy units for multi-dwelling complexes. Terrestrial-digital and hybrid devices appeal to European viewers who demand free-to-air channels alongside streaming services, leveraging Hybrid Broadcast Broadband TV standards for seamless switching.
Satellite’s resilience stems from India, Brazil, and Gulf Cooperation Council nations, where fibre remains uneven. Tata Play and Dish TV India together served more than 50 million active subscribers at the end of 2025. Even so, Comcast earmarked 60% of its 2025 video infrastructure capital expenditure for IP platforms, signaling a structural pivot. Hybrid terrestrial-IP boxes in France and Spain offset cable attrition in Germany and the United Kingdom. As operators migrate middleware to cloud back ends, software-defined features further erode satellite’s long-term cost advantage, intensifying the shift toward IP.


By Resolution: UHD Adoption Tracks Premium Content
High-definition receivers accounted for 48.32% of revenue in 2025, but ultra-high-definition and 4K devices are projected to grow at 3.66% between 2026-2031. Cost-sensitive regions still rely on standard-definition boxes. However, with the rise of 4K sporting events and scripted series, households are increasingly upgrading to advanced set-top boxes. This shift is largely driven by the inability of older HD silicon to decode HEVC or AV1 4K streams, which are essential for delivering high-quality 4K content. The growing availability of 4K content further accelerates this transition, as consumers seek enhanced viewing experiences.
Despite bandwidth limitations causing some UEFA broadcasts to revert to 1080p HDR, Sky Deutschland's March 2025 4K package underscores operators' willingness to invest in premium content. Standard-definition’s footprint will shrink as governments conclude analog switch-offs and as entry-level chipsets incorporate HD decoding at negligible premiums. Commercial hospitality still values HD for reliability, but rising guest expectations and energy-efficient 4K panels will gradually tip procurement toward UHD hardware.
By End-User: Transportation Emerges As Growth Pocket
Residential demand accounted for 76.91% of sales in 2025, a figure that will rise only modestly as cord-cutting offsets emerging-market subscriber additions. In contrast, transportation is forecast to expand at a 3.86% CAGR to 2031 as airlines, rail companies, and cruise lines invest in Android-based seatback and cabin streaming.
Panasonic Avionics and Thales introduced Android platforms in 2024, enabling passenger-owned device casting and reducing reliance on embedded hard drives. Deutsche Bahn began trialing seatback 4K displays in June 2024, and Japan Railways East tested similar hardware on Shinkansen services. Commercial hospitality and campus networks migrate to multicast IP head-ends, but budget-constrained government and education segments grow slowly due to lengthy procurement cycles.
By Operating System: Android TV Consolidates Operator Preference
Android TV led with 47.83% revenue in 2025 and is projected to rise 3.89% through 2031, the fastest among software stacks. The platform offers pre-integrated streaming apps, voice assistants, and a smartphone-like interface that eases user onboarding. The Reference Design Kit offers greater customization but requires greater engineering resources. Proprietary Linux variants, once dominant among satellite broadcasters, now face attrition as viewers expect rich app ecosystems.
Sky UK’s Sky Glass and Sky Stream, refreshed in 2024, run Android TV and helped drive a 15% lift in streaming-only subscribers by December 2025. Tata Play’s Android hybrid further validates the model. RDK remains attractive for North American cable groups seeking royalty-free control, yet its fragmented silicon ecosystem slows feature uniformity. Niche operating systems persist only in specialized medical or governmental deployments requiring locked-down firmware.
Geography Analysis
North America accounted for 33.67% of global revenue in 2025. Despite premium pricing, regional growth will lag the global average because cord-cutting reduces unit shipments, and operators pivot to IP dongles. United States cable leaders Comcast and Charter lost more than 3 million video customers in 2025, while Canada’s competitive landscape drives smaller operators toward low-cost Android receivers. Mexico’s América Móvil and Televisa are transitioning satellite subscribers to IP services to save on transponder costs.
Asia Pacific is forecast to post the fastest expansion at 4.11% CAGR between 2026-2031, underpinned by India’s 62 million direct-to-home subscribers, China’s 300 million-plus IPTV households, and aggressive terrestrial-digital migrations in Indonesia and the Philippines. Japan and South Korea focus on 8K and smart-home integration rather than volume, yet still refresh high-end hardware. Average selling prices remain well below North America because devices omit integrated DVRs and target price-sensitive consumers.
Europe shows split momentum. The United Kingdom and Germany confront subscriber erosion, but France, Spain, and Italy leverage fibre rollouts to replace legacy boxes with hybrid IP receivers. France’s fibre coverage surpassed 60% by mid-2025, enabling telcos to bundle free-to-air terrestrial channels with subscription streaming. New Ecodesign rules cap standby power at 0.5 watts, raising engineering costs yet unlocking energy-saving marketing angles.
South America’s outlook depends on macro stability. Brazil’s pay-TV base slipped 5% in 2025 amid inflation, though sheer population size safeguards baseline demand. Argentina’s peso depreciation inflates import prices, delaying upgrades. Middle East satellite incumbents retain loyal sports audiences, and Saudi Arabia’s Vision 2030 broadband goals will enable hybrid receivers in secondary cities. Africa saw an order spike during Nigeria and Kenya's switchovers, but it will cool once subsidies lapse and urban youth turn to smartphone streaming.

Competitive Landscape
The set-top box market shows moderate concentration, with Vantiva, Samsung Electronics, Huawei Technologies, Skyworth Digital, and Humax Holdings collectively controlling roughly 45-50% of global shipments. Competition revolves around lowering bill-of-materials costs, shortening design cycles, and embedding advanced chipsets that handle 4K and high-dynamic-range decoding. Vendors also race to secure integration with operator cloud DVR back ends, which lock in recurring service revenue. Regional specialists, including Netgem in Europe and AirTies in the Middle East and Africa, fill gaps that tier-one vendors overlook, keeping overall pricing pressure high. Contract manufacturers in China and Vietnam further intensify rivalry by offering white-label Android TV boxes at sub-USD 40 factory pricing.
Market leaders are adapting through targeted partnerships and platform investments. Vantiva signed a multiyear supply pact with Broadcom in 2025 to co-develop 6-nanometer system-on-chip designs optimized for fibre and Wi-Fi 7 gateways, giving it an early silicon edge for hybrid devices. Samsung bundled its own memory and display panels into premium 4K receivers for Korean and U.S. operators, trimming component procurement times by up to 20%. Huawei expanded its HarmonyOS-based set-top portfolio for Chinese provincial IPTV platforms, aligning software updates with its 5G fixed-wireless gateways to cross-sell network gear. Skyworth and Humax focused on ready-made Android TV reference designs that enable small- and mid-size pay-TV providers to launch new user interfaces in under 6 months, preserving volume in price-sensitive markets.
A wave of disruptors is reshaping economics. Roku and Amazon have begun offering advertising-funded streaming devices to operators at near-zero hardware margins, prompting incumbents to explore similar ad-supported tiers. Comcast, Liberty Global, and Charter Communications continue to support the open-source Reference Design Kit, pooling engineering resources to reduce middleware royalties and accelerate feature rollouts. Airlines, railways, and hospitality chains present attractive niches where Android-based seatback or in-room clients replace proprietary systems, inviting new entrants with consumer-electronics agility. As interoperability standards such as IEC 62002 lower switching costs for operators, price competition will likely stiffen, yet brand credibility, scale procurement, and vertically integrated silicon remain decisive advantages for the leading five vendors.
Set-Top Box Industry Leaders
Vantiva SA
Samsung Electronics Co., Ltd.
Huawei Technologies Co., Ltd.
Skyworth Digital Technology Co., Ltd.
ZTE Corporation
- *Disclaimer: Major Players sorted in no particular order

Recent Industry Developments
- March 2025: Sky Deutschland introduced a 4K HDR sports tier covering Bundesliga and UEFA Champions League matches, stimulating 4K replacement demand among premium subscribers.
- March 2025: The United Kingdom Intellectual Property Office seized over 50,000 illegal streaming boxes, highlighting the ongoing battle against piracy devices that erode legitimate demand.
- February 2025: Ireland’s communications regulator mandated hybrid broadcast-broadband compatibility for fixed-wireless operators, opening a fresh channel for dual-tuner devices.
- January 2025: Tata Play announced that its Android hybrid box, launched in Oct 2024, surpassed 1.2 million activations, underlining the success of bundling satellite channels with leading streaming apps.


Global Set-Top Box Market Report Scope
The Set-Top Box Market Report is Segmented by Technology (Satellite/DTH, Cable, IPTV, DTT/Hybrid), Resolution (SD, HD, UHD/4K and Higher), End-User (Residential, Commercial/Hospitality, Government and Education, Transportation), Operating System (Android TV, RDK, Proprietary Linux, Other Operating Systems), and Geography (North America, Europe, Asia Pacific, Middle East, Africa, South America). Market Forecasts are Provided in Terms of Value (USD).
| Satellite / DTH |
| Cable |
| IPTV |
| DTT / Hybrid |
| SD |
| HD |
| UHD / 4K and Higher |
| Residential |
| Commercial / Hospitality |
| Government and Education |
| Transportation |
| Android TV |
| RDK |
| Proprietary Linux |
| Other Operating Systems |
| North America | United States | |
| Canada | ||
| Mexico | ||
| South America | Brazil | |
| Argentina | ||
| Rest of South America | ||
| Europe | United Kingdom | |
| Germany | ||
| France | ||
| Italy | ||
| Rest of Europe | ||
| Asia-Pacific | China | |
| Japan | ||
| India | ||
| South Korea | ||
| Rest of Asia-Pacific | ||
| Middle East and Africa | Middle East | United Arab Emirates |
| Saudi Arabia | ||
| Turkey | ||
| Rest of Middle East | ||
| Africa | South Africa | |
| Egypt | ||
| Rest of Africa | ||
| By Technology | Satellite / DTH | ||
| Cable | |||
| IPTV | |||
| DTT / Hybrid | |||
| By Resolution | SD | ||
| HD | |||
| UHD / 4K and Higher | |||
| By End-User | Residential | ||
| Commercial / Hospitality | |||
| Government and Education | |||
| Transportation | |||
| By Operating System | Android TV | ||
| RDK | |||
| Proprietary Linux | |||
| Other Operating Systems | |||
| By Geography | North America | United States | |
| Canada | |||
| Mexico | |||
| South America | Brazil | ||
| Argentina | |||
| Rest of South America | |||
| Europe | United Kingdom | ||
| Germany | |||
| France | |||
| Italy | |||
| Rest of Europe | |||
| Asia-Pacific | China | ||
| Japan | |||
| India | |||
| South Korea | |||
| Rest of Asia-Pacific | |||
| Middle East and Africa | Middle East | United Arab Emirates | |
| Saudi Arabia | |||
| Turkey | |||
| Rest of Middle East | |||
| Africa | South Africa | ||
| Egypt | |||
| Rest of Africa | |||


Key Questions Answered in the Report
What is the projected revenue for the set-top box sector by 2031?
The set-top box market size is forecast to reach USD 241.79 billion by 2031.
How fast will internet-protocol television devices grow compared with satellite units?
IPTV receivers are expected to expand at 3.82% CAGR through 2031, outpacing satellite devices, which face slower growth as fibre coverage rises.
Which operating system leads current deployments?
Android TV held 47.83% share in 2025 and is on track to widen its lead owing to a pre-loaded app ecosystem and voice-assistant integration.
Why are transportation applications seen as a growth area?
Airlines, rail lines, and cruise operators are installing Android seatback or cabin streaming platforms, pushing the transportation segment to a projected 3.86% CAGR over 2026-2031.
How do new Ecodesign rules affect device design?
European Union limits of 0.5 watt maximum standby power require more efficient chipsets and power supplies, raising development costs but enabling operators to market greener hardware.
What regions will contribute most to future unit growth?
Asia Pacific, led by India’s direct-to-home refresh cycles and China’s IPTV expansions, is expected to post the fastest regional growth at a 4.11% CAGR.
Page last updated on:


