
Semiconductor CVD Equipment Market Size and Share
Market Overview
| Study Period | 2020 - 2031 |
|---|---|
| Market Size (2026) | USD 16.71 Billion |
| Market Size (2031) | USD 21.96 Billion |
| Growth Rate (2026 - 2031) | 5.62 % |
| Fastest Growing Market | Asia Pacific |
| Largest Market | Asia Pacific |
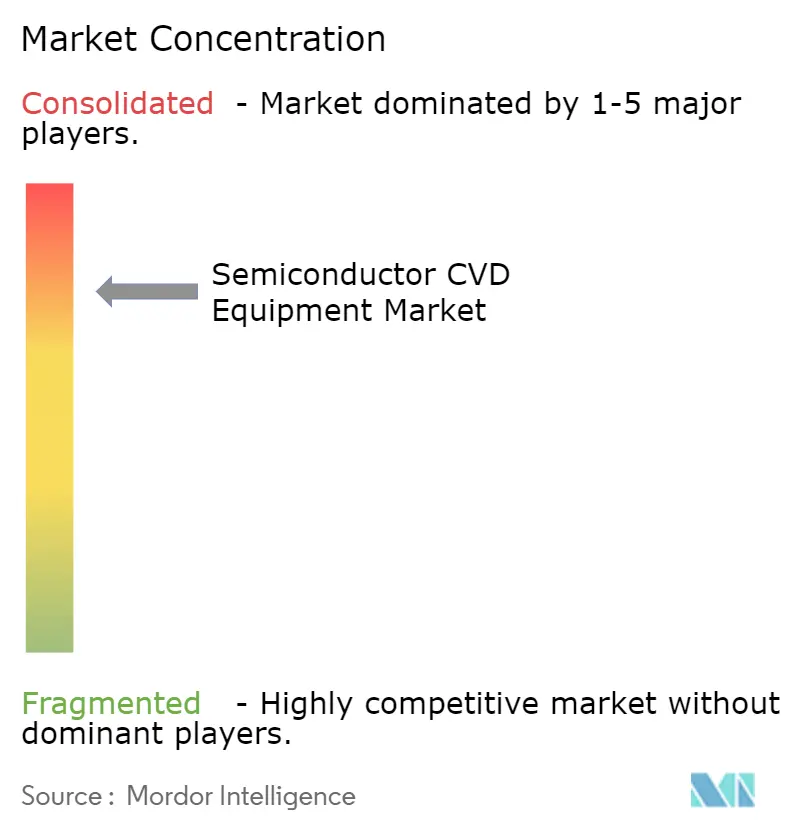
| Market Concentration | High |
Major Players *Disclaimer: Major Players sorted in no particular order Image © Mordor Intelligence. Reuse requires attribution under CC BY 4.0. | |
Semiconductor CVD Equipment Market Analysis by Mordor Intelligence
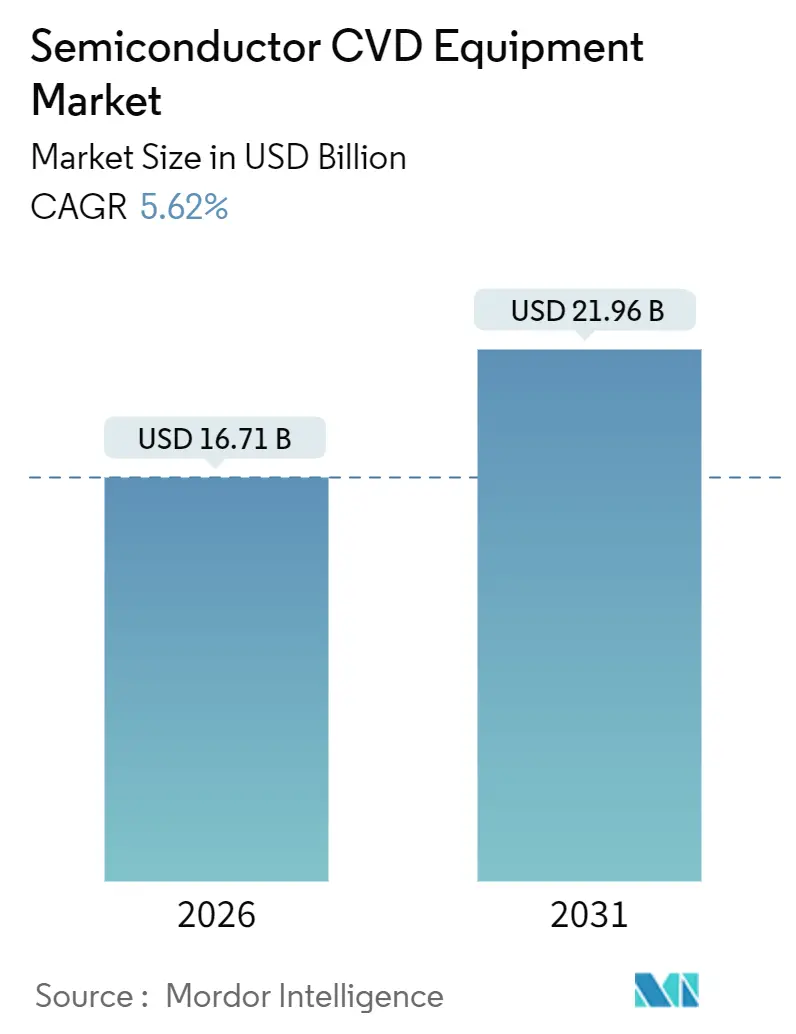
The Semiconductor CVD Equipment Market size is estimated at USD 16.71 billion in 2026, and is expected to reach USD 21.96 billion by 2031, at a CAGR of 5.62% during the forecast period (2026-2031).
Strong capital-expenditure plans for sub-3-nanometer logic, silicon-carbide and gallium-nitride power semiconductors, and greater than 300-layer 3D-NAND collectively underpin three-quarters of new tool shipments. The semiconductor chemical vapor deposition equipment market is also benefiting from CHIPS-style incentives that have unlocked 27 greenfield fab announcements since 2024, while hybrid ALD-CVD platforms are expanding their addressable market as gate-all-around transistors become mainstream. On the supply side, Applied Materials, Lam Research, and Tokyo Electron continue to refine plasma-source designs and precursor-delivery controls that extend aspect-ratio capabilities beyond 100:1, yet Chinese entrants are winning mature-node orders by pricing 30-40% below Western peers. Tool cost inflation and tightening export rules remain the two structural headwinds that moderate the overall growth trajectory.
Key Report Takeaways
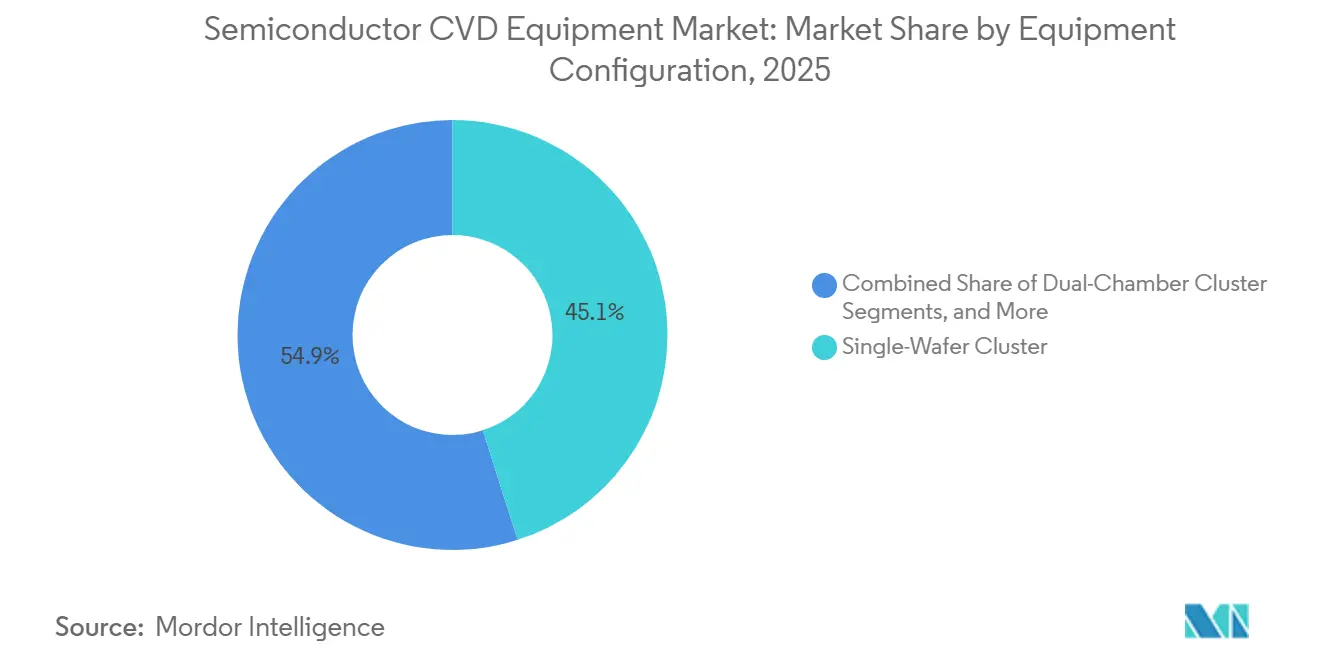
- By equipment configuration, single-wafer clusters commanded 45.09% of the semiconductor CVD equipment market size in 2025, whereas batch vertical furnaces are advancing at a 6.18% CAGR through 2031.
- By wafer size, 300 millimeter tools dominated with 69.34% of revenue in 2025 and the nascent 450 millimeter category is projected to expand at a 5.81% CAGR.
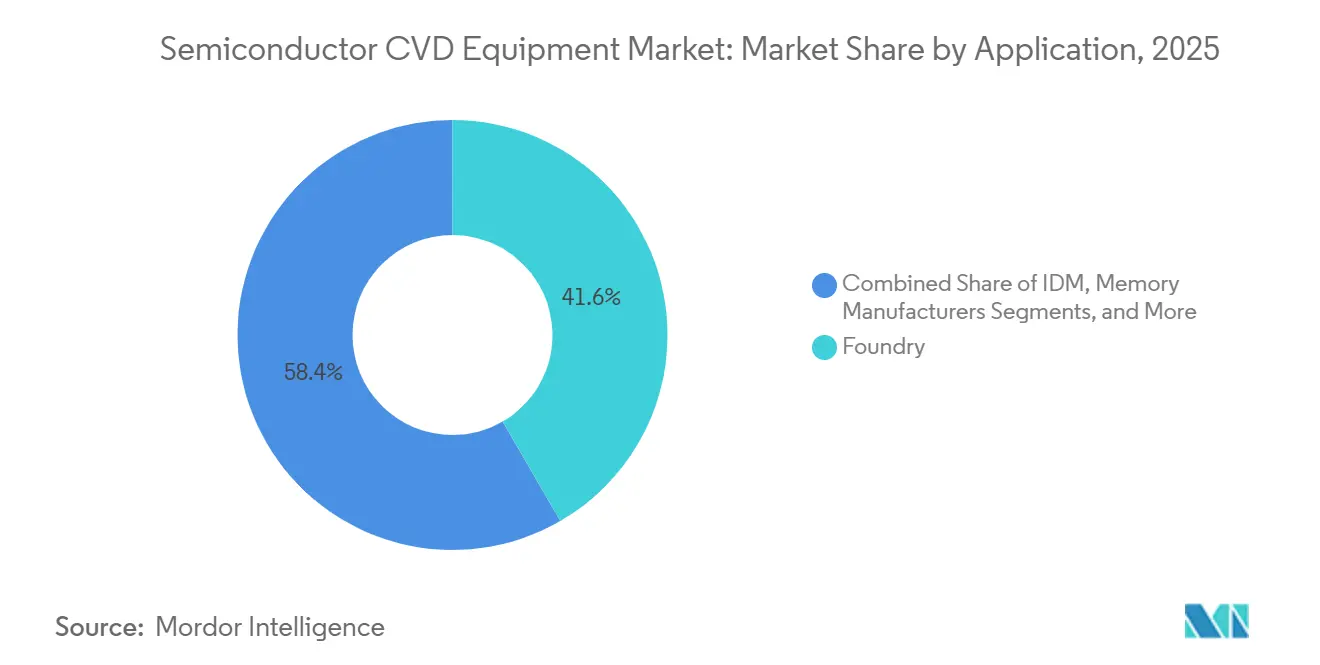
- By application, foundries held 41.64% of 2025 revenue; power and analog fabs represent the fastest-growing segment at a 6.04% CAGR toward 2031.
- By end-user type, pure-play foundries generated 52.61% of demand in 2025, while fabless and R&D institutes are expected to grow at a 6.66% CAGR.
- By geography, Asia-Pacific secured 47.57% of 2025 revenue and is projected to accelerate at a 7.83% CAGR through 2031.
Note: Market size and forecast figures in this report are generated using Mordor Intelligence’s proprietary estimation framework, updated with the latest available data and insights as of January 2026.
Global Semiconductor CVD Equipment Market Trends and Insights
Drivers Impact Analysis*
| Driver | (~)% Impact on CAGR Forecast | Geographic Relevance | Impact Timeline |
|---|---|---|---|
| Intensifying 2-nm-and-below logic node race drives higher ALD and CVD tool counts | +1.2% | Asia-Pacific (Taiwan, South Korea), North America | Medium term (2-4 years) |
| Explosive SiC/GaN power-device capex for EV and renewables | +1.0% | Global, with concentration in Asia-Pacific, Europe, North America | Long term (≥4 years) |
| 3D-NAND greater-than-400-layer roadmaps need ultra-high-AR gap-fill systems | +0.9% | Asia-Pacific (South Korea, Japan, China) | Medium term (2-4 years) |
| CHIPS-style incentives spawning greater than 30 new green-field fabs worldwide | +0.8% | North America, Europe, Asia-Pacific | Long term (≥4 years) |
| AI-enabled process-control lowers CoO, boosting retrofit demand | +0.6% | Global | Short term (≤2 years) |
| Sub-fab energy-recovery mandates favour low-emission PECVD lines | +0.4% | Europe, North America, select Asia-Pacific markets | Medium term (2-4 years) |
| Source: Mordor Intelligence | |||


Intensifying 2 nm And Below Logic-Node Race Drives Higher ALD And CVD Tool Counts
Gate-all-around architectures below the 2-nanometer threshold add 40-50% more deposition steps than FinFET predecessors, lifting tool intensity per wafer starts by roughly 1.8x. TSMC’s N2 process, in high-volume manufacturing since late 2025, relies on cyclic plasma-enhanced ALD for high-k dielectrics and selective tungsten CVD for contacts, whereas Samsung integrates backside power delivery that inserts repeat planarization-and-re-deposit loops. Intel’s 18A node, slated for the second half of 2026, combines RibbonFET and PowerVia features that demand hybrid ALD-CVD chambers able to toggle thermal and plasma modes under a single vacuum. A single leading-edge fab therefore purchases 80–100 process chambers, resulting in USD 2–3 billion in incremental deposition spend per site.[1]TSMC, “2025 Technology Symposium Materials,” tsmc.com
Explosive SiC/GaN Power-Device Capex For EV And Renewables
Wolfspeed, Infineon, and onsemi each broke ground on 200-millimeter silicon carbide fabs that, together, exceeded USD 10 billion in 2025 capital plans. Metal-organic CVD reactors constitute roughly one-quarter of those budgets because SiC drift-layer growth rates remain throughput-limited. Gallium-nitride adoption in data-center power supplies has pushed compound-semiconductor foundries to 85% utilization, triggering long-term equipment orders for AIXTRON planetary reactors. With wide-bandgap wafer starts set to rise 18% annually through 2030, the semiconductor CVD equipment market will see demand tilt toward specialized metal-organic platforms.
3D-NAND Less than 400-Layer Roadmaps Need Ultra-High-AR Gap-Fill Systems
Samsung’s 400-layer V-NAND and SK Hynix’s 321-layer design both exceed 100:1 aspect ratios where conventional PECVD voids compromise cell endurance. Manufacturers are adopting hybrid ALD-CVD sequences that alternate thermal and plasma exposure to achieve bottom-up fills with 2% void density, albeit at the expense of throughput. Each 100-k-wafer-per-month NAND fab consequently requires 30-40 next-generation gap-fill chambers priced at USD 12-18 million apiece, lifting memory deposition outlays by 60% across the forecast window.
CHIPS-Style Incentives Spawning Less than 30 New Green-Field Fabs Worldwide
Direct grants and tax credits in the United States, Europe, Japan, and India unlocked 27 fabrication projects between 2024 and 2025 that collectively earmark USD 420 billion for construction and tooling. Deposition accounts for nearly 15% of typical fab capex, implying demand for roughly 2,500 chambers by 2030. While permitting delays have stretched U.S. ground-break schedules, committed subsidies continue to anchor equipment pipelines, shielding the semiconductor chemical vapor deposition (CVD) equipment market from cyclical softness in consumer-device demand.[2]U.S. Department of Commerce, “CHIPS Incentive Awards,” commerce.gov
Restraints Impact Analysis*
| Restraint | (~)% Impact on CAGR Forecast | Geographic Relevance | Impact Timeline |
|---|---|---|---|
| EUR 50 M-plus tool price and long ROIC deter smaller foundries | -0.7% | Global, particularly impacting emerging foundries in Southeast Asia, Latin America | Medium term (2-4 years) |
| U.S.-China export controls limit addressable sales in ≥15% of market | -0.9% | China, with spillover effects in Asia-Pacific | Long term (≥4 years) |
| Scarcity of high-purity metal-organic precursors for III-V epi | -0.4% | Global, acute in Asia-Pacific and North America | Short term (≤2 years) |
| F-gas phase-out rules trigger costly process redesigns | -0.3% | Europe, North America, select Asia-Pacific markets | Medium term (2-4 years) |
| Source: Mordor Intelligence | |||
EUR 50 Million-Plus Tool Price And Long ROIC Deter Smaller Foundries
Atomic-layer-deposition clusters configured for gate-all-around logic list above EUR 50 million (USD 56.5 million) and carry annual service contracts worth an additional 8-12% of the initial spend. Mature-node specialists, therefore, extend the effective life of refurbished PECVD chambers to 12 years, slowing replacement velocity. Capital-intensity disparity concentrates 78% of global deposition purchases among the top-10 manufacturers, creating a two-tier customer landscape that tempers expansion at second-tier fabs.
U.S.–China Export Controls Limit Addressable Sales In Greater than or Equal to 15% Of Market
The U.S. Bureau of Industry and Security’s December 2024 rule extended licensing to any tool capable of sub-14 nanometer gate-all-around fabrication, eliminating 15-18% of the previous total addressable market overnight. Chinese fabs pivoted to domestic suppliers NAURA Technology and AMEC, yet chamber-to-chamber uniformity and MTBM remain below Western benchmarks, constraining international penetration. The semiconductor CVD equipment market therefore re-balances toward Taiwan, South Korea, and the United States, which have each accelerated on-shore capacity plans to mitigate geopolitical risk.[3]U.S. Bureau of Industry and Security, “Semiconductor Manufacturing Controls,” bis.doc.gov
*Our forecasts treat driver/restraint impacts as directional, not additive. The impact forecasts reflect baseline growth, mix effects, and variable interactions.
Segment Analysis
By Application: Foundries Lead, Power-Device Fabs Accelerate
Foundry operations generated 41.64% of 2025 revenue as TSMC and Samsung ramped 3 nanometer and 2 nanometer nodes, anchoring the semiconductor CVD equipment market. Power and analog fabs are projected to advance at a 6.04% CAGR, the highest among applications, as electric vehicles and renewable-energy converters require thick epitaxial layers formed by low-pressure CVD. Memory accounted for 19% but sees the steepest tool-intensity gains from 3D-NAND scaling. Integrated device manufacturers contributed 23%, balancing single-wafer clusters for logic with batch furnaces for cost-sensitive analog lines. LED and optoelectronics remain niche at 6% yet gain momentum from micro-LED and LiDAR adoption.
Foundries are expected to maintain roughly 40% share through 2031, but growth moderates because mature-node lines increasingly retrofit existing chambers rather than purchase new platforms. In contrast, power-device capacity is expanding aggressively in Germany, the United States, and Malaysia, lifting specialty MOCVD demand. Memory spending remains cyclical, hinging on HBM and NAND pricing. The semiconductor chemical vapor deposition equipment market size tied to LED production will fluctuate with augmented-reality display roadmaps.


By Equipment Configuration: Single-Wafer Leads, Batch Furnaces Surge
Single-wafer clusters accounted for 45.09% of 2025 installations, underpinning every leading-edge logic and memory roadmap. Batch vertical furnaces, however, are expected to grow at a 6.18% CAGR as 28-nanometer and 40-nanometer analog fabs trade process precision for 40-50% lower cost per wafer. Dual-chamber clusters accounted for 18% by blending throughput with flexibility, while planetary reactors accounted for 12%, largely in compound-semiconductor MOCVD. Legacy single-chamber and pilot tools filled the remainder.
Gate-all-around devices achieve within-wafer uniformity of less than or equal to 1%, cementing single-wafer relevance at the frontier. Still, the global wafer-start mix remains 72% mature nodes, allowing vertical furnaces to reclaim share where ±5% tolerance suffices. Dual-chamber designs are gaining popularity for hybrid ALD-CVD stacks, shaving 30% off cycle time. Planetary reactors stay competitive in LED epitaxy but face single-wafer encroachment for GaN power devices.
By Wafer Size: 300 mm Dominates, 450 mm Inches Forward
The semiconductor CVD equipment market size tied to 300 millimeter production stood at 69.34% in 2025, cemented by more than 140 active fabs. 200-millimeter tools accounted for 24% of capacity, as silicon-carbide and gallium-nitride capacity surged. The 450 millimeter class remains less than 1% but is projected to grow 5.81% annually once Japan and Europe launch pilot lines aimed at 30-40% die-cost reduction. Sub-150-millimeter tools remain at 6% for GaAs RF devices and legacy SOI.
TSMC, Samsung, and Intel collectively pledged USD 85 billion toward new 300 millimeter capacity for 2024-2026, but tool shipments will slow to a 5.1% CAGR as retrofit programs mature. The 450-millimeter revival is driven by AI processors that strain 300-millimeter reticle limits; prototype PECVD and ALD platforms are due by 2028. Meanwhile, 200 millimeter MOCVD reactors are enjoying a renaissance as automotive OEMs demand vertically integrated SiC supply.
By End-User Type: Pure-Play Foundries Lead, Fabless Institutes Accelerate
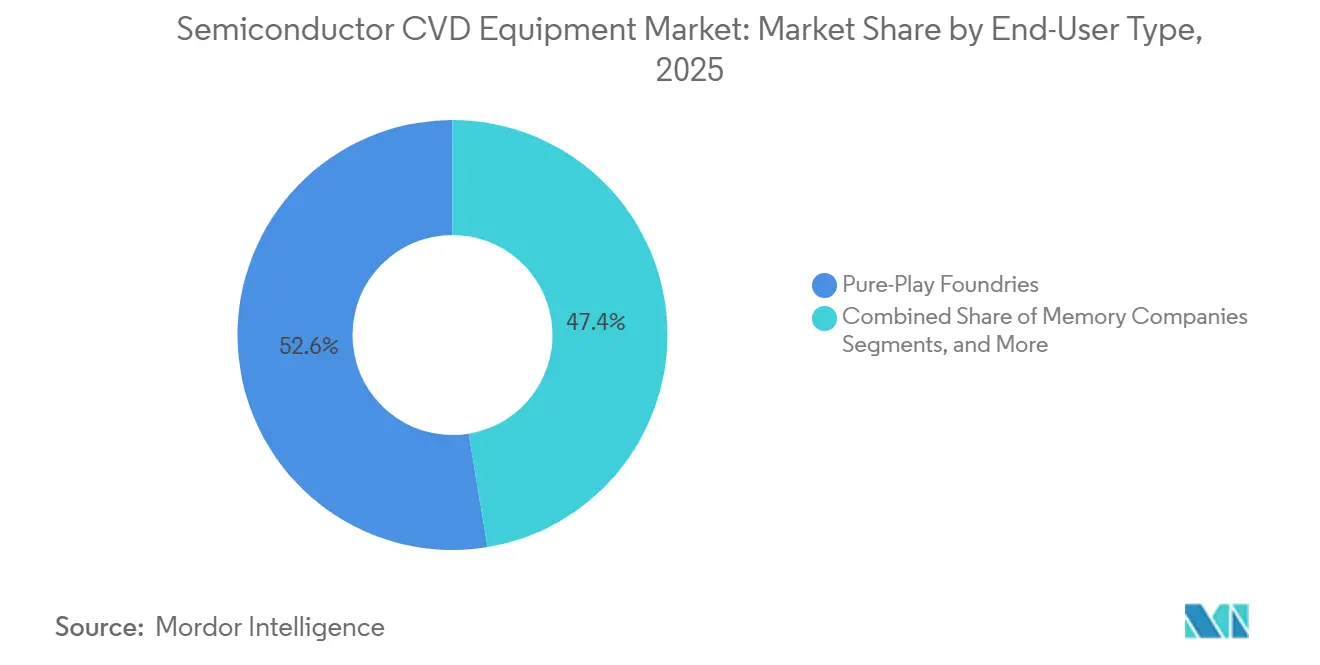
Pure-play foundries secured 52.61% of 2025 revenue, with TSMC alone near one-third of the global total. Integrated device manufacturers, at about 28%, blend captive logic and analog lines. Memory companies delivered about 14%, and fabless design houses plus research institutes contributed about 5% yet are forecast to rise 6.66% annually as chiplet development centers proliferate.
Foundry capex will hover near 40% share but slow in growth because mature-node lines optimize existing clusters. Fabless institutes are internalizing pilot capability to shorten time-to-market, purchasing small-lot ALD-CVD hybrids with sub-angstrom control. Integrated device manufacturers open their fabs to external customers, demanding versatile dual-chamber tools. Memory spending stays cyclical, peaking with every NAND layer migration, while universities rely on atmospheric-pressure CVD benches to test emerging materials.
Geography Analysis
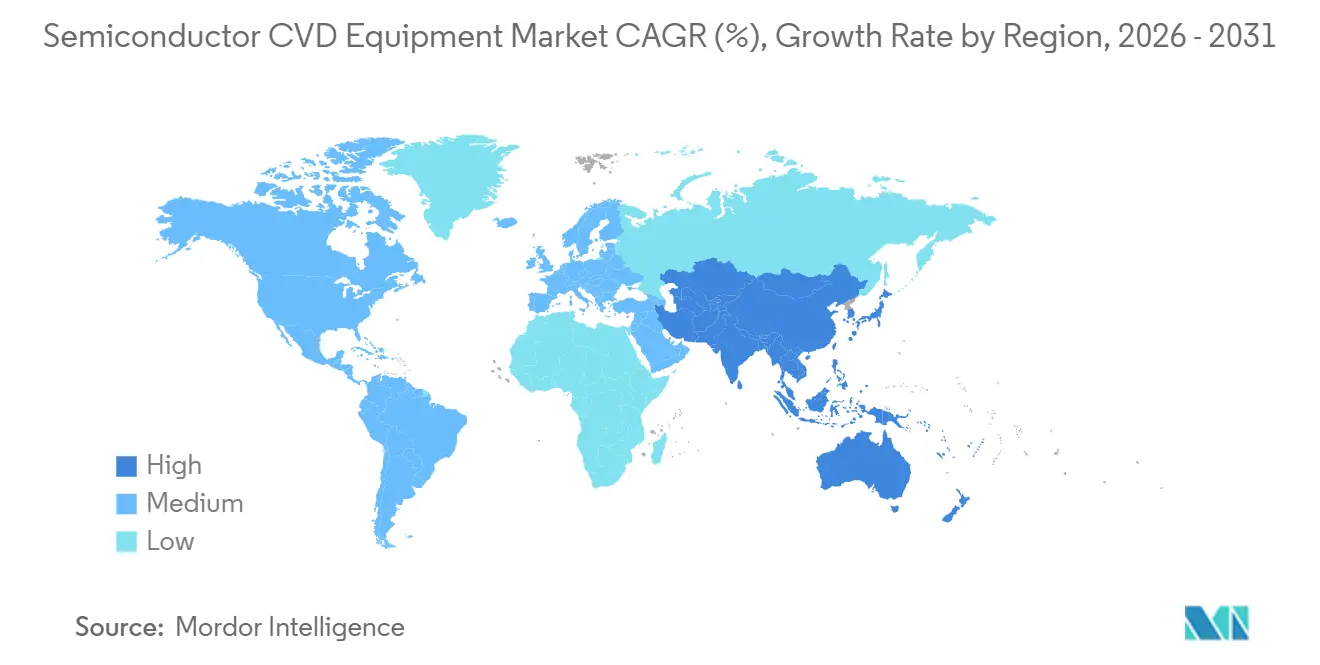
Asia-Pacific retained 47.57% of 2025 revenue and is projected to deliver a 7.83% CAGR through 2031 as TSMC, Samsung, and SK Hynix add 1 million wafer starts per month of leading-edge and power capacity. Chinese mature-node demand persists despite export controls, with NAURA Technology and AMEC lifting their local share to 22%. Japan’s JPY 2 trillion subsidy pool secures both TSMC’s Kumamoto and Micron’s Hiroshima expansions. Southeast Asia continues to absorb back-end and power-device investments, including Infineon’s 200 millimeter SiC line in Malaysia.
North America generated 28% of 2025 revenue, buoyed by USD 52.7 billion in CHIPS subsidies that anchor Intel, Micron, and Texas Instruments expansions. However, a 5.2% forecast CAGR trails Asia-Pacific because permitting delays push several U.S. fabs into 2027-2028 completion windows and because many projects target mature-node analog production with lower tool intensity. Canada’s silicon-photonics ecosystem and Mexico’s emerging wafer-level packaging lines add niche but growing demand.
Europe captured 18% of 2025 revenue and will expand at 4.8% through 2031. Intel’s EUR 30 billion (USD 35.07 billion) Magdeburg fab, TSMC’s EUR 10 billion (USD 11.69 billion) Dresden joint venture, and Infineon’s EUR 5 billion (USD 5.84 billion) PowerFab drive near-term orders. Strict environmental mandates raise PECVD system costs by 15-20% as in-situ abatement becomes compulsory. The Middle East and Africa and South America collectively hold less than 7% but may unlock incremental demand should proposed fabs in Abu Dhabi or government-funded Brazilian lines proceed.

Regulatory Landscape
Semiconductor CVD equipment shipments are increasingly shaped by export-control licensing and environmental compliance requirements that affect both tool eligibility and fab permitting. In the United States, the Department of Commerce Bureau of Industry and Security (BIS) expanded semiconductor manufacturing equipment controls in December 2024 to include licensing for tools capable of sub-14 nm gate-all-around production. This removed an estimated 15-18% of the prior addressable market for some advanced deposition platforms and pushed customers to qualify alternative, compliant tool configurations.
On the sustainability side, fabs and equipment OEMs must align designs with air-emissions and fluorinated-gas constraints, along with safety standards used in tool qualification. The US EPA NESHAP framework for semiconductor manufacturing (40 CFR Part 63, Subpart BBBBB) and EU F-gas rules are tightening requirements for in-situ abatement, leak management, and energy recovery modules on PECVD and related systems. In the EU, Implementing Regulation (EU) 2026/286 (February 2026) introduced targeted exemptions for certain stationary chillers used in semiconductor manufacturing from specific F-gas prohibitions, which is affecting facility-level equipment choices for thermal management and sub-fab infrastructure.
Value Chain Analysis
The semiconductor CVD equipment value chain starts with upstream suppliers of vacuum subsystems, RF power, gas delivery, high-purity ceramics, valves, and process control electronics, then moves into OEM integration (process chamber design, plasma sources, software, safety and abatement), factory acceptance testing, and field installation supported by long-term service. Critical subsystems often drive tool lead times, and constrained components such as high-purity ceramic parts, RF generators, and vacuum pumps are commonly cited in the 12-20 month range. As a result, multi-sourcing, redesign-to-available components, and regionalized supply arrangements matter for on-time fab ramps.
Downstream demand concentrates among pure-play foundries, IDMs, and memory manufacturers that qualify tools against node-specific process-of-record requirements, and then lock in recurring revenue through spares, upgrades, and service contracts. The chain is increasingly reinforced by co-development with research institutes and device makers to de-risk new film stacks and scale high-aspect-ratio gapfill. Lam Research expanded R&D collaborations with CEA-Leti (February 2026) and IBM (March 2026) around specialty technologies and sub-1 nm logic scaling, strengthening the link between process know-how and OEM tool roadmaps. In compound semiconductors, OEM-to-device-maker linkages also matter, including AIXTRON supplying Renesas with Planetary G5+C MOCVD systems (May 2026) for GaN power electronics expansion, which extends consumables, maintenance, and process support deeper into the equipment value chain.
Competitive Landscape
Applied Materials, Lam Research, and Tokyo Electron together held roughly 60% of 2025 deposition revenue yet face targeted competition. ASM International dominates hybrid ALD-CVD nanosheet platforms, AIXTRON leads metal-organic CVD for wide-bandgap devices, and Kokusai Electric commands batch furnaces in mature nodes. White-space innovation now centers on hybrid clusters that marry ALD and PECVD under one vacuum to reduce interface contamination, and on atmospheric-pressure epitaxial tools that eliminate pumps.
Applied Materials locks customers into its Centura and Endura platforms by integrating metrology and etch, securing multi-year service contracts worth an estimated USD 3.5 billion. Lam Research’s pulsed-RF Striker chambers achieve aspect-ratio-independent profiles in 100:1 3D-NAND trenches, validated by SK Hynix. Tokyo Electron’s Tactras furnace leverages optical emission spectroscopy for sub-3% thickness variation, winning GlobalFoundries and Tower Semiconductor design-ins. Chinese newcomers NAURA Technology and AMEC captured 22% of the domestic mature-node market by 2025, although MTBM gaps limit export prospects.
Wonik IPS and Jusung Engineering are piloting in-situ plasma-clean batch designs that extend maintenance intervals to 8,000 wafers. Veeco has partnered with a European consortium to scale GaN-on-silicon MOCVD toward 300 millimeter substrates. Compliance with SEMI S2/S8 safety standards and ISO 14001 environmental norms remains mandatory for tool qualification, forcing all suppliers to embed abatement and energy-recovery modules.
Semiconductor CVD Equipment Industry Leaders
AIXTRON SE
ASM International
Applied Materials, Inc
LAM Research Corporation
Tokyo Electron Limited
- *Disclaimer: Major Players sorted in no particular order

Market Opportunities and Future Outlook
White space in semiconductor CVD equipment is expanding where device architectures increase deposition step counts and tighten within-feature conformality requirements, especially for gate-all-around logic, high-layer-count HBM/DRAM, and extreme-aspect-ratio 3D NAND. Tool makers are responding with hybrid ALD-CVD platforms, advanced PECVD film engineering, and new metal-fill approaches to address reliability and resistance challenges in scaled interconnects and memory wordlines. A near-term indicator is productization around advanced memory scaling: Applied Materials introduced the Producer Avila 2 PECVD system (June 2026) targeting mechanical stability for ultra-thin DRAM dies used in high-layer-count HBM designs, while Lam Research highlighted Striker ALD for DRAM-oriented dielectric gapfill and ALTUS Halo for molybdenum-based wordline schemes (February 2026). Together, these releases reflect a push toward higher conformality and specialized materials in deposition roadmaps.
Policy and compliance-driven localization also creates opportunity across tool configurations and service, particularly as CHIPS-style incentives translate into greenfield projects and export rules fragment the served market by capability class. The EU moved to reinforce industrial-scale production and resilience with a Chips Act 2.0 proposal (June 2026), while US BIS export controls continue to shape which advanced deposition systems can be shipped. This is pushing OEMs to offer compliant variants, improve traceability across the supply chain, and expand field support closer to subsidized fab clusters. Environmental mandates, including tightening F-gas and emissions compliance, further increase the addressable scope for integrated abatement, energy recovery, and retrofit packages on PECVD lines, especially in regions where permitting and operational reporting requirements are becoming more prescriptive.
Recent Industry Developments
- June 2026: Applied Materials introduced the Producer Avila 2 PECVD system aimed at improving the mechanical stability of ultra-thin DRAM dies used in high-layer-count HBM designs. The launch reinforces deposition innovation as a lever for memory packaging constraints and supports tool differentiation beyond traditional film thickness and uniformity metrics.
- February 2026: Lam Research announced the Striker ALD platform for dielectric gapfill, spacer, and barrier layers targeting advanced DRAM scaling to 4F2 cell densities. By positioning ALD capability alongside CVD in critical memory steps, Lam strengthens its pull-through for integrated deposition roadmaps where conformality and defect control drive yield.
- September 2025: Lam Research entered a cross-licensing and collaboration agreement with JSR Corporation and Inpria Corporation to advance semiconductor materials and processes, including high-purity precursor and resist-related integration relevant to advanced deposition flows. The agreement supports faster adoption of new film chemistries by reducing IP friction and aligning materials readiness with next-generation tool platforms.


Research Methodology Framework and Report Scope
Market Definition and Coverage
This market covers the revenue generated from semiconductor chemical vapor deposition (CVD) equipment used inside wafer fabrication to deposit thin films on semiconductor wafers, across major wafer sizes and fab types, and counted at the equipment level in USD.
Scope exclusions: Used tools resale, installation-only services, consumables, and standalone process chemicals are excluded where they are priced and tracked separately from the equipment.
Segmentation Overview
- By Application
- Foundry
- IDM
- Memory Manufacturers
- Power and Analog Device Fabs
- LEDs and Optoelectronics
- By Equipment Configuration
- Single-Wafer Cluster
- Batch Vertical Furnace
- Dual-Chamber Cluster
- Planetary Multi-Wafer Reactor
- By Wafer Size
- Less Than or Equal to 150 mm
- 200 mm
- 300 mm
- 450 mm
- By End-User Type
- Pure-Play Foundries
- Integrated Device Manufacturers
- Memory Companies
- Fabless and R&D Institutes
- By Geography
- North America
- United States
- Canada
- Mexico
- South America
- Brazil
- Argentina
- Rest of South America
- Europe
- Germany
- United Kingdom
- France
- Italy
- Spain
- Rest of Europe
- Asia-Pacific
- China
- Japan
- India
- South Korea
- ASEAN
- Rest of Asia-Pacific
- Middle East
- Saudi Arabia
- United Arab Emirates
- Rest of Middle East
- Africa
- South Africa
- Nigeria
- Rest of Africa
- North America
Data Sources, Market Sizing, and Validation
Desk Research
Desk research was used to set the demand backdrop and to avoid missing major capacity moves that influence deposition tool orders. We referred to public sources such as SEMI fab outlook style releases and equipment billings, World Semiconductor Trade Statistics (WSTS) updates, USITC and UN Comtrade trade statistics for relevant equipment categories, and patent databases to understand process direction and tool intensity. For node migration and technology mix, we also used IEEE and other peer-reviewed journals where process flow changes, such as more complex stacks, are discussed in a measurable way.
To ground company exposure and revenue mix, we reviewed annual reports, 10-K style filings, investor presentations, and credible press coverage of fab projects and tool qualification cycles. In addition, paid subscriptions that track company financials and news helped in normalizing fiscal calendars and cross-checking large order announcements. These examples are not exhaustive, and we relied on other public sources as well for data collection, validation, and clarification during the study.
Primary Interviews and Surveys
Primary work focused on confirming how CVD tool demand changes with wafer starts, technology shifts, and utilization, and then pressure-testing pricing and delivery timelines. We spoke with a mix of equipment ecosystem participants, fab operations and process leaders, and supply chain functions across APAC, EMEA, and the Americas, which helped us close gaps left by public data and reconcile differences across sources.
Distribution of primary research fieldwork respondents
| Company type | Respondent position | Region |
|---|---|---|
| Top tier: 32% | CXOs: 17% | APAC: 38% |
| Mid tier: 48% | Functional/Unit leaders: 29% | EMEA: 35% |
| Smaller Players: 20% | Managers: 54% | Americas: 27% |
Market-Sizing & Forecasting
Sizing starts from a top-down build where fab capacity signals, wafer starts, and technology mix are used to reconstruct the deposition equipment demand pool by region and fab type, and then converted into USD using observed pricing bands. Once that structure was in place, we corroborated totals with selective bottom-up approximations, such as sampled tool shipment logic from channel checks and a sanity roll-up of order timing versus reported capex cycles.
A few inputs that matter in this market were tracked carefully, since they move revenue more than headlines do. These include 200 mm versus 300 mm wafer share shifts, the share of advanced logic and 3D NAND capacity (which changes CVD step count), utilization and ramp curves after new fab starts, delivery lead times that push recognition across quarters, and average selling price movement by configuration (single-wafer cluster versus batch furnace style systems). Forecasting relied on scenario analysis supported by expert consensus on capacity additions, node migration pace, and the likely timing of memory upcycles. Where bottom-up views were incomplete for smaller fabs or emerging geographies, we filled gaps using penetration assumptions tied to wafer capacity and then rechecked them with interview feedback before finalizing.
Data Validation & Update Cycle
Outputs were validated by comparing the model to independent signals, including semiconductor capex direction, equipment billings trends, and known fab ramp schedules by region. When a variance looked unusual, the drivers were re-opened, which usually meant rechecking wafer start assumptions, pricing bands, or timing of revenue recognition, and then confirming with a follow-up outreach.
Before sign-off, the work goes through more than one analyst review so that calculation errors and inconsistent assumptions are caught early. The report is refreshed annually, and interim updates are made when material events occur, such as large fab delays or sudden demand shocks. Right before delivery, we complete a final pass so clients receive the latest updated view based on the newest public releases and revalidated assumptions.
Mordor Intelligence's Semiconductor Cvd Equipment Market Size Measured Against Other Published Estimates
Published market sizes for semiconductor CVD equipment can differ a lot, even when everyone is describing the same end industry. The gaps usually come from what is counted as equipment revenue versus adjacent deposition spend, the choice of base year, and how pricing and shipment timing are handled.
Used equipment resale sits outside Mordor Intelligence's scope, and that single inclusion difference can move totals when a source blends secondary tool transactions with new tool revenue during downcycles. We also see divergence when some publishers keep the definition narrow to a few CVD types only, or when they assume a faster ASP rise without tying it back to configuration mix and wafer size shifts. Currency conversion timing and refresh cadence matter too, since deposition orders can swing sharply with memory and logic investment cycles.
Benchmark comparison
| Source | Market Size | Gaps in Research Methodology |
|---|---|---|
| Mordor Intelligence | USD 16.71 B (2026) | |
| Global Consultancy A | USD 4.50 B (2023) | Uses an earlier base year and appears to track a narrower revenue pool for semiconductor CVD equipment, which can undercount multi-technology configurations and newer hybrid platforms that lift tool value in recent years. |
| Industry Publisher B | USD 8.70 B (2025) | Emphasizes a limited set of CVD product types and includes a wider application framing (for example, non-wafer semiconductor related uses), which changes what gets counted as semiconductor fab deposition equipment revenue. |
The spread across the three figures is mainly explained by how narrowly CVD is defined, whether only new tool revenue is counted, and how base year timing lines up with capex cycles. By keeping the inputs tied to wafer capacity, technology mix, and observable pricing ranges, the resulting number stays traceable to clear demand signals and can be repeated when new data points arrive.


Key Questions Answered in the Report
How large is the semiconductor chemical vapor deposition equipment market in 2026?
The semiconductor chemical vapor deposition equipment market size reached USD 16.71 billion in 2026 and is forecast to climb to USD 21.96 billion by 2031.
Which CVD technology leads current revenues?
Plasma-enhanced CVD dominates with 51.44% 2025 revenue because it deposits a wide range of dielectrics at 400 °C.
What is the fastest-growing wafer size category?
Tools for 450 mm wafers are projected to grow at a 5.81% CAGR through 2031 as Japan and Europe advance pilot lines.ies operating in the Semiconductor CVD Equipment Market.
Why are power-device fabs important to equipment demand?
Silicon-carbide and gallium-nitride capacity expansions for electric vehicles and renewables push wide-bandgap epitaxy orders that lift overall market growth.
How do export controls affect tool suppliers?
December 2024 U.S. rules block sub-14 nm gate-all-around deposition systems to China, removing 15–18% of the previous addressable market and shifting demand toward Taiwan, South Korea, and the United States.
Page last updated on:


 Your data is secure and never sold or shared.


