
Market Overview
| Study Period | 2021 - 2031 |
|---|---|
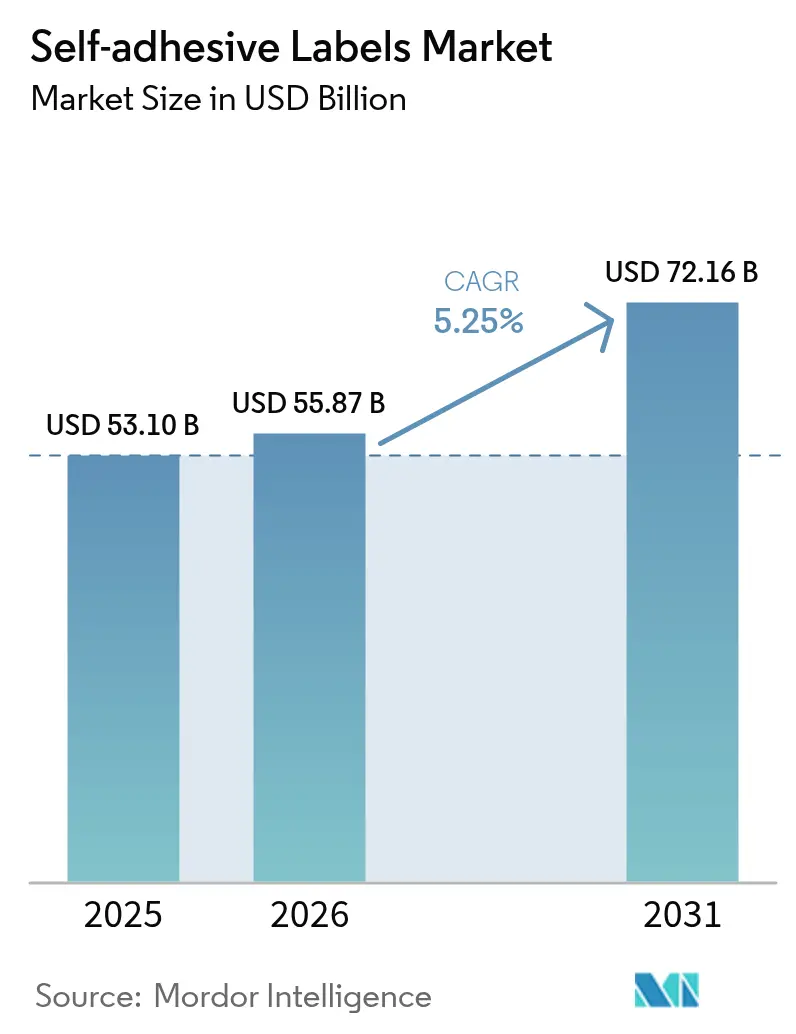
| Market Size (2026) | USD 55.87 Billion |
| Market Size (2031) | USD 72.16 Billion |
| Growth Rate (2026 - 2031) | 5.25 % |
| Fastest Growing Market | Asia Pacific |
| Largest Market | Asia Pacific |
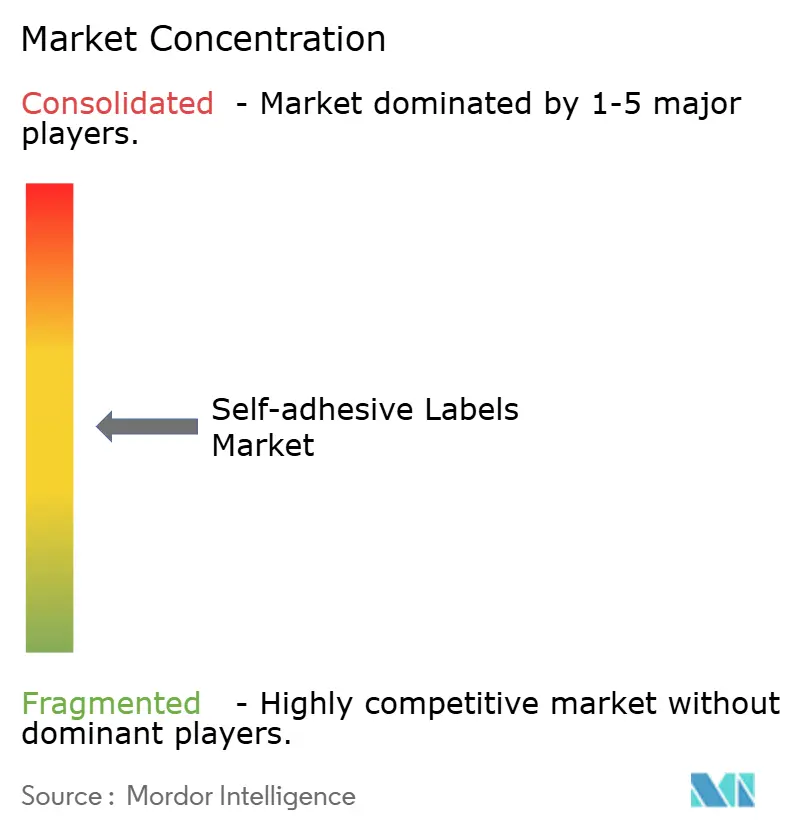
| Market Concentration | Medium |
Major Players *Disclaimer: Major Players sorted in no particular order Image © Mordor Intelligence. Reuse requires attribution under CC BY 4.0. | |
Self-adhesive Labels Market Analysis by Mordor Intelligence
The Self-adhesive Labels Market size is projected to expand from USD 53.10 billion in 2025 and USD 55.87 billion in 2026 to USD 72.16 billion by 2031, registering a CAGR of 5.25% between 2026 to 2031. Converters are increasingly shifting from cut-and-stack labels to pressure-sensitive formats. This transition not only reduces the need for secondary adhesive applications but also cuts down trimming line downtime. Such efficiency is crucial in managing the rising SKU counts driven by e-commerce customization. Additionally, with parcel return rates increasing, there's a heightened demand for variable-data logistics labels. This is a niche where wet-glue systems find it challenging to compete on an economic level. Emulsion-acrylic chemistries, already the frontrunners in food-contact applications due to their compliance with migration rules, are witnessing accelerated market penetration. This surge is further fueled by regulatory moves to restrict volatile-organic-compound emissions. While plastic film facestocks come at a premium compared to paper, they're gaining traction in cold-chain and durable packaging. Their ability to endure condensation and resist chemical exposure over extended distribution routes is a significant advantage. The competitive landscape is shifting: regional specialists are capitalizing on short lead-time contracts, while global players are channeling investments into closed-loop liner recycling, a move aimed at diverting silicone-coated waste from landfills.
Key Report Takeaways
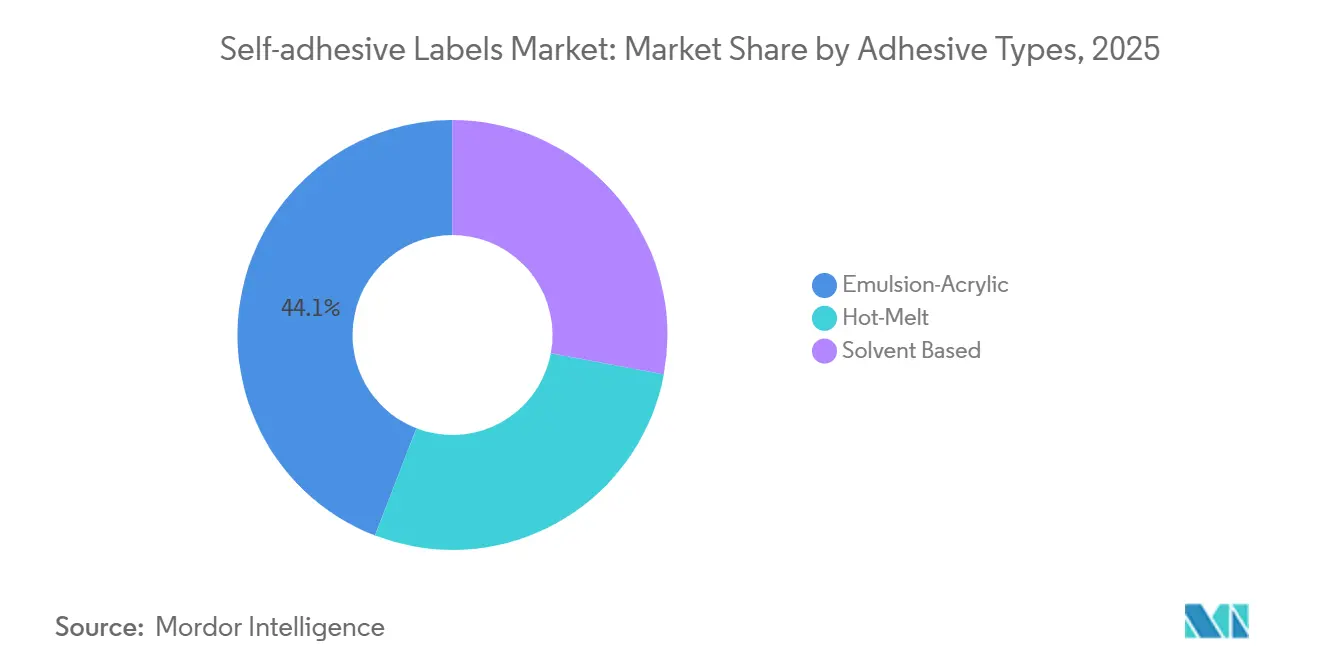
- By adhesive type, emulsion acrylics captured 44.14% of the Self-adhesive Labels market share in 2025; hot-melt formulations posted the highest projected CAGR at 6.14% through 2031.
- By face material, paper commanded 63.70% share of the Self-adhesive Labels market size in 2025, while plastic-based films are forecast to expand at 5.55% CAGR between 2026 and 2031.
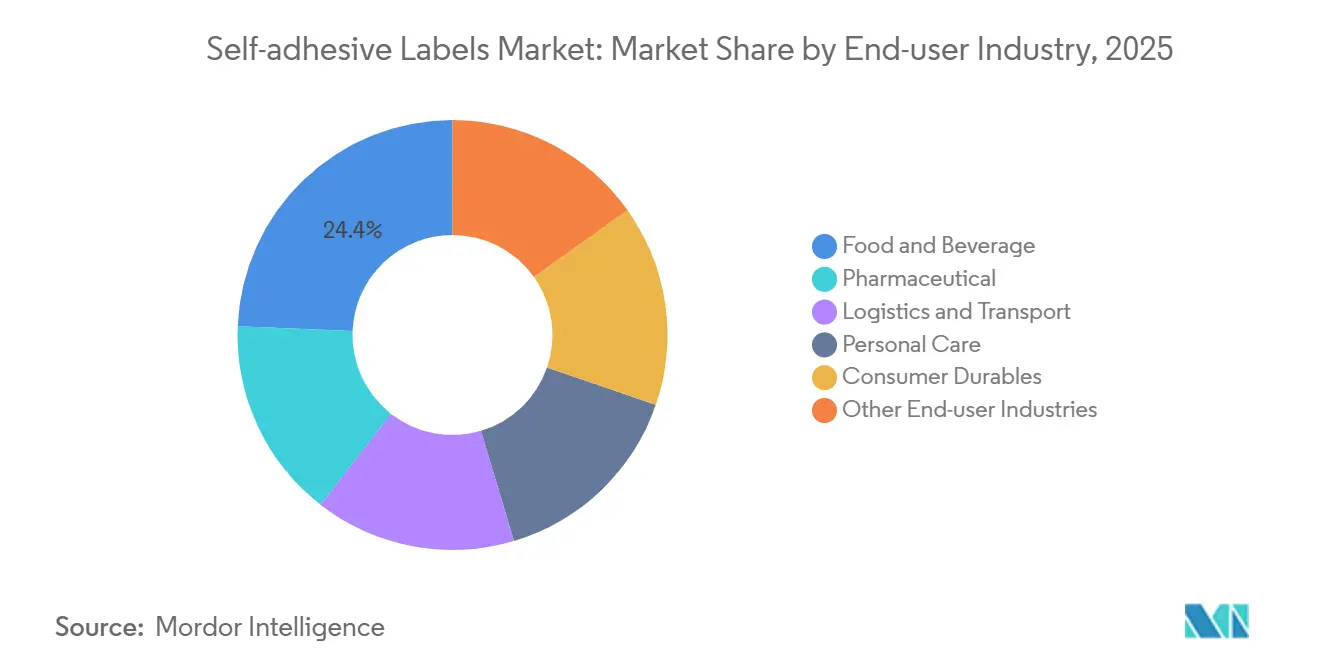
- By end-user industry, food and beverage led with 24.35% revenue share in 2025; logistics and transport are advancing at a 5.77% CAGR through 2031.
- By geography, Asia-Pacific held 35.80% of 2025 revenues, and the region is projected to grow at a 6.09% CAGR during 2026-2031.
Note: Market size and forecast figures in this report are generated using Mordor Intelligence’s proprietary estimation framework, updated with the latest available data and insights as of 2026.
Market Trends and Insights
Drivers Impact Analysis of Self-adhesive Labels Market*
| Drivers | (~) % Impact on CAGR Forecast | Geographic Relevance | Impact Timeline |
|---|---|---|---|
| E-commerce parcel volume surge fueling logistics label demand | +0.9% | Global, with peak intensity in North America, Europe, and APAC urban corridors | Short term (≤ 2 years) |
| Expansion of packaged food and beverage production in emerging Asia | +1.2% | APAC core (China, India, Indonesia), spill-over to Middle East | Medium term (2-4 years) |
| Converter shift to high-speed automated hot-melt labeling lines | +0.7% | North America and Europe, early adoption in Brazil and Mexico | Medium term (2-4 years) |
| Regulatory preference for solvent-free adhesives in consumer packaging | +0.6% | Europe (PPWR mandates), North America (FDA 21 CFR 175.105), selective APAC markets | Long term (≥ 4 years) |
| Rapid uptake of microwave-safe hot-melt labels for ready-meal trays | +0.5% | APAC (China, Japan), North America convenience-meal segment | Short term (≤ 2 years) |
| Source: Mordor Intelligence | |||
E-Commerce Parcel Volume Surge Fueling Logistics Label Demand
Cross-border parcel flows jumped during 2024-2025, and some of those shipments now leave warehouses with pre-printed return labels. Pressure-sensitive constructions integrate variable-data printing for QR codes and customs declarations at digital-press speeds above 100 m/min, matching the two-hour dispatch cycles of urban micro-fulfillment centers. Time-temperature indicators built into polyester facestocks document cold-chain breaches on perishables, while IATA regulations obligate lithium-battery hazard markings on almost one-fifth of international parcels[1]International Air Transport Association, “Dangerous Goods Regulations,” iata.org. Together, these functional requirements are widening the performance gap between the self-adhesive labels market and traditional wet-glue alternatives.
Expansion of Packaged Food and Beverage Production in Emerging Asia
In 2025, China's ready-to-eat meal category experienced significant growth, pushing converters to certify microwave-safe hot-melt labels that retain bond strength at 120 °C without delamination. India’s organized retail footprint expanded in the same year, enabling centralized label procurement that trims SKU inventory and accelerates pan-India rollout. ASEAN harmonization reduced label-approval cycles to four months, lifting adoption of pressure-sensitive formats across Indonesia and Vietnam. Collectively, these shifts inject additional volume into the self-adhesive labels market.
Converter Shift to High-Speed Automated Hot-Melt Lines
New equipment, such as ACMI’s Opera Omnia and Koenig & Bauer’s CorruCUT machines, runs above 200 m/min and eliminates costly solvent-recovery systems, cutting energy consumption per line. Instant adhesion lets converters schedule short runs economically, a critical advantage as e-commerce fragments order profiles. Closed-loop viscosity control now maintains coat weight within ±2 g/m², mitigating bleed-through on porous craft-beer labels. Capital savings are accelerating the pivot toward hot-melt within the self-adhesive labels market.
Regulatory Preference for Solvent-Free Adhesives in Consumer Packaging
Regulations like the EU Framework Regulation and FDA's 21 CFR 175.105 are curbing the migration of primary aromatic amines[2]U.S. Food & Drug Administration, “CFR Title 21 §175.105,” fda.gov . This push is nudging food-contact applications to favor emulsion-acrylic or hot-melt chemistries. In Europe, the Packaging and Packaging Waste Regulation (PPWR) mandates that PET bottles must sport wash-off labels. This has accelerated the adoption of hydrophilic tackifiers, which conveniently dissolve in caustic baths. Brand owners, by accepting a cost premium, not only ensure compliance but also sidestep EPR penalties. This trend is bolstering the momentum of solvent-free solutions in the self-adhesive labels market.
Restraints Impact Analysis of Self-adhesive Labels Market*
| Restraints | (~) % Impact on CAGR Forecast | Geographic Relevance | Impact Timeline |
|---|---|---|---|
| Recycling challenges from adhesive and facestock contamination | -0.4% | Europe (PPWR enforcement), North America (extended producer responsibility schemes), selective APAC markets | Medium term (2-4 years) |
| Competitive threat from linerless label technologies | -0.3% | Global, with early traction in logistics and food retail segments | Long term (≥ 4 years) |
| Oxidative discoloration of rubber-based hot-melt labels in premium cosmetics | -0.2% | Europe and North America luxury cosmetics, APAC duty-free channels | Short term (≤ 2 years) |
| Source: Mordor Intelligence | |||
Recycling Challenges From Adhesive and Facestock Contamination
Each year, the PET and HDPE regrind in Europe face contamination from adhesive residue. This contamination reduces pellet clarity and lowers resale values. By 2028, PPWR will require wash-off labels, pushing suppliers to adjust their hot-melts with hydrophilic tackifiers. These suppliers will also need to pass a six-month migration test, resulting in an increase in material costs. In North America, EPR schemes levy fees on non-recyclable packaging, intensifying pressure on converters who struggle to absorb these added costs. While Recyclass certification provides a pathway to compliance, only a small percentage of submissions secured an A rating, highlighting the technical challenges involved.
Competitive Threat From Linerless Label Technologies
Avery Dennison’s rbDIRECT platform has successfully eliminated silicone release liners, resulting in a significant reduction in material waste and freight costs. Early adopters, such as grocery weigh-scale and parcel-sortation lines, benefit from linerless rolls that accommodate more labels. However, retrofitting applicators comes with a hefty price tag. Additionally, adhesive bleed-through poses a challenge, capping speeds at 60 m/min in warmer factory settings. Compounding these challenges, the lack of clear municipal recycling guidelines for linerless substrates introduces further uncertainty, hindering the large-scale shift from traditional self-adhesive labels.
*Our forecasts treat driver/restraint impacts as directional, not additive. The impact forecasts reflect baseline growth, mix effects, and variable interactions.
Self-adhesive Labels Market Segment Analysis
By Adhesive Type:
Hot-Melt Gains on Automation EconomicsHot-melt formulations represent the fastest-growing adhesive class, advancing at 6.14% CAGR through 2031 as converters standardize on high-speed lines that cure instantly and cut energy use by one-quarter. In contrast, emulsion-acrylic held 44.14% of the self-adhesive labels market share during 2025 because its waterborne chemistry easily passes global food-contact regulations. The self-adhesive labels market, particularly linked to hot-melt systems, anticipates a boost by 2031. This surge follows SIS polymer upgrades, which have unlocked the coveted heat resistance essential for microwave-ready meals. On the other hand, solvent-based products are facing challenges due to migration caps. Even with a shift to pricier aliphatic isocyanates, suppliers grapple with a tightening regulatory window.
Ongoing research and development is honing in on polyolefin-friendly hot-melts. These innovations bond seamlessly to low-surface-energy plastics without the need for primers. A notable stride in this direction was the introduction of a new portfolio in 2025. Complementing these chemical advancements, equipment manufacturers are integrating inline UV varnishing. This innovation not only eliminates the need for post-press handling but also reduces changeover times to mere minutes. Such a cohesive strategy solidifies hot-melt's position as the preferred choice for logistics and consumer-durable labels, further influencing the dynamics of the broader self-adhesive labels market.



By Face Material:
Plastic Films Capture Cold-Chain and Durables GrowthPaper still dominated with a 63.70% share in 2025, but plastic films are expanding at a 5.55% CAGR because they survive condensation, oils, and autoclave cycles that would degrade cellulose. Forecasts predict the plastic-film segment of the self-adhesive labels market will grow significantly by 2031, bolstered by PPWR directives promoting mono-material packaging. A notable advancement is co-extruded BOPP films, which now match the opacity of 60-g paper while being lighter, highlighted by LINTEC’s 40 µm launch in 2025.
PET films, despite their premium pricing, are crucial for pharmaceutical serialization, ensuring 2D codes remain scannable post-121 °C sterilization. While vinyl carves out a niche in outdoor durability, brand commitments to sustainability are beginning to temper PVC's growth. As recyclers advocate for alignment between label and container materials, there's a noticeable shift in demand. The market is leaning towards PP labels on PP bottles and fiber-based solutions for cartons, reshaping procurement trends in the self-adhesive labels arena.
By End-User Industry:
Logistics Outpaces Food and BeverageFood and beverage retained 24.35% revenue share in 2025, but logistics and transport are the fastest risers at 5.77% CAGR through 2031. The surge in e-commerce parcels, coupled with IATA's hazard-label mandates, has bolstered the use of durable polyester facestocks. These facestocks now seamlessly embed barcodes, TTIs, and customs data in a single print pass. As a result, by 2030, the portion of the self-adhesive labels market dedicated to logistics is poised to rival that of the food and beverage sector.
While the pharmaceutical sector may not dominate in tonnage, it reaps the benefits of superior margins. This is largely due to stringent track-and-trace regulations in the EU and U.S., which mandate high-contrast serialization in line with ISO/IEC 15415 standards. In the personal-care realm, labels now incorporate holograms and NFC chips as a defense against counterfeiting. Meanwhile, luxury cosmetics brands have raised the bar, demanding a Delta-E color-shift of less than 2.0 after a year of light aging. Such premium specifications are driving a noticeable disparity in average selling prices within the self-adhesive labels industry.
Geography Analysis
APAC Self-adhesive Labels Market
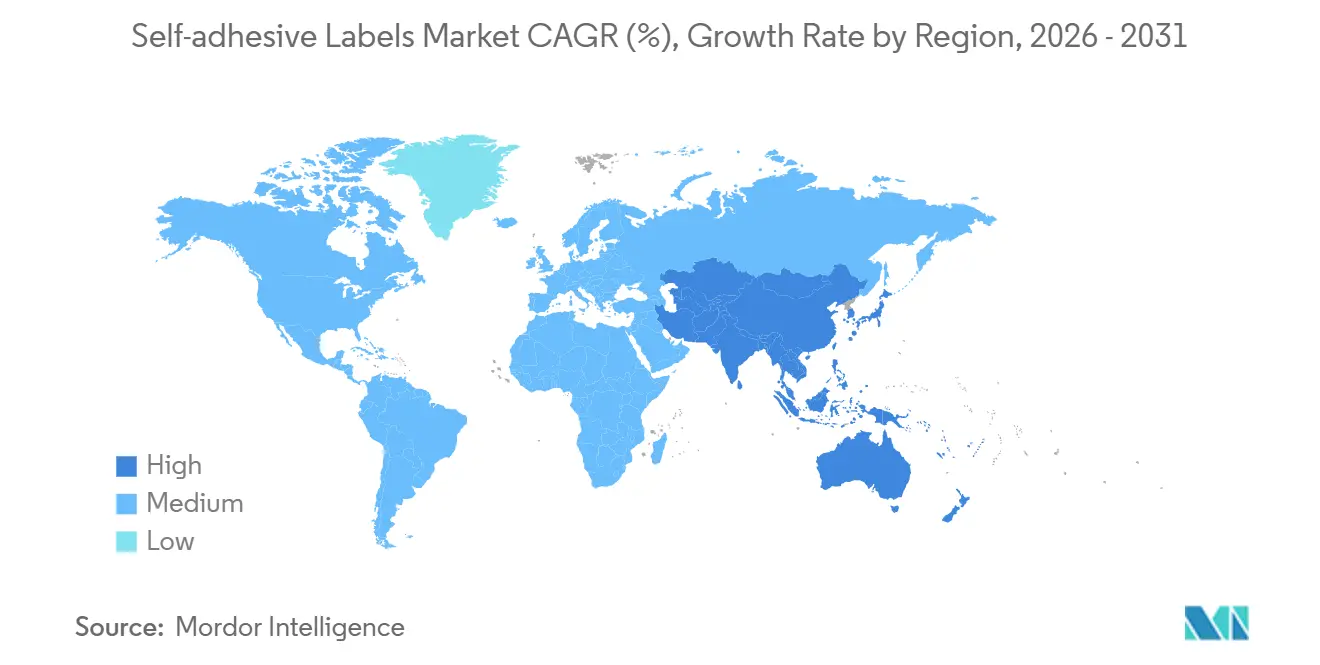
Asia-Pacific generated 35.80% of 2025 global revenue and is growing fastest at a 6.09% CAGR. In China, the surge in microwave meals drives the demand for SIS hot-melt labels, engineered to withstand reheating at high temperatures. Meanwhile, India's retail expansion is steering brands towards centralized pressure-sensitive lines, effectively reducing regional SKU duplication. Japan's rigorous pharmaceutical track-and-trace regulations bolster the demand for PET serialization labels. In South Korea, an uptick in cosmetics exports is propelling the adoption of holographic facestock. Furthermore, investments in cold-chain logistics across Southeast Asia are broadening label penetration beyond tier-1 cities, fueling sustained volume growth in the self-adhesive labels market.
Europe and North America Self-adhesive Labels Market
In Europe and North America, the emphasis is on recyclability over sheer volume. The PPWR mandates that PET bottles must utilize wash-off labels. This shift is prompting more frequent hot-melt reformulation cycles and pushing up costs. Additionally, several states in the U.S. have introduced EPR fees on non-recyclable packaging, creating a competitive edge for early adopters of hydrophilic adhesives. While a surge in cross-border parcels buoys logistics label volumes, the absolute tonnage in the U.S. lags behind Asia, primarily due to saturation in the fast-moving consumer goods sector.
MEA and South America Self-adhesive Labels Market
South America and the Middle-East, and Africa, though contributing less to revenues, are witnessing notable accelerations. In Brazil, a consolidation in packaged foods is leaning towards imported pressure-sensitive materials, even with tariff challenges. Argentina's macro-stabilization has revitalized beverage label line upgrades, slashing changeover times significantly. In Saudi Arabia, as the nation localizes its drug manufacturing, there's a corresponding spike in demand for serialized labels, in line with SFDA regulations. South African wine exporters, aiming to maintain market access, are now using EU-compliant wash-off labels. However, infrastructure challenges, especially in refrigerated transport, continue to hinder the broader adoption of self-adhesive labels in the market.

Regulatory Landscape
Regulation increasingly shapes both label content and material selection, especially for food contact and recyclability. In the United States, FDA 21 CFR 175.105 remains a key gatekeeper for adhesives used in food packaging, pushing converters and adhesive suppliers toward compliant emulsion-acrylic and certain hot-melt systems supported by GMP controls and functional-barrier approaches. In Europe, the Packaging and Packaging Waste Regulation (PPWR) focus on design-for-recycling has raised the bar for label constructions on PET and HDPE packaging, accelerating adoption of wash-off adhesive technologies to avoid EPR-related cost exposure.
Chemical hazard communication is also evolving. Regulation (EU) 2024/2865 amended the EU CLP framework for labeling substances and mixtures, advancing digital and readability-oriented approaches to label communication. UNECE continues to harmonize implementation globally, publishing the 11th revised edition of the Globally Harmonized System of Classification and Labelling of Chemicals (GHS) in September 2025, which informs how hazard markings and associated data are implemented across geographies and end-use segments.
Value Chain Analysis
The self-adhesive label value chain starts with upstream inputs, including facestocks (paper, BOPP/PP, PET, vinyl), pressure-sensitive adhesive chemistries (emulsion-acrylics, hot-melts, solvent-based), silicone-coated release liners, and additives such as tackifiers, stabilizers, and migration-control packages. These components are combined by labelstock producers and coating specialists into rolls and sheets, then processed by converters that slit, die-cut, print (flexo, offset, digital inkjet), and finish labels for shipment to end users in food and beverage, pharmaceuticals, personal care, consumer durables, and logistics.
Midstream capability is increasingly defined by application-specific materials and localized service footprints. UPM Adhesive Materials expanded portfolio depth in June 2026 with purpose-built adhesive solutions (UPM PharmaSure, UPM Vetro, UPM Endurance) and reinforced converter-equipment linkage by renewing its strategic partnership with Mark Andy in the Americas in April 2026. Regional supply resilience is also being strengthened through new liner and distribution capacity initiatives, including Ahlstrom manufacturing PSA release paper (MaxLiner) at its Jacarei, Brazil facility, and UPM establishing a slitting and distribution terminal near New Delhi to shorten lead times in India.
Competitive Landscape
The self-adhesive labels market is moderately fragmented. Mid-tier converters leverage agility, winning regional contracts with 48-hour lead times and custom die-cutting. Investment in digital inkjet presses lets them print serialized or multilingual labels at marginal cost, encroaching on niches historically served by multinationals. Concurrently, equipment innovators bundle hot-melt lines with inspection cameras, enabling pharmaceutical compliance without separate vision stations and reducing total installed costs. Technology white spaces remain. Patent filings from H.B. Fuller around polyolefin adhesion and Jiangmen Jinhao’s ultrathin BOPP films signal incremental innovations poised to reshape future competitive positioning.
Self-adhesive Labels Industry Leaders
Avery Dennison Corporation
CCL Industries
UPM Global
LINTEC Corporation
3M
- *Disclaimer: Major Players sorted in no particular order
Self-adhesive Labels Market Companies Covered in this Report
- 3M
- Asteria Group
- Avery Dennison Corporation
- CCL Industries
- Fuji Seal International, Inc.
- H.B. Fuller Company
- HERMA GmbH
- Lecta Adestor
- LINTEC Corporation
- Mondi
- Optimum Group
- Symbio Inc.
- UPM Global

Market Opportunities and Future Outlook
Design-for-recycling requirements are creating clearer whitespace for label constructions that perform in use but separate cleanly in recycling, particularly for PET and HDPE packaging where adhesive residue and facestock contamination have been persistent pain points. UPM Adhesive Materials introduced its ProCycle portfolio in May 2026, centered on wash-off adhesive technology for packaging recyclability, while BASF highlighted in March 2026 that pressure-sensitive adhesives for filmic labels on PET bottles can be compatible with current mechanical recycling processes. These steps support product roadmaps that tie label performance to wash and regrind stages, as brand owners and converters work through PPWR-driven design requirements.
Operational agility and service localization also create opportunity, especially in high-SKU environments linked to e-commerce and modern retail. UPM’s March 2026 announcement of a new slitting and distribution terminal near New Delhi, planned to start operations in Q3 2026, shows suppliers building regional hubs to improve responsiveness for converters managing short runs, multilingual variants, and faster replenishment cycles. At the same time, continued converter investment in high-speed hot-melt capable lines and inspection-enabled printing for regulated sectors, including pharmaceutical serialization quality requirements, keeps raising the value of application-specific labelstocks and validated constructions.
Recent Industry Developments in Self-adhesive Labels Market
- June 2026: CCL Industries completed the acquisition of Sleever International Company SA, adding shrink sleeve label production, extruded films, and application equipment to its portfolio. The deal broadens CCLs reach in specialty packaging decoration formats that often compete for the same brand programs and converter capacity as pressure-sensitive labeling.
- May 2026: UPM Adhesive Materials launched the UPM ProCycle portfolio of label solutions designed for packaging recyclability, including wash-off adhesive technology for PET and HDPE. The launch supports converters and brand owners working to reduce recycling interference from labels and adhesives in mechanical recycling streams.
- July 2024: Lecta Adestor opened a self-adhesive converting plant in Aschaffenburg, Germany, to strengthen service coverage for Central and Northern Europe. The facility expands regional converting capacity and reduces delivery distances for facestock, adhesives, and liner configurations required by short lead-time programs.


Self-adhesive Labels Market Report Scope and Research Methodology
Market Definition and Coverage
For this study, the market covers revenue generated from self-adhesive (pressure-sensitive) labels supplied as finished label stock or converted labels, used across packaging and product identification applications, and sold across major regions in USD.
Scope exclusions: It does not count direct printing on packs or containers, and it also excludes non-adhesive label formats such as shrink sleeves and in-mold labels.
Segments Covered in This Report
- By Adhesive Types
- Hot-Melt
- Emulsion-Acrylic
- Solvent Based
- By Face Material
- Paper
- Plastic
- Polypropylene
- Polyester
- Vinyl
- Other Plastics
- By End-user Industry
- Food and Beverage
- Pharmaceutical
- Logistics and Transport
- Personal Care
- Consumer Durables
- Other End-user Industries
- By Geography
- Asia-Pacific
- China
- India
- Japan
- South Korea
- Rest of Asia-Pacific
- North America
- United States
- Canada
- Mexico
- Europe
- Germany
- United Kingdom
- Italy
- France
- Rest of Europe
- South America
- Brazil
- Argentina
- Rest of South America
- Middle-East and Africa
- Saudi Arabia
- South Africa
- Rest of Middle-East and Africa
- Asia-Pacific
Data Sources, Market Sizing, and Validation
Desk Research
Desk research was used to build a clear demand map and to anchor assumptions that later feed into the market model. We reviewed public sources such as trade and production series from the US Census Bureau, international trade indicators from UN Comtrade, and manufacturing and price series from the US Bureau of Labor Statistics, before mapping these signals to label consumption patterns.
To keep the market scope realistic, we also referred to packaging and labeling association publications and conference releases (where available), patent databases to track material and coating innovation, and technical papers in peer-reviewed packaging and polymer journals. Company filings, investor presentations, and reputed press were used to understand capacity additions, regional footprint changes, and mix shifts between paper and film facestocks. For company financials and for cross-checking news and financial context at scale, our analysts also used approved paid subscriptions. The sources listed here are illustrative only, and additional public references were used during data collection and validation.
Primary Interviews and Surveys
Primary work focused on validating volumes, pricing direction, and mix trends that are hard to read from public data alone. We spoke with stakeholders across the value chain, including label converters, material suppliers, distributors, and large end users in food and beverage, pharmaceuticals, logistics, and personal care. We then rechecked the assumptions across APAC, EMEA, and the Americas to avoid a single-region bias.
Distribution of primary research fieldwork respondents
| Company type | Respondent position | Region |
|---|---|---|
| Top tier: 33% | CXOs: 15% | APAC: 44% |
| Mid tier: 52% | Functional/Unit leaders: 34% | EMEA: 35% |
| Smaller Players: 15% | Managers: 51% | Americas: 21% |
Market-Sizing & Forecasting
The core sizing logic uses a top-down build where packaging output and trade indicators are reconstructed into an addressable labels demand pool, and then filtered by the share that typically uses pressure-sensitive formats by end-use. Once that view was formed, selective bottom-up checks were added using sampled converter revenue ranges, channel conversations, and simple ASP times volume approximations. These checks are used to adjust totals when gaps show up.
Key inputs used in the model included packaged food and beverage output trends, pharma and personal care labeling intensity, e-commerce shipment and parcel labeling activity, material mix shifts between paper and film facestocks, and average price movement linked to resin and paper cost direction. When data was not consistently available for smaller countries, the model used proxy indicators such as packaged goods output and import intensity, and then normalized the result using expert checks so that the final totals stayed realistic.
For forecasting, scenario analysis was used so that different paths for packaging growth, sustainability-driven material changes, and pricing pass-through could be tested without making the math overly complex. The final forecast path was chosen only after interview feedback confirmed the likely direction of demand and the expected pace of adoption in high-growth end uses.
Data Validation & Update Cycle
Validation was done through repeated cross-checks between model outputs and independent market signals, followed by a structured review before sign-off. Variances were tested by region and end-use, and any sharp jumps were traced back to a specific assumption such as price, mix, or demand intensity, then corrected if the logic did not hold.
We refresh the report annually so the base year, key assumptions, and forecast path stay current. If there is a material event such as a major capacity change, raw material shock, or a regulation-driven shift in adhesive chemistry, the team triggers an interim review and reconnects with selected experts. Before delivery, the latest public indicators are rechecked so clients receive an updated view rather than an older model output.
Mordor Intelligence's Self Adhesive Labels Market Size Compared Against Other Published Estimates
Published market sizes for self-adhesive labels often vary because each study draws the boundary in a slightly different way, and then uses different price, volume, and timing assumptions. Even small differences in whether the number is converter revenue, labelstock value, or a wider labeling basket can move the total by several billions of dollars.
For this market, the biggest gap drivers are usually format coverage (pressure-sensitive labels only versus adding adjacent formats), whether linerless is counted inside the same pool, and how pricing is progressed over time when paper and resin costs swing. Currency conversion timing and the year chosen as the reference point also matter, especially when regional growth rates are uneven and APAC carries a large share of demand.
Benchmark comparison
| Source | Market Size | Gaps in Research Methodology |
|---|---|---|
| Mordor Intelligence | USD 55.87 B (2026) | |
| Market Research Publisher A | USD 52.06 B (2024) | Uses an earlier base year and does not clearly show how ASP changes are carried into the forecast, which can understate the later-year value when input costs and mix move. |
| Industry Research Publisher B | USD 60.00 B (2025) | Explicitly includes linerless alongside release-liner formats and applies a longer horizon, which can lift the starting value if adjacent product definitions are grouped together. |
Packaging output signals, trade patterns for label-related inputs, and value chain checks from interviews are the evidence points that keep Mordor Intelligence tied to a pressure-sensitive labels-only revenue pool with a consistent year basis. The spread in the table is mainly explained by format boundaries and base-year timing, which is why a clearly stated scope and repeatable pricing logic tends to produce a steadier number for planning.


Key Questions Answered in the Report
How large is the self-adhesive labels market today, and where is it headed?
It reached USD 55.87 billion in 2026 and is forecast to reach USD 72.16 billion by 2031 at a 5.25% CAGR.
Which adhesive technology is growing fastest?
Hot-melt systems are advancing at a 6.14% CAGR due to high-speed automation and instant cure.
What drives demand in Asia-Pacific?
Rapid growth in ready-meal packaging, e-commerce logistics, and pharmaceutical serialization fuels a 6.09% CAGR.
How are recyclability regulations shaping product design?
PPWR and EPR schemes mandate wash-off adhesives for PET, prompting reformulations that add to material costs.
Page last updated on:


 Your data is secure and never sold or shared.


