Market Overview
| Study Period | 2018 - 2031 |
|---|---|
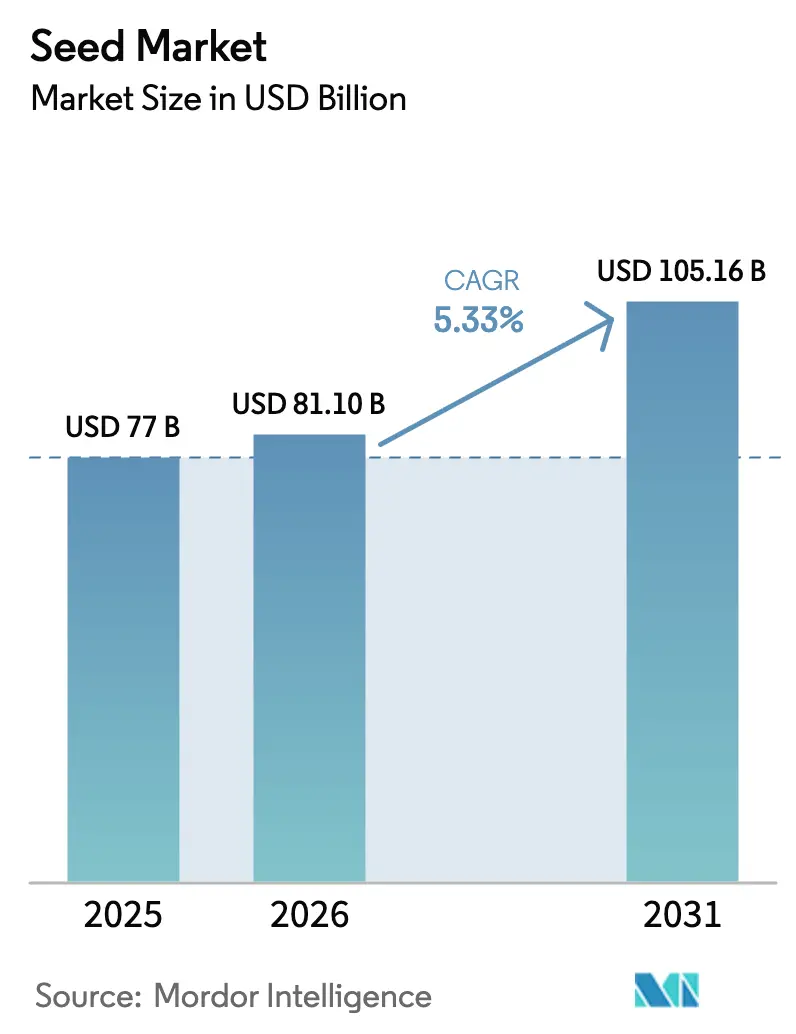
| Market Size (2026) | USD 81.1 Billion |
| Market Size (2031) | USD 105.16 Billion |
| Growth Rate (2026 - 2031) | 5.33% CAGR |
| Fastest Growing Market | North America |
| Largest Market | North America |
| Market Concentration | Medium |
Major Players *Disclaimer: Major Players sorted in no particular order Image © Mordor Intelligence. Reuse requires attribution under CC BY 4.0. | |
Seed Market Analysis by Mordor Intelligence
Seed market size in 2026 is estimated at USD 81.1 billion, growing from 2025 value of USD 77 billion with 2031 projections showing USD 105.16 billion, growing at 5.33% CAGR over 2026-2031. Robust growth reflects a pressing need for high-performance seed varieties that increase yields, enhance climate resilience, and reduce input costs. Wider access to certified hybrids, accelerating deployments of digital breeding tools, and supportive government programs collectively spur demand. Hybrid dominance across corn, rice, and other staples anchors volume, while vegetables and specialty crops inject higher margins as dietary preferences evolve. The expansion of protected cultivation, vertical farms, and climate-controlled greenhouses further reshapes global production strategies, particularly in Asia-Pacific urban centers. Meanwhile, regulatory clarity on gene-edited seeds and AI-enabled phenotyping shortens innovation cycles and unlocks new trait portfolios.
Key Report Takeaways
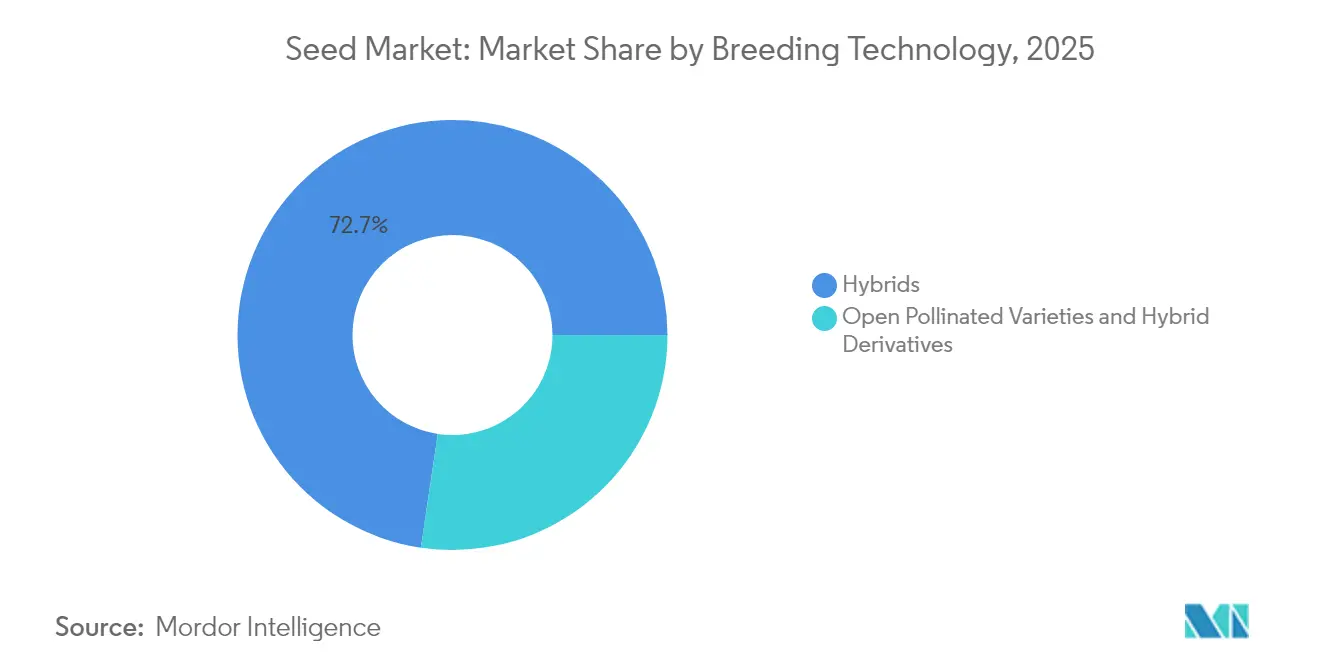
- By breeding technology, hybrids had captured 72.65% of the seed market share in 2025, and are projected to advance at a 5.47% CAGR through 2031.
- By cultivation mechanism, open field production accounted for 99.55% of the seed market size in 2025, while protected cultivation is projected to expand at a 7.18% CAGR through 2031.
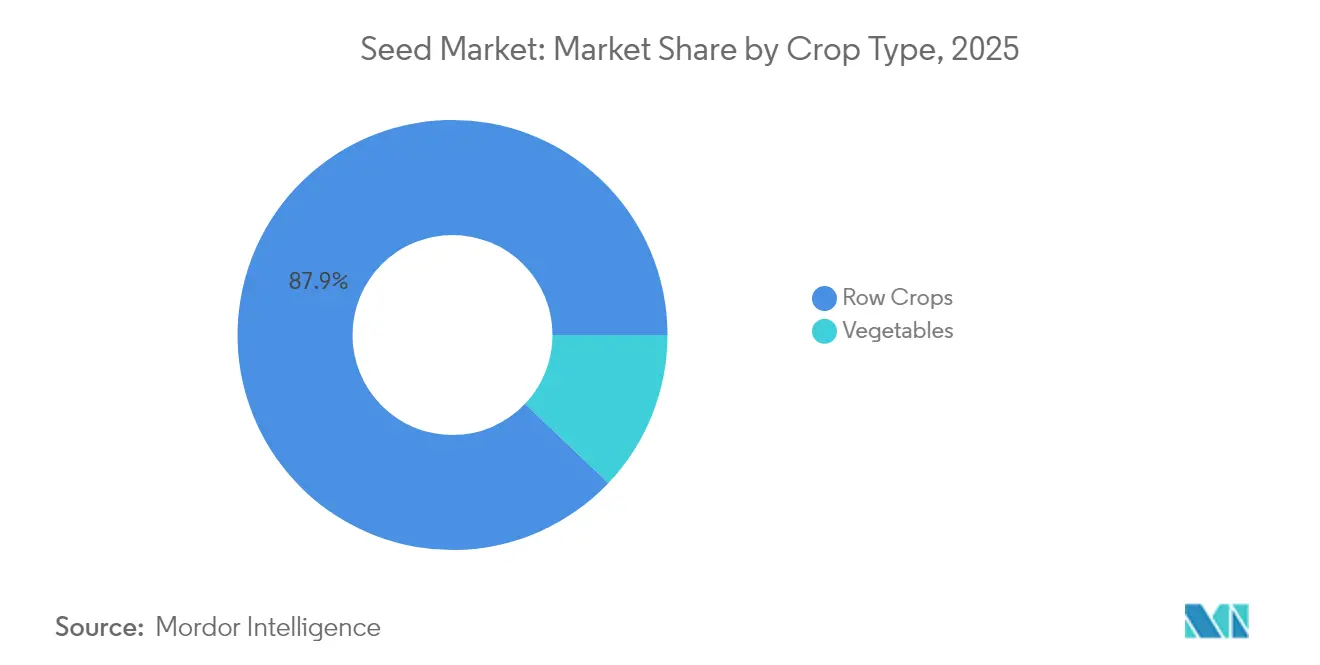
- By crop type, row crops accounted for 87.92% of the seed market size in 2025, whereas vegetable seeds are forecast to grow at a 5.52% CAGR from 2026 to 2031.
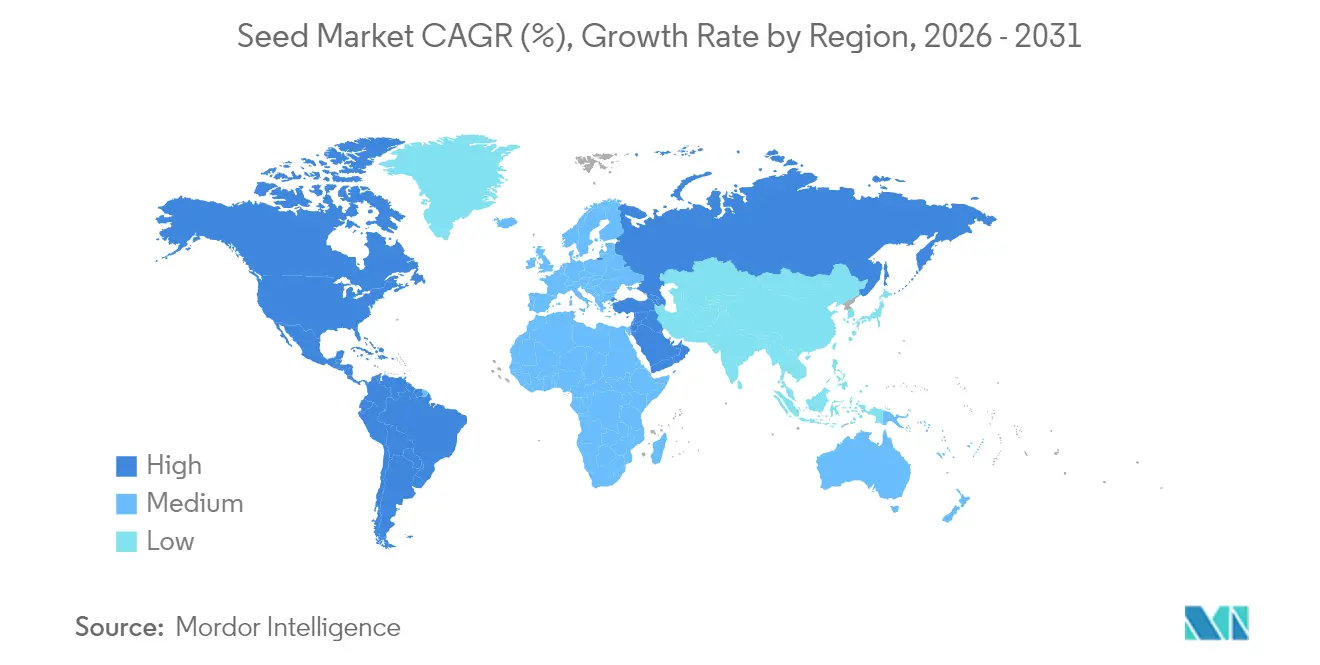
- By geography, North America led 34.86% of the seed market share in 2025, and are projected to rise at a 6.21% CAGR through 2031.
Note: Market size and forecast figures in this report are generated using Mordor Intelligence’s proprietary estimation framework, updated with the latest available data and insights as of 2026.
Global Seed Market Trends and Insights
Drivers Impact Analysis*
| Driver | (~) % Impact on CAGR Forecast | Geographic Relevance | Impact Timeline |
|---|---|---|---|
| Increasing Adoption of Hybrid and GM Seed Varieties to Enhance Crop Yields | +1.2% | Global, strongest in North America and Asia-Pacific | Medium term (2–4 years) |
| Technological Advancements in Seed Coating and Treatment Solutions | +0.8% | Global, led by North America and Europe | Short term (≤ 2 years) |
| Government Programs Boosting Certified Seed Replacement Rates | +0.9% | Asia-Pacific core, spill-over to the Middle East and Africa, and South America | Medium term (2–4 years) |
| Rising Demand for High-Value Crops Driven by Population and Diet Shifts | +0.7% | Global, focused on urban markets | Long term (≥ 4 years) |
| AI-Enabled Digital Phenotyping Shortening Breeding Cycles | +0.6% | North America and Europe, expanding to the Asia-Pacific | Long term (≥ 4 years) |
| Climate-Resilient Seed Traits Attracting Impact Capital | +0.5% | Global priority in climate-vulnerable regions | Long term (≥ 4 years) |
| Source: Mordor Intelligence | |||
Increasing Adoption of Hybrid and GM Seed Varieties to Enhance Crop Yields
Hybrid penetration already exceeds 90% in the United States corn and hovers near 70% in Indian rice, confirming that farmers overwhelmingly recognize the 15-30% yield premium delivered by heterosis effects [1]Source: USDA National Agricultural Statistics Service, “Corn and Soybean Yield Trends,” usda.gov. Transgenic stacks that once focused on weed and insect control now bundle drought tolerance, improved amino acid balance, and longer shelf life, which collectively broaden the agronomic and commercial appeal of modern hybrids [2]Source: Ministry of Agriculture, Livestock and Fisheries, “Approval of Drought-Tolerant Corn Varieties 2024,” argentina.gob.ar. Recent approvals for drought-tolerant corn in Argentina and Brazil indicate that regulators in major export economies are becoming more comfortable with climate-adaptive traits, encouraging private breeders to accelerate the development of multi-trait pipelines. Because hybrids need to be purchased every season, rising adoption also lifts certified seed replacement rates, which in turn attracts capital into breeding and distribution infrastructure. The virtuous cycle of higher productivity, dependable market access, and trait innovation keeps hybrid and GM seeds firmly at the core of commercial cropping systems. Continued investment in hybrid research secures a robust growth runway even where policy debates around gene editing remain unresolved.
Technological Advancements in Seed Coating and Treatment Solutions
Farmers are increasingly protecting their investment at the seed level, rather than applying multiple costly field sprays, which is pushing global seed treatment revenue into sustained double-digit growth [3]Source: Crop Protection Association, “Seed Treatment Market Update 2024,” cropprotection.org. Modern coatings combine chemical fungicides with biological agents, micronutrients, and polymer matrices, delivering targeted protection and nutrition exactly when seedlings are most vulnerable. Controlled-release layers meter active ingredients over weeks, which lowers environmental runoff and satisfies stricter residue standards that now shape many export markets. Bayer and Corteva each expanded their microbial platforms in 2024, utilizing proprietary bacteria and fungi that enhance nutrient uptake and mitigate early-season stress. These biologicals work synergistically with chemical actives, creating blended formulas that enhance stand establishment without increasing the total input load. As sustainability reporting gains importance, distributors promote seed treatments as a cost-effective means of reducing broad-acre pesticide footprints while maintaining high yield potential.
Government Programs Boosting Certified Seed Replacement Rates
Subsidy schemes embedded in India’s National Food Security Mission lifted certified seed usage to 45% in 2024, up ten percentage points in just four years. Similar approaches in Nigeria, Ethiopia, and Bangladesh pair financial incentives with seed quality labeling, giving farmers both lower prices and clearer performance guarantees. Public extension agents use demonstration plots to showcase yield gains, thereby breaking lingering skepticism toward commercial seed among smallholders who traditionally recycle grain from prior harvests. By formalizing distribution and quality checks, these programs also narrow the path for counterfeit seed, which historically eroded farmer trust and depressed replacement cycles. Higher certified seed penetration enhances domestic food security and reduces unit production costs, outcomes that align closely with broader national development goals. The predictable demand base created by government procurement finally enables regional breeders to scale research and deliver site-specific hybrids more consistently.
Rising Demand for High-Value Crops Driven by Population and Diet Shifts
Urban consumers with rising incomes increasingly purchase fresh vegetables, organic produce, and ethnic specialties, encouraging growers to diversify beyond bulk grain staples. Premium retail formats reward flavor, texture, and visual appeal, so seed companies focus on traits like uniform sizing, vibrant color retention, and post-harvest durability. Vertical farms and rooftop greenhouses operating near megacities favor compact, quick-cycling varieties that maximize turnover in limited space, creating entirely new genetic design criteria. The organic segment in particular channels demand toward non-synthetic disease resistance and nutrient density, keeping breeding targets fluid and differentiated. Because high-value crops typically command better margins, farmers are willing to invest in specialized seeds, even when unit costs greatly exceed those of commodity hybrids. This willingness to pay sustains a feedback loop in which breeders finance ever more granular trait packages for niche culinary preferences.
Restraints Impact Analysis*
| Restraint | (~) % Impact on CAGR Forecast | Geographic Relevance | Impact Timeline |
|---|---|---|---|
| Stringent Biosafety Regulations and Multi-Year Approval Timelines | -0.7% | Global, most restrictive in the European Union and parts of Asia | Long term (≥ 4 years) |
| Rising Seed Prices Limiting Access for Smallholder Farmers | -0.5% | Asia-Pacific, the Middle East and Africa, and South America rural markets | Medium term (2–4 years) |
| Farmer-Led Seed-Saving Movements in Emerging Markets | -0.4% | Asia-Pacific, and Middle East, and Africa traditional regions | Long term (≥ 4 years) |
| Uncertain Clustered Regularly Interspaced Short Palindromic Repeats (CRISPR) Seed Policies in European Union and China | -0.3% | Europe and China, global spillover on R&D | Long term (≥ 4 years) |
| Source: Mordor Intelligence | |||
Stringent Biosafety Regulations and Multi-Year Approval Timelines
Bringing a single GM trait from concept through international approval typically costs up to USD 150 million and seven years, which locks smaller innovators out of markets that most need yield breakthroughs. The European Union continues to employ a precautionary approach that limits new cultivation, while China’s evolving guidelines still cap scale beyond pilot deployment. Such extensive data requirements and public-comment cycles escalate development budgets and delay global launch synchrony, forcing companies to stagger introductions. The time lag hampers farmer access to climate-ready genetics, prolonging exposure to weather risks and pest evolution. Regulatory fragmentation also drives redundant field trials and paperwork, thereby diluting research capital that could otherwise be used to fund additional trait discovery. Until greater alignment emerges, even well-capitalized firms will prioritize geographies with faster, science-based approval tracks.
Rising Seed Prices Limiting Access for Smallholder Farmers
Hybrid seed prices in India and Brazil increased by 15% to 20% in 2024, outpacing farm-gate commodity prices and squeezing net margins for resource-constrained growers. Research spending, patent maintenance, and regulatory compliance all feed into higher catalog prices, while weak rural credit systems make pre-season seed purchases increasingly burdensome. Price pressure prompts continued reliance on farm-saved seed and informal exchanges, which can undermine varietal purity and stall genetic gain. Programs that offer subsidized credit or group buying help, but often miss remote regions where banking infrastructure is thin. Without scalable affordability mechanisms, hybrid adoption curves in many low-income areas remain flatter than agronomic potential would suggest. Reduced adoption also dampens local dealer volumes, limiting incentive for private distributors to penetrate deeper into rural markets.
*Our forecasts treat driver/restraint impacts as directional, not additive. The impact forecasts reflect baseline growth, mix effects, and variable interactions.
Segment Analysis
By Breeding Technology: Hybrids Dominate Innovation Pipeline
Hybrid seeds generated 72.65% of 2025 revenue within the seed market, and are projected to advance at a 5.47% CAGR through 2031. This dominance springs from heterosis gains that increase yields by up to 30%, encouraging farmers to absorb higher seed costs for dependable returns. In markets where GM regulation remains strict, non-transgenic hybrids still enjoy robust uptake as breeders select for disease tolerance through marker-assisted selection and genomic prediction. Digital phenotyping further accelerates hybrid cycles by pairing imaging data with genomic scores, trimming development timelines, and lowering unit costs.
Transgenic hybrids move fastest in South America and North America, where the approvals of drought-tolerant corn and insect-protected soybeans spread rapidly. The seed market size for transgenic hybrids is projected to expand steadily as stacked traits, including nitrogen-use efficiency and biofortification, clear regulatory hurdles. Clustered Regularly Interspaced Short Palindromic Repeats (CRISPR) edits, while still navigating policy uncertainties, promise higher precision and reduced linkage drag, widening the breeding toolbox beyond conventional hybridization.


By Cultivation Mechanism: Protected Systems Transform Production
Open fields held 99.55% of the seed market share in 2025, while protected cultivation grew at a 7.18% CAGR. Rising climate volatility prompts growers to shift to greenhouses and net houses that shield crops from heatwaves and heavy rains, thereby lowering risk and extending growing seasons. In densely populated cities across the Asia-Pacific region, rooftop farms and hydroponic facilities provide fresh produce with shorter supply chains, which fetches premium pricing. The Netherlands showcases best practices, with glasshouse yields 20 times higher per square meter than open plots, driving global knowledge transfer in lighting, climate control, and nutrient delivery.
Seed companies now target protected cultivation with bespoke varieties possessing compact architecture, short internodes, and uniform fruit sets. The seed market size within protected systems benefits from repeat purchases since multi-cycle growers often replace seed every few weeks to maximize turnover. Such specialized genetics create new revenue pools and higher gross margins compared with commodity row crop lines.
By Crop Type: Vegetables Accelerate Growth
Row crops captured 87.92% of the seed market revenue in 2025, primarily due to the vast scale of corn, soybean, wheat, and cotton cultivation. Even so, vegetable seeds are projected to lead growth at a 5.52% CAGR, fueled by healthy eating trends, expanding middle-class budgets, and rapid urbanization. Tomatoes, peppers, cucumbers, and leafy greens command premium pricing due to their limited volumes and intricate breeding for enhanced flavor, texture, and post-harvest life. Protected cultivation aligns with vegetable demand, enabling a year-round supply and stable quality, which in turn strengthens seed replacement cycles.
Pulse crops, such as chickpeas and lentils, are gaining traction in India, Canada, and Turkey, where plant-protein diets are receiving policy encouragement. Forage seeds, especially alfalfa and forage corn, sustain steady growth tied to cattle and dairy demand. Seed companies focus on digestibility and persistence to appeal to livestock operations interested in feed efficiency and methane reduction.
Geography Analysis
North America controls the largest portion of the seed revenue at 34.86% in 2025 and is also projected to record the quickest expansion with a 6.21% CAGR through 2031. Robust biotechnology frameworks and extensive digital agriculture tools allow growers to adopt new hybrids faster than any other region. Large commodity farms in the United States continue to invest in stacked-trait corn and soybean genetics, while Canadian programs add high-oil canola and winter-hardy wheat lines. Mexico contributes rising vegetable seed demand tied to greenhouse expansion along export corridors. These converging factors keep the region on a sturdy upward trajectory despite periodic volatility in fertilizer and fuel costs.
Europe maintains steady momentum as specialty vegetable hubs in the Netherlands, France, and Spain focus on flavor and shelf-life gains that meet premium retail standards. Strict regulations on genetically modified crops shift breeding budgets toward marker-assisted disease resistance and lower-input traits aligned with the European Green Deal. Organic acreage growth broadens interest in non-synthetic treatments and heritage cultivars, opening room for niche suppliers. The United Kingdom’s evolving post-Brexit rules create additional scope for region-specific trait portfolios. Climate resilience remains a prime concern as the continent faces more frequent drought and heat episodes.
Asia-Pacific remains the second-largest revenue contributor because of China’s and India’s vast planted areas, even though growth now trails the Americas. Government subsidies in India and yield-oriented hybrid rice in Southeast Asia steadily lift replacement rates for certified seed. South America benefits from continued soybean and corn expansion in Brazil and rapid regulatory approval of drought-tolerant hybrids in Argentina. The Middle East and Africa follow with longer-term upside linked to irrigation projects and subsidy programs that improve farmer access to improved genetics. Together, these regions add scale, diversification, and risk-balancing depth to the worldwide seed value chain.

Competitive Landscape
The seed market exhibits moderate concentration, with the major companies collectively holding a significant share of 2024 sales, leaving ample room for regional and niche competitors. Bayer AG stands first, leveraging Monsanto's heritage plus its own crop protection portfolio to offer integrated packages. Corteva, Inc., bolstered by Pioneer’s corn dominance and the growth of the biologicals segment following its acquisition of Symborg in 2024. Syngenta Group, BASF SE, and Groupe Limagrain Holding each hold a market share, employing targeted acquisitions and regional partnerships to remain competitive.
Strategic patterns in the industry emphasize vertical integration, digital agriculture capabilities, and geographic expansion to capture growth in emerging markets. Companies are investing heavily in AI-driven breeding platforms, CRISPR gene editing technologies, and climate-resilient trait development to differentiate their product portfolios and accelerate variety development cycles. White-space opportunities exist in specialty crops, organic seeds, and climate-adaptive varieties where traditional commodity-focused companies have limited presence.
Emerging disruptors leverage advanced genomics, machine learning, and precision breeding techniques to challenge established players, particularly in vegetable seeds and specialty crop segments where innovation cycles are faster and market entry barriers are lower. The industry's regulatory compliance requirements under frameworks like OECD seed certification schemes create both barriers to entry and opportunities for companies with specialized regulatory expertise.
Seed Industry Leaders
Bayer AG
Corteva, Inc.
BASF SE
Syngenta Group
Groupe Limagrain Holding
- *Disclaimer: Major Players sorted in no particular order


Recent Industry Developments
- May 2025: Syngenta entered a multi-year collaboration with Tropic Biosciences to fast-track gene-edited coffee, rice, and banana varieties that feature stronger disease resistance and better nutritional profiles. The partners will apply Tropic’s GEiGS gene-editing platform to move these crops toward commercial release.
- April 2025: Bayer introduced the Channel seed brand in the United States to help price-sensitive growers gain access to dependable corn, soybean, and cotton genetics that do not carry premium trait stacks. The launch broadens Bayer’s portfolio beyond its higher-priced Dekalb and Asgrow lines.
- March 2025: Bayer opened a maize seed production plant in Zambia that can supply enough seed to serve about 30 million people across Southern Africa. The facility strengthens regional food security goals by giving local farmers better access to improved hybrids.
- October 2024: Corteva announced plans to split into two publicly traded entities. The Crop Protection arm is projected to operate as New Corteva with projected 2025 net sales of USD 7.8 billion, while the Seed arm, temporarily called SpinCo, is projected to post USD 9.9 billion in 2025 net sales. The tax-free separation is slated for completion in the second half of 2026.


Global Seed Market Report Scope
By Breeding Technology
| Hybrids | Non-Transgenic Hybrids | |
| Transgenic Hybrids | Herbicide Tolerant Hybrids | |
| Insect Resistant Hybrids | ||
| Other Traits | ||
| Open Pollinated Varieties & Hybrid Derivatives | ||
By Cultivation Mechanism
| Open Field |
| Protected Cultivation |
By Crop Type
| Row Crops | Fiber Crops | Cotton |
| Other Fiber Crops | ||
| Forage Crops | Alfalfa | |
| Forage Corn | ||
| Forage Sorghum | ||
| Other Forage Crops | ||
| Grains & Cereals | Corn | |
| Rice | ||
| Sorghum | ||
| Wheat | ||
| Other Grains & Cereals | ||
| Oilseeds | Canola, Rapeseed & Mustard | |
| Soybean | ||
| Sunflower | ||
| Other Oilseeds | ||
| Pulses | ||
| Vegetables | Brassicas | Cabbage |
| Cauliflower & Broccoli | ||
| Other Brassicas | ||
| Cucurbits | Cucumber & Gherkin | |
| Pumpkin & Squash | ||
| Other Cucurbits | ||
| Roots & Bulbs | Garlic | |
| Onion | ||
| Potato | ||
| Other Roots & Bulbs | ||
| Solanaceae | Chilli | |
| Eggplant | ||
| Tomato | ||
| Other Solanaceae | ||
| Unclassified Vegetables | Asparagus | |
| Lettuce | ||
| Carrot | ||
| Okra | ||
| Peas | ||
| Spinach | ||
| Other Unclassified Vegetables | ||
By Geography
| North America | Canada |
| Mexico | |
| United States | |
| Rest of North America | |
| Europe | France |
| Germany | |
| Italy | |
| Netherlands | |
| Poland | |
| Romania | |
| Russia | |
| Spain | |
| Turkey | |
| Ukraine | |
| United Kingdom | |
| Rest of Europe | |
| Asia-Pacific | Australia |
| Bangladesh | |
| China | |
| India | |
| Indonesia | |
| Japan | |
| Myanmar | |
| Pakistan | |
| Philippines | |
| Thailand | |
| Vietnam | |
| Rest of Asia-Pacific | |
| South America | Argentina |
| Brazil | |
| Rest of South America | |
| Middle East and Africa | Iran |
| Saudi Arabia | |
| Egypt | |
| Ethiopia | |
| Ghana | |
| Kenya | |
| Nigeria | |
| South Africa | |
| Tanzania | |
| Rest of Middle East and Africa |
| By Breeding Technology | Hybrids | Non-Transgenic Hybrids | |
| Transgenic Hybrids | Herbicide Tolerant Hybrids | ||
| Insect Resistant Hybrids | |||
| Other Traits | |||
| Open Pollinated Varieties & Hybrid Derivatives | |||
| By Cultivation Mechanism | Open Field | ||
| Protected Cultivation | |||
| By Crop Type | Row Crops | Fiber Crops | Cotton |
| Other Fiber Crops | |||
| Forage Crops | Alfalfa | ||
| Forage Corn | |||
| Forage Sorghum | |||
| Other Forage Crops | |||
| Grains & Cereals | Corn | ||
| Rice | |||
| Sorghum | |||
| Wheat | |||
| Other Grains & Cereals | |||
| Oilseeds | Canola, Rapeseed & Mustard | ||
| Soybean | |||
| Sunflower | |||
| Other Oilseeds | |||
| Pulses | |||
| Vegetables | Brassicas | Cabbage | |
| Cauliflower & Broccoli | |||
| Other Brassicas | |||
| Cucurbits | Cucumber & Gherkin | ||
| Pumpkin & Squash | |||
| Other Cucurbits | |||
| Roots & Bulbs | Garlic | ||
| Onion | |||
| Potato | |||
| Other Roots & Bulbs | |||
| Solanaceae | Chilli | ||
| Eggplant | |||
| Tomato | |||
| Other Solanaceae | |||
| Unclassified Vegetables | Asparagus | ||
| Lettuce | |||
| Carrot | |||
| Okra | |||
| Peas | |||
| Spinach | |||
| Other Unclassified Vegetables | |||
| By Geography | North America | Canada | |
| Mexico | |||
| United States | |||
| Rest of North America | |||
| Europe | France | ||
| Germany | |||
| Italy | |||
| Netherlands | |||
| Poland | |||
| Romania | |||
| Russia | |||
| Spain | |||
| Turkey | |||
| Ukraine | |||
| United Kingdom | |||
| Rest of Europe | |||
| Asia-Pacific | Australia | ||
| Bangladesh | |||
| China | |||
| India | |||
| Indonesia | |||
| Japan | |||
| Myanmar | |||
| Pakistan | |||
| Philippines | |||
| Thailand | |||
| Vietnam | |||
| Rest of Asia-Pacific | |||
| South America | Argentina | ||
| Brazil | |||
| Rest of South America | |||
| Middle East and Africa | Iran | ||
| Saudi Arabia | |||
| Egypt | |||
| Ethiopia | |||
| Ghana | |||
| Kenya | |||
| Nigeria | |||
| South Africa | |||
| Tanzania | |||
| Rest of Middle East and Africa | |||


Market Definition
- Commercial Seed - For the purpose of this study, only commercial seeds have been included as part of the scope. Farm-saved Seeds, which are not commercially labeled are excluded from scope, even though a minor percentage of farm-saved seeds are exchanged commercially among farmers. The scope also excludes vegetatively reproduced crops and plant parts, which may be commercially sold in the market.
- Crop Acreage - While calculating the acreage under different crops, the Gross Cropped Area has been considered. Also known as Area Harvested, according to the Food & Agricultural Organization (FAO), this includes the total area cultivated under a particular crop across seasons.
- Seed Replacement Rate - Seed Replacement Rate is the percentage of area sown out of the total area of crop planted in the season by using certified/quality seeds other than the farm-saved seed.
- Protected Cultivation - The report defines protected cultivation as the process of growing crops in a controlled environment. This includes greenhouses, glasshouses, hydroponics, aeroponics, or any other cultivation system that protects the crop against any abiotic stress. However, cultivation in an open field using plastic mulch is excluded from this definition and is included under open field.
| Keyword | Definition |
|---|---|
| Row Crops | These are usually the field crops which include the different crop categories like grains & cereals, oilseeds, fiber crops like cotton, pulses, and forage crops. |
| Solanaceae | These are the family of flowering plants which includes tomato, chili, eggplants, and other crops. |
| Cucurbits | It represents a gourd family consisting of about 965 species in around 95 genera. The major crops considered for this study include Cucumber & Gherkin, Pumpkin and squash, and other crops. |
| Brassicas | It is a genus of plants in the cabbage and mustard family. It includes crops such as carrots, cabbage, cauliflower & broccoli. |
| Roots & Bulbs | The roots and bulbs segment includes onion, garlic, potato, and other crops. |
| Unclassified Vegetables | This segment in the report includes the crops which don’t belong to any of the above-mentioned categories. These include crops such as okra, asparagus, lettuce, peas, spinach, and others. |
| Hybrid Seed | It is the first generation of the seed produced by controlling cross-pollination and by combining two or more varieties, or species. |
| Transgenic Seed | It is a seed that is genetically modified to contain certain desirable input and/or output traits. |
| Non-Transgenic Seed | The seed produced through cross-pollination without any genetic modification. |
| Open-Pollinated Varieties & Hybrid Derivatives | Open-pollinated varieties produce seeds true to type as they cross-pollinate only with other plants of the same variety. |
| Other Solanaceae | The crops considered under other Solanaceae include bell peppers and other different peppers based on the locality of the respective countries. |
| Other Brassicaceae | The crops considered under other brassicas include radishes, turnips, Brussels sprouts, and kale. |
| Other Roots & Bulbs | The crops considered under other roots & bulbs include Sweet Potatoes and cassava. |
| Other Cucurbits | The crops considered under other cucurbits include gourds (bottle gourd, bitter gourd, ridge gourd, Snake gourd, and others). |
| Other Grains & Cereals | The crops considered under other grains & cereals include Barley, Buck Wheat, Canary Seed, Triticale, Oats, Millets, and Rye. |
| Other Fibre Crops | The crops considered under other fibers include Hemp, Jute, Agave fibers, Flax, Kenaf, Ramie, Abaca, Sisal, and Kapok. |
| Other Oilseeds | The crops considered under other oilseeds include Ground nut, Hempseed, Mustard seed, Castor seeds, safflower seeds, Sesame seeds, and Linseeds. |
| Other Forage Crops | The crops considered under other forages include Napier grass, Oat grass, White clover, Ryegrass, and Timothy. Other forage crops were considered based on the locality of the respective countries. |
| Pulses | Pigeon peas, Lentils, Broad and horse beans, Vetches, Chickpeas, Cowpeas, Lupins, and Bambara beans are the crops considered under pulses. |
| Other Unclassified Vegetables | The crops considered under other unclassified vegetables include Artichokes, Cassava Leaves, Leeks, Chicory, and String beans. |


Research Methodology
Mordor Intelligence follows a four-step methodology in all our reports.
- Step-1: IDENTIFY KEY VARIABLES: In order to build a robust forecasting methodology, the variables and factors identified in Step-1 are tested against available historical market numbers. Through an iterative process, the variables required for market forecast are set and the model is built on the basis of these variables.
- Step-2: Build a Market Model: Market-size estimations for the forecast years are in nominal terms. Inflation is not a part of the pricing, and the average selling price (ASP) is kept constant throughout the forecast period.
- Step-3: Validate and Finalize: In this important step, all market numbers, variables and analyst calls are validated through an extensive network of primary research experts from the market studied. The respondents are selected across levels and functions to generate a holistic picture of the market studied.
- Step-4: Research Outputs: Syndicated Reports, Custom Consulting Assignments, Databases, and Subscription Platforms


