SOAR Market Size and Share
Market Overview
| Study Period | 2019 - 2030 |
|---|---|
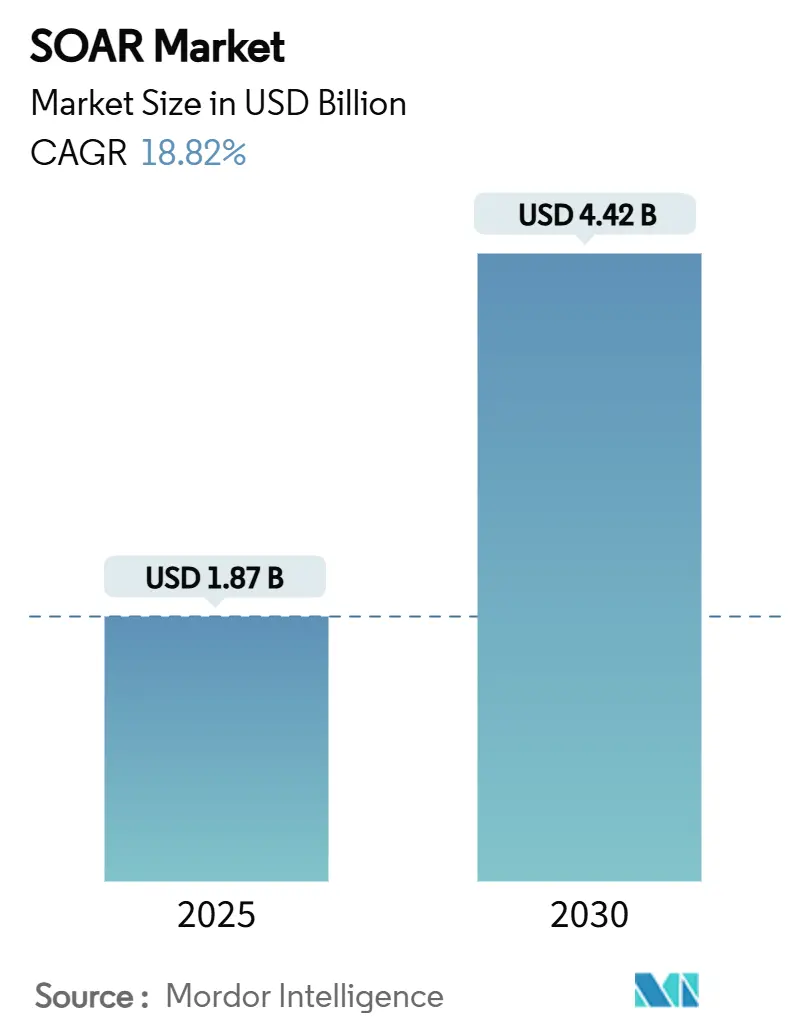
| Market Size (2025) | USD 1.87 Billion |
| Market Size (2030) | USD 4.42 Billion |
| Growth Rate (2025 - 2030) | 18.82% CAGR |
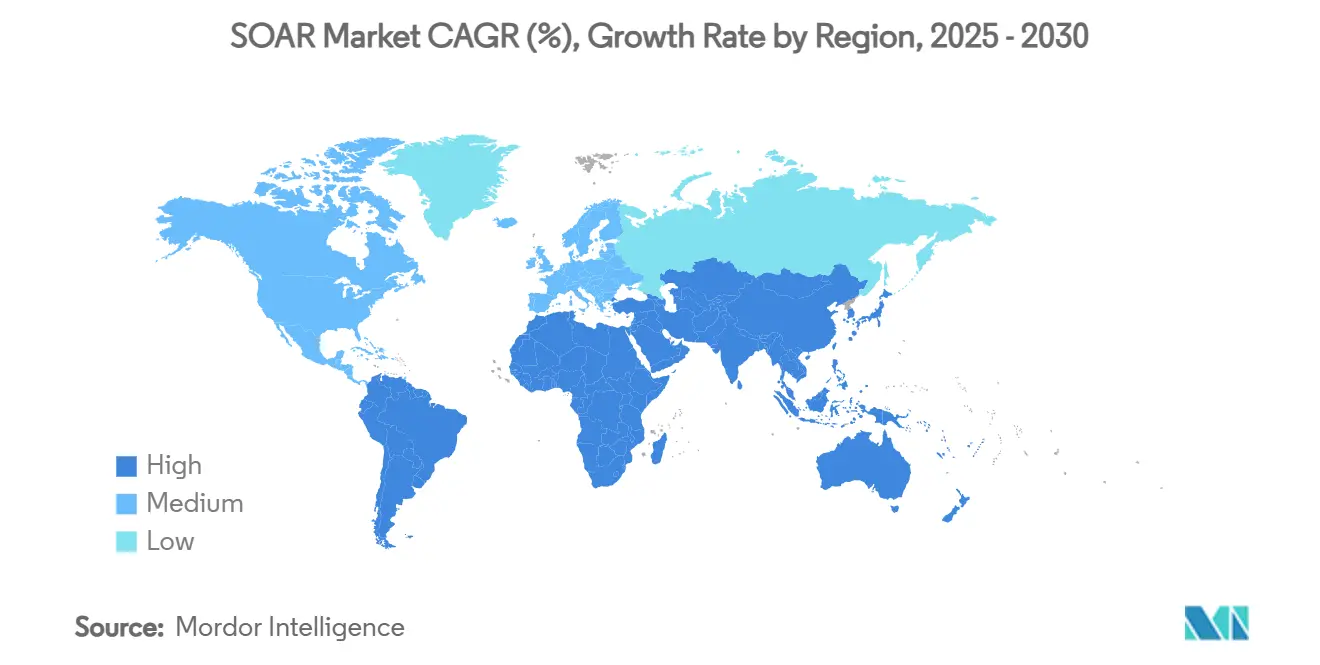
| Fastest Growing Market | Asia Pacific |
| Largest Market | North America |
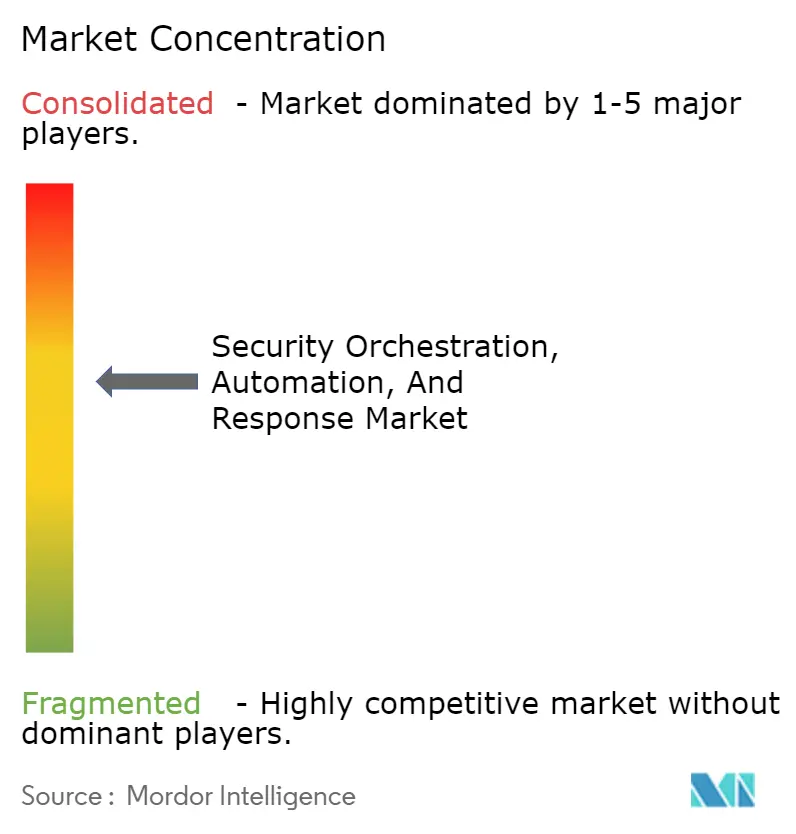
| Market Concentration | Medium |
Major Players *Disclaimer: Major Players sorted in no particular order Image © Mordor Intelligence. Reuse requires attribution under CC BY 4.0. | |
SOAR Market Analysis by Mordor Intelligence
The SOAR market size is USD 1.87 billion in 2025 and is forecast to reach USD 4.42 billion by 2030, registering an 18.82% CAGR. Rising cyber incidents, shrinking analyst headcounts, and federal mandates are pushing enterprises toward automated, AI-assisted defense platforms that triage thousands of alerts in real time. Generative AI, cloud-first architectures, and composable security operations centers (SOCs) accelerate adoption, while cyber-insurance incentives and Zero Trust frameworks cement automation as a must-have rather than a discretionary spend. Market leaders aggressively pursue phantomization strategies-exemplified by Cisco-Splunk and Palo Alto Networks-IBM deals-which simplify tool sprawl and enhance ROI through integrated XDR, SIEM, and SOAR capabilities. Asia-Pacific, aided by stringent regulations and rapid digital transformation, records the fastest growth trajectory, whereas North America maintains scale leadership due to mature cyber-insurance ecosystems and federal funding programs.
Key Report Takeaways
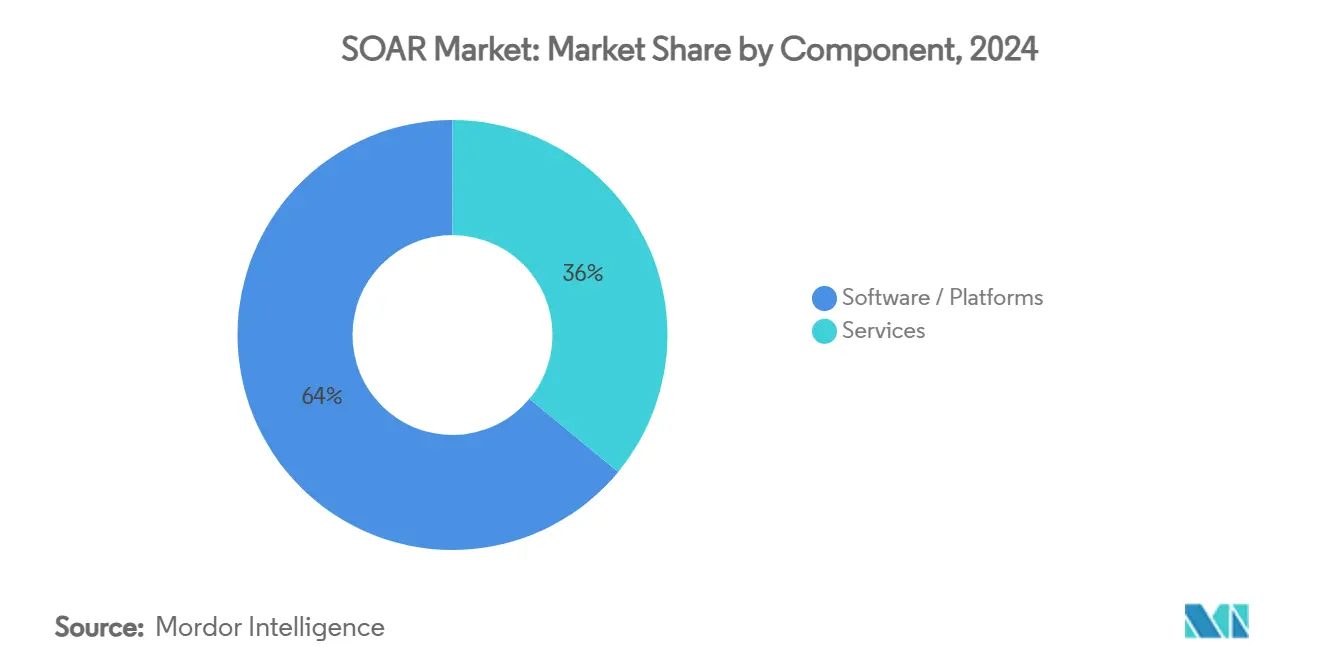
- By component, software platforms held 64% of the SOAR market share in 2024, while services expand at a 17.8% CAGR through 2030.
- By deployment mode, cloud deployments captured 71% of the SOAR market size in 2024 and advance at 21.4% CAGR between 2025-2030.
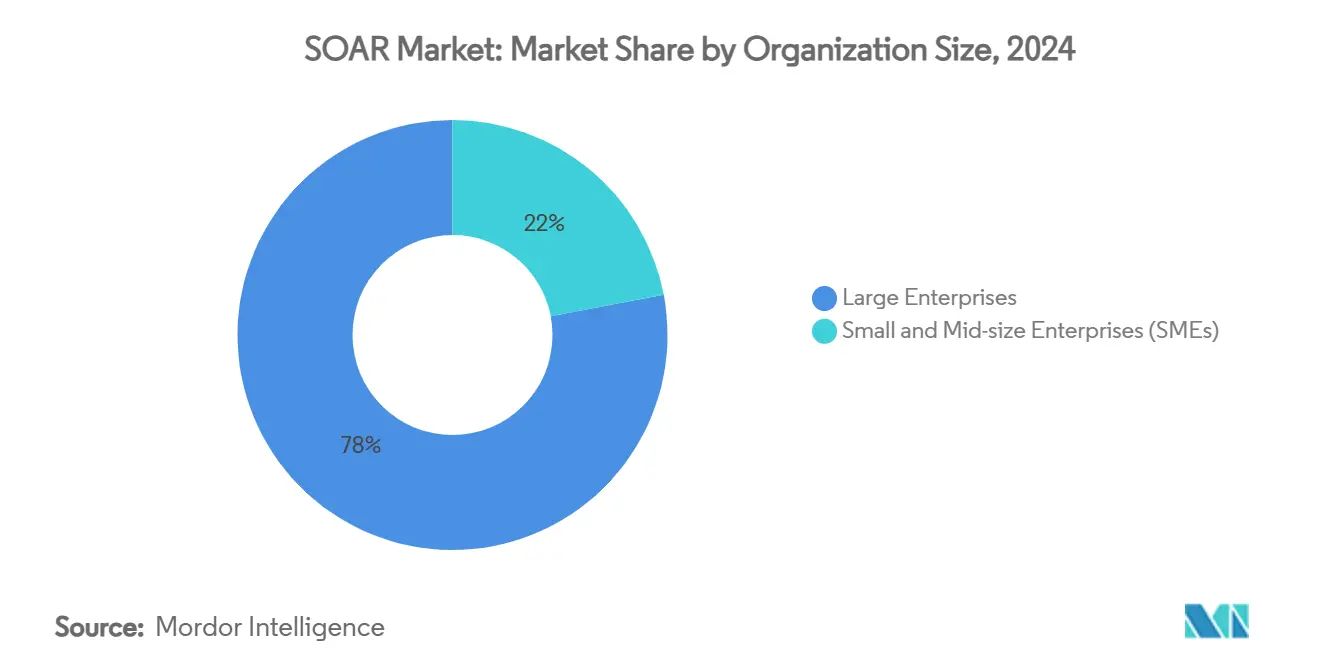
- By organization size, SMEs post the highest 19.6% CAGR through 2030, though large enterprises retained 78% revenue share in 2024.
- By vertical, Banking, Financial Services, and Insurance led with 29% revenue share in 2024; Healthcare and Life Sciences accelerates at an 18.9% CAGR to 2030.
- By geography, North America commanded 43% share in 2024, whereas Asia-Pacific is projected to grow at an 18.7% CAGR through 2030.
Global SOAR Market Trends and Insights
Drivers Impact Analysis*
| Driver | (~) % Impact on CAGR Forecast | Geographic Relevance | Impact Timeline |
|---|---|---|---|
| Escalating alert volumes and complexity | +4.20% | Global | Short term (≤ 2 years) |
| Compliance-driven automation mandates | +3.80% | North America and EU | Medium term (2-4 years) |
| Cyber-talent scarcity | +3.10% | Global | Long term (≥ 4 years) |
| Gen-AI playbook acceleration | +2.90% | North America and APAC | Short term (≤ 2 years) |
| Cyber-insurance premium incentives | +1.70% | North America and EU | Medium term (2-4 years) |
| API-first "composable SOC" uptake | +1.50% | Global | Medium term (2-4 years) |
| Source: Mordor Intelligence | |||
Escalating Alert Volumes and Complexity
Organizations confront an unprecedented flood of security events, with multi-vendor endpoints and microservices regularly generating millions of logs per day.[1]Swimlane, “Measure SOC ROI with Metrics and Dashboards,” swimlane.com Manual triage overwhelms analysts, exacerbating burnout and prolonging dwell time. SOAR implementations cut investigation cycles by as much as 75% and drive an 82% decrease in unplanned downtime, making automation indispensable for cyber-resilience. Cloud-native businesses, whose distributed workloads amplify event noise, realize outsized value from AI-driven correlation engines that prioritize alerts. Advanced attackers increasingly weaponize AI, so defensive stacks must keep pace through machine-generated playbooks and autonomous response routines. As enterprises scale microservices, alert volume growth remains non-linear, locking in sustained demand for orchestration platforms.
Compliance-Driven Automation Mandates
Regulators are embedding automation into cybersecurity expectations. Under GDPR, proof of rapid breach containment is now essential, driving identity-centric orchestration spending above USD 16 billion annually.[2]CSO Online, “GDPR turbocharges identity and access management spending,” csoonline.com In the United States, the FY 2022 National Defense Authorization Act earmarked USD 25 million for Department of Defense SOAR pilots, signalling state-level confidence in automated response. PCI-DSS 4.0, HIPAA, and Gramm-Leach-Bliley Act revisions similarly codify automated logging and incident linkage. Auditors increasingly request workflow evidence, making platform-generated audit trails a prerequisite for passing inspections. The European Union’s Cyber Resilience Act, set to mature by 2026, is expected to push automation deeper into operational technology and critical-infrastructure sectors.
Cyber-Talent Scarcity
Globally, 3.4 million cybersecurity roles remain unfilled, a gap that widened 26.2% between 2021-2022. Over-stretched teams routinely ignore lower-priority alerts, creating blind spots attackers exploit. SOAR platforms automate Tier-1 tasks-collecting telemetry, enriching events, and executing containment-so scarce analysts focus on proactive hunting. Torq’s AI-native autonomous SOC handles 95% routine incidents without human touch, underscoring the labour-savings multiplier. Managed security service providers (MSSPs) leverage SOAR to deliver turnkey operations, letting clients sidestep staffing battles. Vendors are integrating conversational AI assistants into consoles, shrinking the learning curve and magnifying the productivity of junior analysts.
Gen-AI Playbook Acceleration
Generative AI revolutionizes playbook building. Palo Alto Networks employs retrieval-augmented generation within Cortex XSOAR to design context-rich workflows in minutes rather than months. Telefónica Tech recorded a 48% cut in mean-time-to-investigate and a 60% lift in automated resolutions after layering large language models into its SOC pipeline. FortiSOAR’s AI Assistant connector autogenerates remediation steps, easing upkeep burdens. Dynamic, self-adapting runbooks diminish brittle, hard-coded integrations, allowing SOCs to pivot as attacker tactics evolve. Although critical decision nodes still require human sign-off in regulated sectors, Gen-AI materially collapses response latency and playbook maintenance cost.
Cyber-Insurance Premium Incentives
Insurance carriers now embed automation criteria into underwriting. Firms that prove rapid containment and forensic evidence trails can reduce premiums by 10%-15%, a differential that outweighs SOAR subscription costs. In sectors like healthcare and finance, where policy deductibles trend upward, automation-driven savings materially affect budgets. Underwriters also leverage SOAR telemetry for claims verification, shortening payout cycles. This mutually beneficial loop-lower risk for insurers, lower cost for insured-reinforces adoption momentum, especially in litigious North American and EU markets.
Restraints Impact Analysis*
| Restraint | (~) % Impact on CAGR Forecast | Geographic Relevance | Impact Timeline |
|---|---|---|---|
| Legacy tool-set integration debt | -2.80% | Global | Medium term (2-4 years) |
| Budget constraints among SMBs | -2.10% | Global, particularly APAC | Long term (≥ 4 years) |
| Gen-AI IP-leakage concerns | -1.40% | EU and regulated industries | Short term (≤ 2 years) |
| SIEM / XDR bundling cannibalization | -1.70% | North America and EU | Medium term (2-4 years) |
| Source: Mordor Intelligence | |||
Legacy Tool-Set Integration Debt
Decade-old SIEM appliances often lack modern APIs and struggle with cloud telemetry, forcing costly custom connectors or parallel pipelines. Migrating to lake-centric architectures demands retraining staff and refactoring detection rules, expenditures many firms hesitate to undertake. Multi-SIEM estates further complicate normalization, while proprietary log formats limit data portability. Until vendors bundle turnkey connectors or offer migration incentives-such as Palo Alto Networks’ free QRadar SaaS migration services-the upgrade cycle slows widespread SOAR penetration.
Budget Constraints Among SMBs
SMBs account for over 90% of all businesses in APAC, yet bank lending to the segment hovers at 9% of GDP, capping cyber-security spending headroom. SOAR subscription fees, integration projects, and staff upskilling inflate total cost of ownership beyond what lean budgets can justify. Hidden expenses-performance degradation, tool overlap, and compliance audits-compound financial strain. Vendors are countering with SaaS price tiers, templated playbooks, and managed-services bundles, yet adoption lags in price-sensitive markets.
*Our forecasts treat driver/restraint impacts as directional, not additive. The impact forecasts reflect baseline growth, mix effects, and variable interactions.
Segment Analysis
By Component: Services Gain Momentum
Services captured growing attention even though software dominated 64% revenue share in 2024. The SOAR market size for services is projected to expand at 20.8% CAGR, reflecting acute demand for specialist implementation, playbook customization, and managed SOC operations. MSSPs such as Red Canary now bundle Cortex XSIAM into turnkey offerings, illustrating how providers monetize automation expertise.[3]Palo Alto Networks, “Red Canary Partnership for Cortex XSIAM,” paloaltonetworks.com Professional services cover integration with ticketing, CMDB, and DevOps pipelines-areas that often stall in-house projects.
Managed services resonate with resource-constrained SMEs and compliance-driven sectors seeking 24/7 coverage. IBM’s shift toward preferred managed provider status for Palo Alto customers exemplifies vendor pivots from license-centric business to recurring service revenue. As Gen-AI accelerates playbook complexity, continuous tuning becomes essential, intensifying reliance on external domain experts and embedding services further into the revenue mix of the SOAR market.


By Deployment Mode: Cloud Dominance Accelerates
Cloud deployments controlled 71% of the SOAR market share in 2024, propelled by API-first designs that synchronize hybrid assets at speed. The SOAR market size for cloud solutions grows at a 24.4% CAGR through 2030 as organizations adopt Zero Trust models demanding dynamic, location-agnostic policy enforcement. Continuous vendor updates, elastic compute, and native threat-intel feeds give cloud-first platforms a functional edge over on-premises rival.
Government, defense, and highly regulated utilities still favour on-premises or sovereign-cloud deployments to retain data control. Hybrid modes are emerging, where orchestration logic resides in the cloud while sensitive logs stay on-site, balancing compliance with functionality. Federal cloud security reference architectures in the United States explicitly call out automation and orchestration pillars, normalizing cloud SOAR adoption in public sector environments.
By Organisation Size: SME Adoption Accelerates
Large enterprises accounted for 78% revenue in 2024, yet SMEs exhibit the most rapid 22.6% CAGR through 2030, narrowing the functionality gap with large peers. Cloud SaaS has democratized access; low-code interfaces and templated playbooks reduce setup time from months to weeks, making the SOAR market accessible to smaller security teams.
Skills shortages hurt SMEs disproportionately, elevating automation from “nice-to-have” to existential necessity. Vendors increasingly bundle MSP support hours into base licenses, providing virtual analysts. In parallel, large enterprises pursue advanced features-cross-tenant orchestration, data-lake integrations, and AI-driven threat hunting-that raise switching costs and entrench incumbent platforms.
By Industry Vertical: Healthcare Emerges as Growth Leader
BFSI retained a 29% share in 2024, driven by stringent compliance and high asset attractiveness. Yet Healthcare and Life Sciences leads expansion with an 21.9% CAGR as connected devices and patient-data regulations converge. The SOAR market size for medical environments grows alongside IoMT adoption, where every infusion pump or MRI machine becomes a potential attack vector. Generative-AI-based device profiling from vendors such as Cynerio tailors’ orchestration to clinical workflows, slashing mean-time-to-contain for ransomware events.
Government and defense agencies implement SOAR under Zero Trust roadmaps, while IT and Telecom operators rely on orchestration to manage multi-tenant, high-volume ticket streams. Retail, energized by omnichannel fraud risks, and energy utilities, pressured by critical-infrastructure directives, also show double-digit adoption growth, though from smaller bases.
Geography Analysis
North America held 43% of global revenue in 2024 thanks to federal cybersecurity grants, advanced cyber-insurance markets, and a deep vendor ecosystem. CISA’s May 2025 SIEM-SOAR guidance further institutionalizes automation expectations, urging executive boards to budget for orchestration layers.[4]CISA, “New Guidance for SIEM and SOAR Implementation,” cisa.gov Public-private initiatives, including Johns Hopkins APL’s pilot programs, spread best practices to state and municipal SOCs, consolidating regional leadership.
Asia-Pacific registers the fastest 18.7% CAGR through 2030, propelled by accelerated digitization in India, Indonesia, and the Philippines, and by regulatory crackdowns in Singapore, Japan, and Australia. Cyber-insurance uptake, growing almost 50% per year, creates tangible financial benefits for automated response, nudging boards toward SOAR procurement. Vendors deepen regional partnerships-ServiceNow’s investments in inMorphis and Prodapt are prime examples-to localize playbooks and meet data-residency rules.
Europe maintains steady mid-teens growth, anchored in GDPR and upcoming Cyber Resilience Act mandates. Data-sovereignty concerns spur interest in hybrid deployments and European-hosted cloud regions. Germany’s industrial automation sector demands SOAR integrations with operational-technology firewalls, whereas Nordic governments automate incident response across healthcare systems to secure citizen data. Brexit forces UK enterprises to juggle EU and domestic rules, elevating the value of workflow engines that can prove compliance across heterogeneous frameworks.

Competitive Landscape
Market concentration is tightening yet remains moderate as incumbents jostle with AI-native disruptors. Palo Alto Networks, already capturing USD 4.8 billion in next-generation security ARR by fiscal Q2 2025, fortifies Cortex XSIAM through its USD 500 million QRadar SaaS acquisition and a pending USD 650-700 million Protect AI deal. Cisco’s USD 28 billion Splunk purchase merges telemetry, analytics, and orchestration at network scale, redefining competitive baselines.
ServiceNow’s USD 2.85 billion Moveworks acquisition injects conversational AI into the Now Platform, targeting the productivity bottlenecks of SOC analysts. Microsoft, Google, and AWS embed orchestration within native cloud-security suites, leveraging hyperscale telemetry to pre-train detection models. Yet specialist vendors such as Torq and Swimlane differentiate through no-code workflow builders and vertical-specific content packs.
Investment themes pivot toward autonomous SOC tooling, ROI proof points, and secure-by-design AI. Rapid7’s 311% ROI validation serves as a marketing weapon in cost-conscious procurement cycles. White-space opportunities persist in SME packages, operational-technology integrations, and confidential-compute hosting for regulated data. The next competitive frontier likely centers on marketplace ecosystems where third-party developers monetize playbooks, accelerating innovation while locking customers into platform marketplaces.
SOAR Industry Leaders
IBM Corporation
Splunk Inc.
Microsoft Corporation
Palo Alto Networks, Inc.
Cisco Systems, Inc.
- *Disclaimer: Major Players sorted in no particular order

Recent Industry Developments
- June 2025: ServiceNow and NVIDIA unveiled the Apriel Nemotron 15B reasoning model to power real-time security workflow execution.
- May 2025: CISA, with the Australian Cyber Security Centre, released SIEM-SOAR implementation guidance.
- April 2025: Palo Alto Networks agreed to acquire Protect AI for up to USD 700 million, targeting AI security gaps.
- March 2025: ServiceNow closed its USD 2.85 billion Moveworks acquisition to integrate conversational AI into SOC workflows.


Global SOAR Market Report Scope
| Software / Platforms |
| Services |
| Cloud-based |
| On-premise |
| Large Enterprises |
| Small and Mid-size Enterprises (SME) |
| Banking, Financial Services and Insurance (BFSI) |
| Government and Defence |
| Healthcare and Life Sciences |
| IT and Telecom |
| Retail and e-Commerce |
| Energy and Utilities |
| North America | United States |
| Canada | |
| Mexico | |
| Europe | United Kingdom |
| Germany | |
| France | |
| Italy | |
| Rest of Europe | |
| Asia-Pacific | China |
| Japan | |
| India | |
| South Korea | |
| Rest of Asia | |
| Middle East | Israel |
| Saudi Arabia | |
| United Arab Emirates | |
| Turkey | |
| Rest of Middle East | |
| Africa | South Africa |
| Egypt | |
| Rest of Africa | |
| South America | Brazil |
| Argentina | |
| Rest of South America |
| By Component | Software / Platforms | |
| Services | ||
| By Deployment Mode | Cloud-based | |
| On-premise | ||
| By Organisation Size | Large Enterprises | |
| Small and Mid-size Enterprises (SME) | ||
| By Industry Vertical | Banking, Financial Services and Insurance (BFSI) | |
| Government and Defence | ||
| Healthcare and Life Sciences | ||
| IT and Telecom | ||
| Retail and e-Commerce | ||
| Energy and Utilities | ||
| By Geography | North America | United States |
| Canada | ||
| Mexico | ||
| Europe | United Kingdom | |
| Germany | ||
| France | ||
| Italy | ||
| Rest of Europe | ||
| Asia-Pacific | China | |
| Japan | ||
| India | ||
| South Korea | ||
| Rest of Asia | ||
| Middle East | Israel | |
| Saudi Arabia | ||
| United Arab Emirates | ||
| Turkey | ||
| Rest of Middle East | ||
| Africa | South Africa | |
| Egypt | ||
| Rest of Africa | ||
| South America | Brazil | |
| Argentina | ||
| Rest of South America | ||


Key Questions Answered in the Report
How fast is spending on SOAR growing through 2030?
Global revenue is projected to rise from USD 1.87 billion in 2025 to USD 4.42 billion by 2030, an 18.82% CAGR driven by alert overload, AI integration, and compliance mandates.
Which segment is expanding most quickly within the market?
Cloud-based deployments grow at a 21.4% CAGR because API-first designs and Zero Trust frameworks favour SaaS delivery.
Why are healthcare organizations accelerating adoption?
HIPAA obligations, rising ransomware threats, and the explosion of IoMT devices push hospitals toward automated playbooks, producing an 18.9% CAGR for the vertical.
What is the biggest barrier for small and medium businesses?
Up-front implementation and staffing costs remain high, constraining SMB budgets despite SaaS pricing and managed-service options.
How does generative AI change SOAR deployment?
LLMs reduce playbook creation time from months to minutes, allow dynamic remediation steps, and cut mean-time-to-investigate by nearly half in early deployments.
Which region shows the strongest long-term potential?
Asia-Pacific posts the highest 18.7% CAGR through 2030 because regulatory tightening and surging cyber-insurance adoption fuel investment in automation.
Page last updated on:


