Infiniband Market Size and Share
Market Overview
| Study Period | 2020 - 2031 |
|---|---|
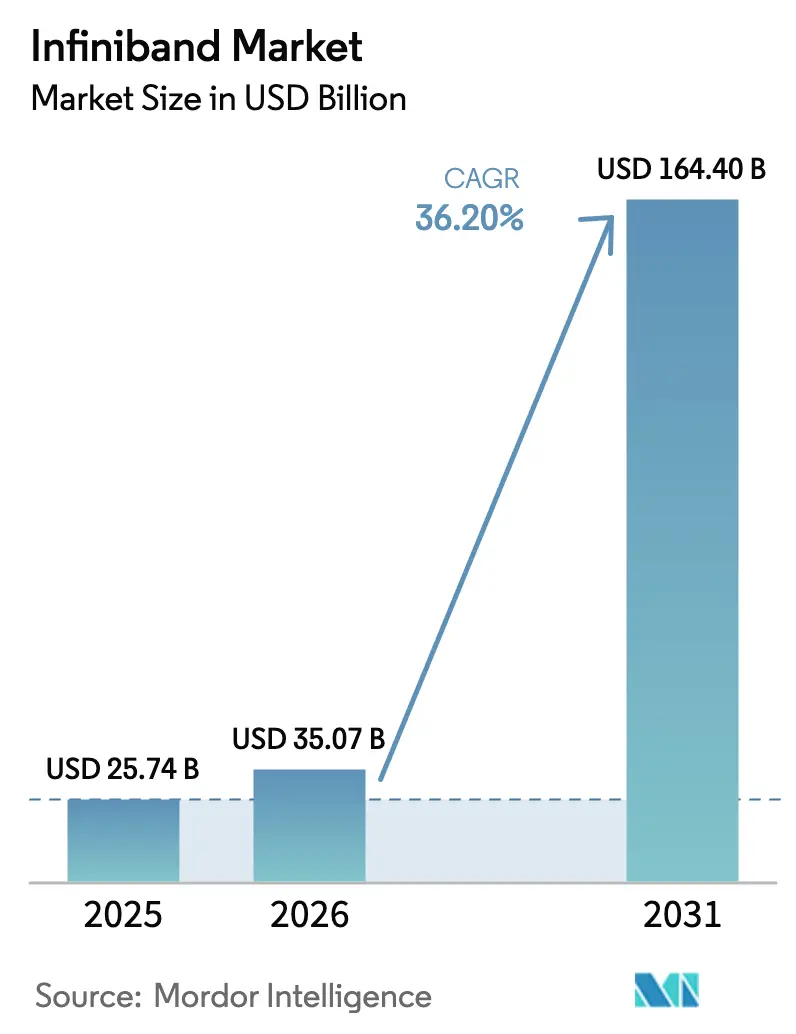
| Market Size (2026) | USD 35.07 Billion |
| Market Size (2031) | USD 164.4 Billion |
| Growth Rate (2026 - 2031) | 36.20% CAGR |
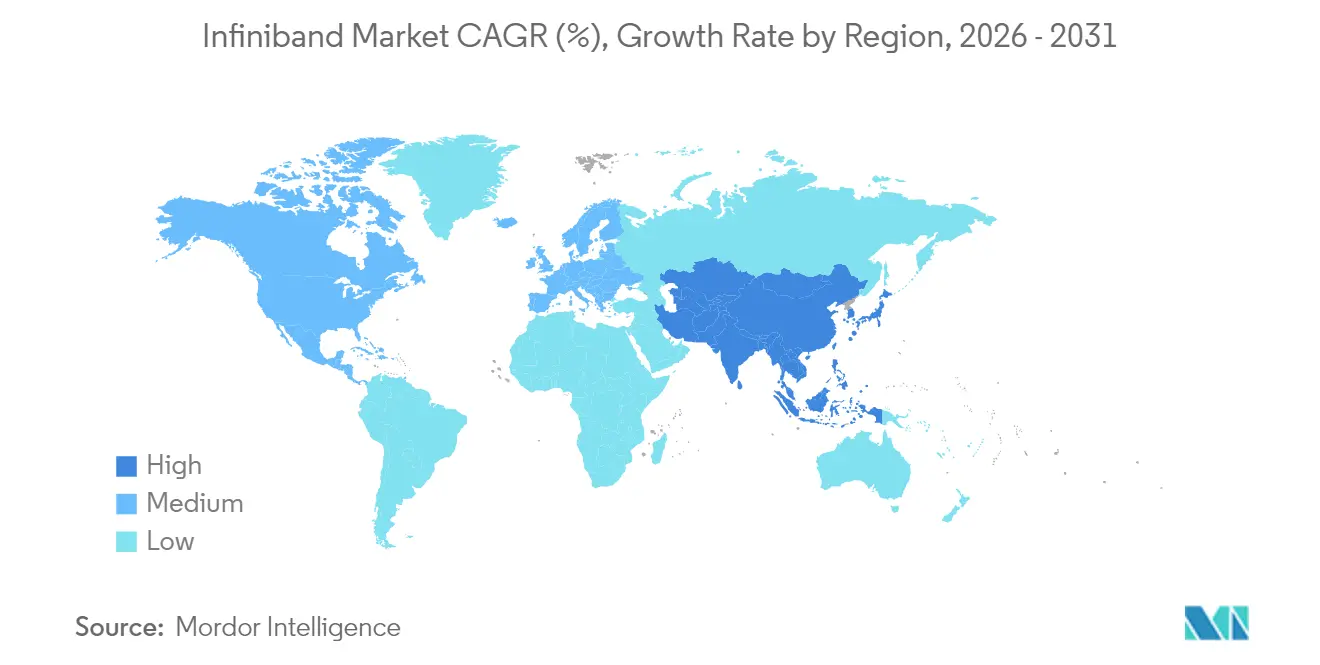
| Fastest Growing Market | Asia Pacific |
| Largest Market | North America |
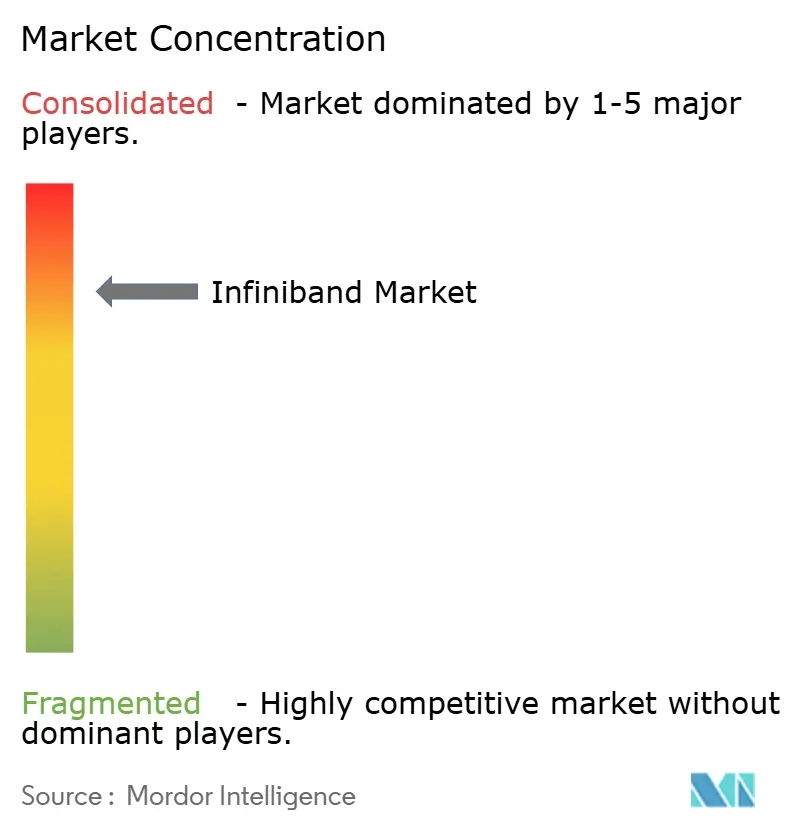
| Market Concentration | High |
Major Players *Disclaimer: Major Players sorted in no particular order Image © Mordor Intelligence. Reuse requires attribution under CC BY 4.0. | |
Infiniband Market Analysis by Mordor Intelligence
The Infiniband Market size is expected to grow from USD 25.74 billion in 2025 to USD 35.07 billion in 2026 and is forecast to reach USD 164.4 billion by 2031 at 36.20% CAGR over 2026-2031.
Demand is accelerating because hyperscale AI training clusters, national exascale programs, and latency-critical financial applications all rely on deterministic, loss-free fabrics that Ethernet struggles to match. Continuous bandwidth leaps from today’s 200 Gb/s HDR links toward 800 Gb/s XDR, and the 1.6 Tb/s NDR 200 roadmap keeps the InfiniBand market firmly aligned with large-language-model complexity, which roughly doubles GPU-to-GPU traffic every 18 months. Cloud platforms are standardizing on Quantum-2 and Quantum-X800 switches as “reference backbones” for GPU super-pods, giving enterprises immediate access to supercomputer-class networking. Supply-chain tightness in optical transceivers and direct-attach copper (DAC) cabling poses near-term cost pressure, but silicon photonics integration is expected to ease those bottlenecks after 2026 as vendors bring co-packaged optics to volume production.
Key Report Takeaways
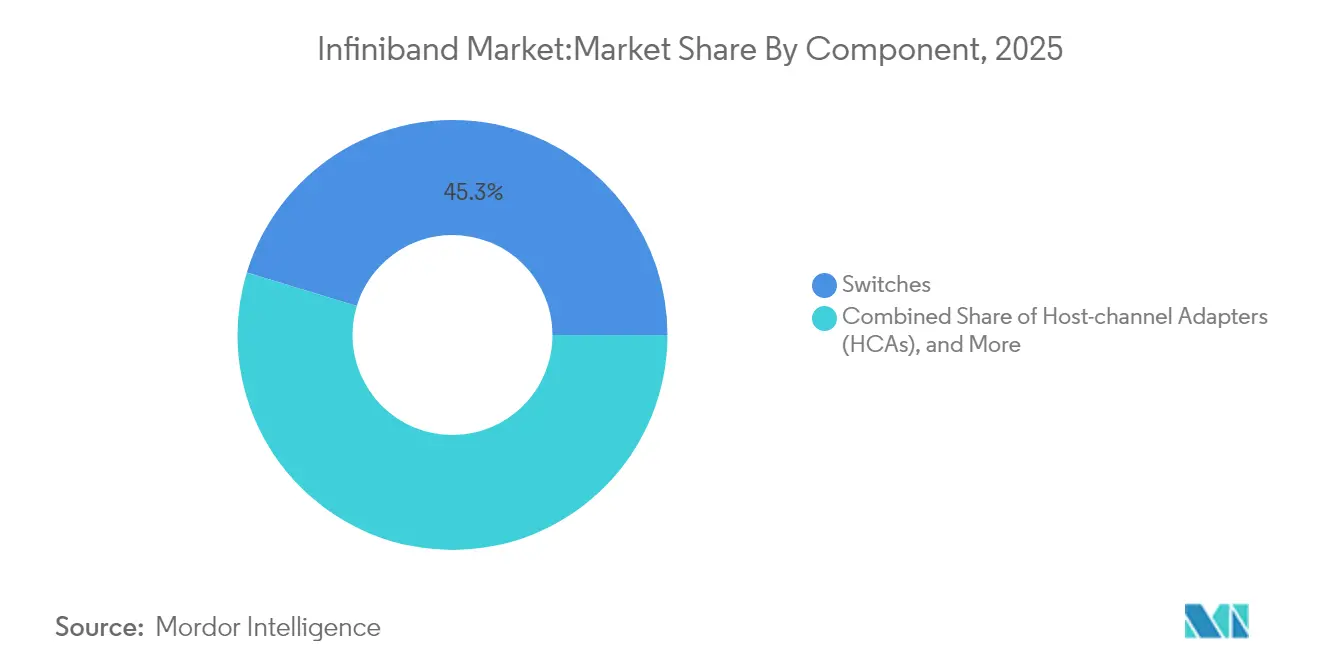
- By component, switches led with 45.30% revenue share in 2025; software and management tools are projected to grow at 37.10% CAGR to 2031.
- By data rate, HDR 200 G commands 37.20% share of the InfiniBand market size in 2025, while XDR 800 G is advancing at 40.70% CAGR through 2031.
- By application, high-performance computing accounted for a 51.40% share of the InfiniBand market size in 2025, and AI/ML training is expanding at a 39.40% CAGR.
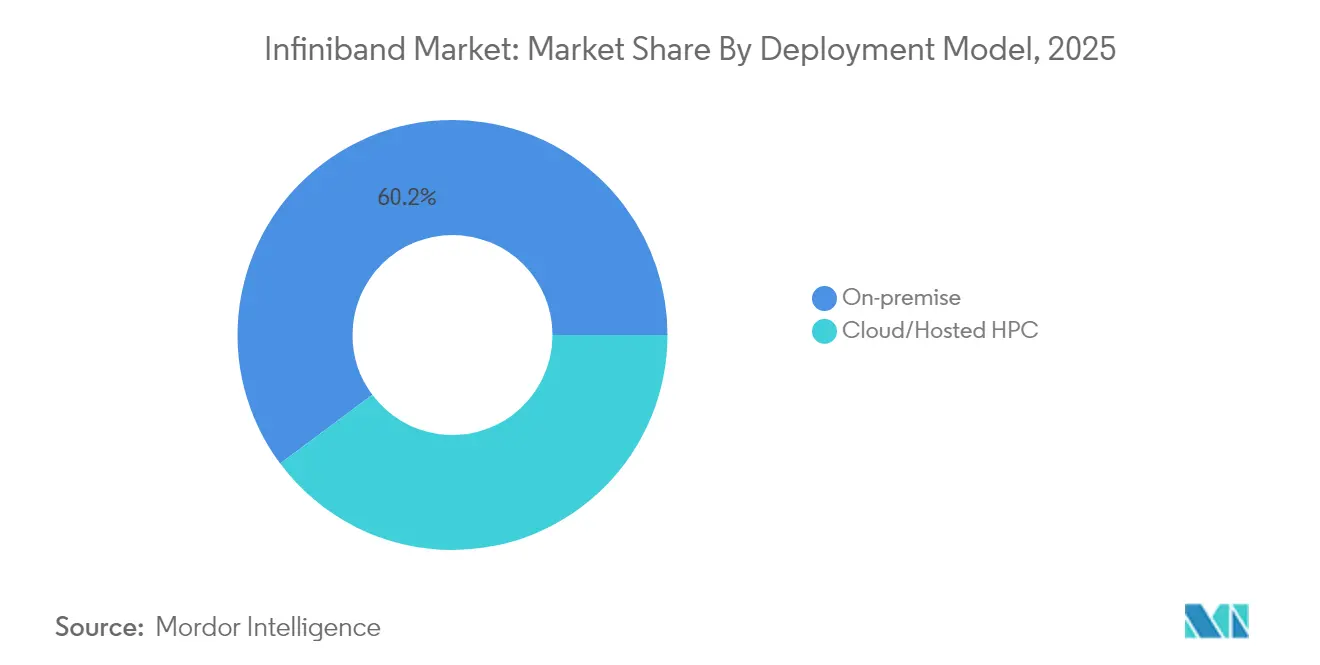
- By deployment model, on-premise clusters held 60.20% of the InfiniBand market share in 2025; cloud/hosted HPC records the highest projected CAGR at 37.60%.
- By end-user industry, government and defense owned 25.40% revenue share in 2025, whereas cloud service providers are forecast to grow at 37.70% CAGR.
- By geography, North America captured 38.40% of the InfiniBand market share in 2025, while Asia Pacific registers the fastest 36.90% CAGR to 2031.
Note: Market size and forecast figures in this report are generated using Mordor Intelligence’s proprietary estimation framework, updated with the latest available data and insights as of 2026.
Global Infiniband Market Trends and Insights
Drivers Impact Analysis*
| Driver | (~) % Impact on CAGR Forecast | Geographic Relevance | Impact Timeline |
|---|---|---|---|
| Exploding AI/LLM cluster deployments | +12.50% | Global (North America, Asia Pacific lead) | Short term (≤ 2 years) |
| National exascale HPC programs | +8.20% | North America, Europe, Asia Pacific | Medium term (2-4 years) |
| Cloud GPU super-pods standardizing on InfiniBand | +7.80% | Global hyperscalers | Short term (≤ 2 years) |
| Low-latency financial analytics demand | +4.10% | Major financial hubs worldwide | Medium term (2-4 years) |
| Source: Mordor Intelligence | |||
Exploding AI/LLM Cluster Deployments
Individual training clusters now interconnect tens of thousands of GPUs, each issuing billions of RDMA messages per second. NVIDIA disclosed that its networking revenue has reached USD 10 billion annually, nearly all of it tied to InfiniBand fabrics that power commercial AI clouds. xAI’s Colossus system with 100,000 H100 GPUs and Oracle’s forthcoming 131,000 GB200 GPU zetta-scale supercluster both rely on Quantum-2 switches to sustain tight 850-ns worst-case latency across three network tiers. Such deployments catalyze follow-on purchases of host channel adapters, transceivers, and cable assemblies, reinforcing a flywheel where hardware upgrades trigger parallel investments in fabric-aware workload schedulers.
Proliferation of National Exascale HPC Programs
The US Department of Energy’s El Capitan will surpass 2 exaflops with 200 Gb/s InfiniBand, safeguarding nuclear stockpile stewardship. Europe’s EUR 250 million JUPITER and Germany’s EUR 250 million Blue Lion systems both selected Quantum-2 fabrics to meet strict energy-efficiency targets[1]European Commission, “JUPITER Exascale System Procurement,” ec.europa.eu. Japan’s Ministry of Economy, Trade and Industry dedicated JPY 72.5 billion (USD 470 million) to five AI supercomputers, each stipulating InfiniBand connectivity to lower per-flop power draw. Government procurement cycles span five to eight years, creating predictable volume for switch makers and shielding the InfiniBand market from short-term enterprise spending swings.
Cloud GPU Super-Pods Standardizing on InfiniBand
Microsoft Azure exposes HBv5, HX-series, and ND-H200-v5 VMs over native 400 Gb/s InfiniBand, letting customers spin up thousands of instances that share the same low-noise fabric as the 14,400-GPU Eagle supercomputer. Oracle, AWS, and Google Cloud have announced similar super-pod templates, codifying InfiniBand as a default rather than a premium offering in GPU clouds. The shift expands the InfiniBand market because every new region build-out replicates the full stack switches, adapters, cables, optics, and software rather than relying on incremental upgrades.
Growing Demand for Low-Latency Financial Analytics
High-frequency-trading venues measure competitive advantage in microseconds. Firms deploying InfiniBand report sub-90 ns port-to-port latencies, enabling trade execution advantages of 5-10 µs over RoCE-based setups. India’s National Stock Exchange routes 19.71 billion transactions per day on deterministic fabrics engineered for five-9s uptime. The predictable behavior of credit-default-swap and fraud-detection inference pipelines further entrenches InfiniBand in banking data centers.
Restraints Impact Analysis*
| Restraint | (~) % Impact on CAGR Forecast | Geographic Relevance | Impact Timeline |
|---|---|---|---|
| High capex and implementation complexity | -5.80% | Global (SMEs most affected) | Short term (≤ 2 years) |
| Rapid gains in 800 G/1.6 T Ultra-Ethernet | -4.20% | Early hyperscale pilots | Medium term (2-4 years) |
| Source: Mordor Intelligence | |||
High Capex and Implementation Complexity
Complete InfiniBand rollouts demand specialized host adapters, purpose-built switches, low-skew twin-ax cables or active optical cables, and fabric management suites that together cost 30-50% more than functionally equivalent Ethernet stacks. Organizations without seasoned HPC engineers face steep learning curves in topology design, adaptive routing, and congestion control tuning. Professional service fees for large deployments often equal 12-15% of hardware outlay in the first year, reducing appeal for mid-tier enterprises whose AI workloads may fluctuate.
Rapid Performance Gains in Ultra-Ethernet
Broadcom’s Tomahawk 6 silicon posts 102.4 Tb/s aggregate bandwidth and can drive more than 100,000 XPUs under the Ultra Ethernet Consortium RDMA profile. Arista’s Etherlink AI line knits these chips into folded-clos networks that approach InfiniBand’s head-of-line blocking resilience while offering familiar Ethernet tooling[2]Arista Networks, “Etherlink AI Platform Datasheet,” arista.com. As carriers and hyperscalers evaluate holistic opex savings from single-stack operations, InfiniBand vendors must accelerate optics roadmaps and pricing discipline to preserve wallet share.
*Our forecasts treat driver/restraint impacts as directional, not additive. The impact forecasts reflect baseline growth, mix effects, and variable interactions.
Segment Analysis
By Component: Switches Anchor, Software Accelerates
Switches generated 45.30% of 2025 revenue, underscoring their role as the architectural keystone of every InfiniBand market deployment. The InfiniBand market size for switching hardware reached USD 11.66 billion with Quantum-2 adoption; it will expand at 33% CAGR as 800 Gb/s XDR and 1.6 Tb/s NDR 200 products ramps. NVIDIA’s Quantum-X800 adds 64×800 Gb/s ports per ASIC, reducing radix counts, cable runs, and power draw per terabit. Parallel gains in silicon photonics promise 2× optics density by 2027, alleviating rack-level thermal ceilings. In contrast, software and fabric-management tools will grow 37.10% annually through 2031 as enterprises automate admission control, quality-of-service tiers, and congestion-aware scheduling across multi-tenant AI fabrics. Integrated telemetry, time-synchronized to sub-100-ns accuracy, is fast becoming a prerequisite for regulatory compliance in financial and government workloads.
The long-tail components host channel adapters, transceivers, and specialized cabling, collectively capturing 31.60% of revenue. Copper price inflation to USD 5.02 per pound in 2024 and projected 75% increases by 2025 have already lifted DAC pricing, nudging customers toward single-mode optical links at rack distances previously served by copper. Vendors that bundle optics, cables, and adapters with switch refresh cycles are well-positioned to monetize full-stack upgrades, limiting gray-market component substitution and reinforcing ecosystem stickiness.


By Data Rate: HDR Today, XDR Tomorrow
HDR 200 G links hold 37.20% revenue share in 2025 as the workhorse speed for production AI and HPC clusters. They strike a pragmatic balance between port cost, cable reach, and line-card power, particularly in tier-two and tier-three switch layers. Yet XDR 800 G lanes are set to out-ship HDR by 2027, growing at 40.70% CAGR as next-generation GPUs and data-processing units saturate existing fabrics. The InfiniBand market size associated with XDR will top USD 40.8 billion by 2031, reflecting the twin imperatives of doubling GPU memory bandwidth and halving all-reduce cycle times.
NDR 400 G technology bridges today’s deployments with tomorrow’s XDR, giving operators an incremental upgrade that reuses existing QSFP112 optics. Research prototypes already demonstrate co-packaged optics driving 1.6 Tb/s per transceiver at less than 7 pJ/bit, paving the way for NDR 200 in late-decade supercomputers. Legacy SDR/DDR and QDR/FDR installations remain active in niche scientific workflows that prioritize code stability and real-time determinism over raw throughput, but their revenue contribution has slipped below 6% and will continue to contract.
By Application: HPC Roots, AI Growth Engine
High-performance computing retained 51.40% revenue in 2025, proof that weather modeling, energy exploration, and computational chemistry still anchor many national compute budgets. The InfiniBand market share figure equated to USD 13.23 billion, with single-rack “turnkey” systems offering petascale performance for mid-sized research labs. AI/ML training will, however, deliver 39.40% CAGR, elevating its share to 48.80% by 2031 as federated learning, multimodal generative AI, and reinforcement learning pipelines proliferate.
Enterprises increasingly run mixed workloads combining CFD, molecular dynamics, and transformer training on unified InfiniBand fabrics managed by container-native schedulers. BMW uses an Omniverse-based “virtual factory” where photorealistic simulations stream between GPU clusters over 200 Gb/s HDR links. Financial institutions extend the model to fraud-scoring inference batches that execute inside the same fabric, proving that deterministic transport benefits diverse algorithmic domains.
By Deployment Model: On-Premises Control versus Cloud Flexibility
On-premises environments captured 60.20% of 2025 revenue because government agencies, defense contractors, and pharmaceutical firms require data sovereignty. Yet the cloud/hosted segment will scale at 37.60% CAGR as hyperscalers amortize billion-dollar GPU orders across a global subscriber base. The InfiniBand market size earmarked for cloud deployments will exceed USD 67 billion by 2031, driven by “AI-as-a-service” offerings where customers rent slices of 4,096-GPU super-pods for 24-hour training sprints.
Hybrid approaches are gaining favor: organizations run sensitive workloads in internal clusters but burst to the cloud when concurrency spikes. Solutions such as Azure Managed Lustre and Oracle RDMA-enabled block storage stitch on-premises and hosted fabrics into unified namespaces, though security architects still grapple with key-management segmentation across tenancy boundaries.
By End-User Industry: Government Leadership, Cloud Hyper-Growth
Government and defense accounted for 25.40% of 2025 revenue, equivalent to USD 6.54 billion, anchored by Navy, Air Force, and nuclear-stewardship procurements. The U.S. Navy’s Nautilus system achieved 8.2 PF/s on 200 Gb/s HDR links under a USD 35 million contract. Cloud service providers, starting from a smaller base, will outpace every other segment at 37.70% CAGR, reaching USD 50.2 billion by 2031. Their scale drives upstream demand for optics, cables, and telemetry ASICs, compressing vendor learning curves and accelerating time-to-volume for new speed grades.
Life-sciences firms employ InfiniBand for de-novo drug discovery, where distributed molecular-dynamics kernels exchange gigabytes per timestep. Automotive OEMs favor deterministic transport for digital-twin crash simulations and battery thermal analysis. Media studios adopt XDR fabrics to power real-time path-tracing renders, shrinking production cycles for blockbuster visual effects.
Geography Analysis
North America retained 38.40% of global revenue in 2025. Massive investments by Microsoft, Meta, and the U.S. Department of Energy seeded multi-petabit networks that anchor both commercial AI clouds and national-security supercomputers. Wall Street trading houses layered low-latency InfiniBand segments onto existing metro-fiber rings to streamline nanosecond-level arbitrage between exchanges. Federal incentives such as CHIPS Act tax credits and loan guarantees support domestic optical interconnect fabs, partially insulating the InfiniBand market from geopolitically sensitive component shortages.
Asia Pacific will post the fastest 36.90% CAGR through 2031. Japan’s METI subsidies, China’s “East-Data-West-Compute” program, and South Korea’s energy-efficient mega-datacenters propel the region’s spending curves. Local OEMs such as NEC and Fujitsu integrate InfiniBand into turnkey AI factories to address language-localization models, autonomous-driving stacks, and semiconductor process R&D. Regional supply-chain resiliency efforts also stimulate domestic assembly of transceivers and active copper cables, tightening ecosystem feedback loops.
Europe shows healthy mid-30% growth fueled by the EuroHPC Joint Undertaking, which committed EUR 400 million to new AI supercomputers through 2027. The continent’s Green Deal imposes stringent power-usage-effectiveness (PUE) mandates, and Quantum-2 switches achieve best-in-class 32 W per 400 Gb/s port, a deciding factor in several national tenders. A secondary wave of spending originates from automotive OEMs in Germany and France, applying InfiniBand fabrics to real-time digital-twin test benches for solid-state battery lines. Emerging regions such as the Middle East and South America see sporadic but strategically significant deployments tied to sovereign-AI initiatives and oil and gas reservoir modeling.

Competitive Landscape
The InfiniBand market is highly concentrated around the NVIDIA platform, whose networking unit (formerly Mellanox) controls an estimated 82% of port shipments. The Quantum-2 and forthcoming Quantum-X800 families integrate adaptive routing, advanced congestion control, and hardware-accelerated collectives, aligning release cadence with each new GPU generation. Tight coupling between CUDA, NCCL, and in-switch SHARP engines allows NVIDIA to deliver end-to-end latencies that competitors struggle to replicate. Simultaneously, the company’s DOCA SDK abstracts RDMA semantics, enabling developers to tap accelerators without low-level verb expertise.
Cornelis Networks challenges this dominance with Omni-Path CN5000, claiming 35% lower switch-to-switch latency than comparable HDR setups. Its roadmap targets 800 Gb/s speed grades by 2026, though ecosystem inertia and limited firmware compatibility temper near-term adoption. Broadcom, Marvell, and Arista lead the parallel Ultra-Ethernet push, lobbying hyperscalers to standardize on Ethernet’s massive volume economics. Their success hinges on demonstrating equal performance in real-world all-reduce, embedding completions, and reinforcement-learning workloads, all of which currently favor InfiniBand’s lossless fabric.
White-space opportunities exist below the hyperscale tier, where enterprises need deterministic networking but lack the headcount to administer subnet managers, partition keys, and adaptive routing policies. Managed-service providers bundle InfiniBand as a turn-key subscription hardware, firmware, monitoring, and 24 × 7 SLAs, creating annuity revenue that partially offsets hardware margin compression. Vendors that deliver cloud-native NOS features, Grafana-ready telemetry, and automated cable-error remediation will capture an outsized share of this emerging mid-market.
Infiniband Industry Leaders
Intel Corporation
Nvidia Corporation
Oracle Corporation
IBM Corporation
Cisco Systems Inc.
- *Disclaimer: Major Players sorted in no particular order

Recent Industry Developments
- June 2025: Cornelis Networks introduced the CN5000 400 Gb/s Omni-Path family, announcing 800 Gb/s samples for 2026 and positioning for 1.6 Tb/s by 2027.
- May 2025: NVIDIA unveiled NVLink Fusion with ecosystem partners MediaTek, Marvell, and Alchip, delivering 1.8 TB/s per GPU and deeper integration between third-party CPUs and NVIDIA GPUs .
- May 2025: Oracle committed USD 40 billion to NVIDIA GB200 superchips for OpenAI infrastructure, cementing Quantum-2 InfiniBand as its default AI fabric.
- March 2025: Stargate AI Data Center began installing 64,000 GB200 systems interconnected by 800 Gb/s InfiniBand for multi-exaflop AI services.


Research Methodology Framework and Report Scope
Market Definitions and Key Coverage
Our study, according to Mordor Intelligence, sizes the global InfiniBand market as all revenue earned from host-channel adapters, purpose-built switches, certified copper or optical cables, and management software that form a standards-based, low-latency fabric inside high-performance computing and AI data-center clusters.
We purposely exclude passive fiber blanks, Ethernet silicon, and legacy SDR gear retired from service.
Segmentation Overview
- By Component
- Host-channel Adapters (HCAs)
- Switches
- Cables and Transceivers
- Software and Management Tools
- By Data Rate
- SDR/DDR
- QDR/FDR
- EDR
- HDR (200 G)
- NDR (400 G)
- XDR (800 G) and Beyond
- By Application
- High-Performance Computing
- AI/ML Training and Inference
- Enterprise Storage and Databases
- Financial Services and HFT
- Cloud Service Provider Infrastructure
- By Deployment Model
- On-premise Clusters
- Cloud/Hosted HPC
- By End-user Industry
- Government and Defense
- Academia and Research Labs
- BFSI
- Manufacturing and Engineering
- Life Sciences
- Media and Entertainment
- By Geography
- North America
- United States
- Canada
- Mexico
- South America
- Brazil
- Argentina
- Rest of South America
- Europe
- Germany
- United Kingdom
- France
- Italy
- Spain
- Rest of Europe
- Asia-Pacific
- China
- India
- Japan
- South Korea
- Rest of Asia-Pacific
- Middle East and Africa
- Middle East
- Saudi Arabia
- United Arab Emirates
- Turkey
- Rest of Middle East
- Africa
- South Africa
- Nigeria
- Rest of Africa
- Middle East
- North America
Detailed Research Methodology and Data Validation
Primary Research
For primary research, we interviewed HPC cluster architects across North America, European exascale program managers, and Asian hyperscaler network engineers. These discussions helped us verify NDR-800 adoption timelines, real-world port densities, and price erosion assumptions before final triangulation.
Desk Research
We relied on tier-1, non-paywalled sources such as the Top500 supercomputer list, US Department of Energy procurement releases, EuroHPC budget papers, OpenFabrics Alliance specifications, and Volza customs records to anchor base volumes and typical selling prices.
In addition, our analysts tapped D&B Hoovers for company financials, Questel patent analytics for roadmap signals, and SEC 10-Ks, along with reputable press coverage, to cross-check vendor shipment claims. The sources named illustrate scope; many others supported data collection and validation.
Market-Sizing & Forecasting
In our model, a top-down rebuild begins with global HPC and AI server spending, which is then split by InfiniBand penetration rates, average port counts per node, cluster refresh cycles, and regional capex patterns. Bottom-up spot checks, sampled switch port shipments, channel checks on HCA volumes, and ASP × volume roll-ups fine-tune totals.
Key variables include GPU server shipments, exascale program budgets, port-speed migration curves, and datacenter power-cost trends. A multivariate regression projects values through 2030, while any shipment gaps are bridged with price-list triangulations and regional import data.
Data Validation & Update Cycle
Before sign-off, our team screens outputs against Top500 port counts and IDC server trackers, investigates outliers, and completes a two-level peer review. Models refresh each year, with interim updates triggered by material events, ensuring clients receive the latest view.
Why Mordor's Infiniband Baseline Commands Reliability
Published estimates often diverge because firms pick different scopes, currency years, and port-to-system mappings, yet we apply verified cluster counts, audited port densities, and an annual refresh cadence that guard against both understatement and headline-driven overstatement.
Key gap drivers include some publishers folding passive cables into value, others applying a uniform 40% growth rate to every port speed, or valuing 2023 revenue in future-year dollars without price-decay adjustments.
Benchmark comparison
| Market Size | Anonymized source | Primary gap driver |
|---|---|---|
| USD 25.74 B (2025) | Mordor Intelligence | N/A |
| USD 18.28 B (2024) | Global Consultancy A | Cables excluded; blanket CAGR applied |
| USD 3.10 B (2024) | Industry Journal B | Counts only stand-alone switches; omits cloud bundles |
Taken together, the comparison shows that Mordor's balanced mix of shipment math, price-trend modeling, and timely updates delivers a dependable baseline traceable to transparent variables and repeatable steps.


Key Questions Answered in the Report
What is the current size of the InfiniBand market?
The InfiniBand market generates USD 35.07 billion in 2026 revenue and is on track to reach USD 164.4 billion by 2031 with a 36.20% CAGR.
Which region leads the InfiniBand market today?
North America holds 38.40% of 2025 revenue, driven by hyperscale cloud spending and government exascale programs.
How fast are XDR 800 Gb/s InfiniBand links expected to grow?
XDR 800 Gb/s revenues are projected to expand at 40.70% CAGR, making them the fastest-growing data-rate segment.
Why do AI training clusters prefer InfiniBand over Ethernet?
InfiniBand guarantees lossless, sub-microsecond latency and in-switch collective acceleration, both critical for large-scale gradient synchronization in transformer models.
Is Ethernet becoming a viable alternative to InfiniBand?
Ultra-Ethernet initiatives led by Broadcom and Arista are narrowing the latency gap, but most hyperscalers still standardize InfiniBand for training workloads above 4,000 GPUs.
What factor most restrains wider InfiniBand adoption?
High capital expenditure and the need for specialized deployment expertise add 30-50% cost compared with Ethernet, deterring many small and mid-sized enterprises.
Page last updated on:


