GRNA Market Size and Share
Market Overview
| Study Period | 2019 - 2030 |
|---|---|
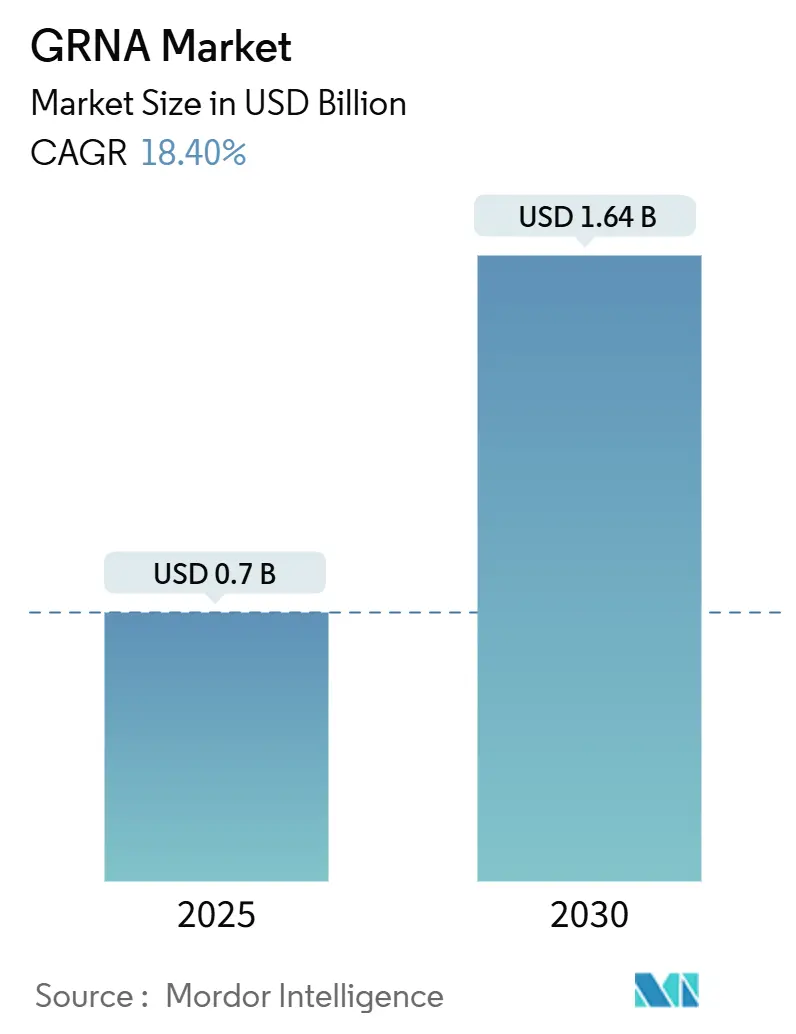
| Market Size (2025) | USD 0.7 Billion |
| Market Size (2030) | USD 1.64 Billion |
| Growth Rate (2025 - 2030) | 18.40% CAGR |
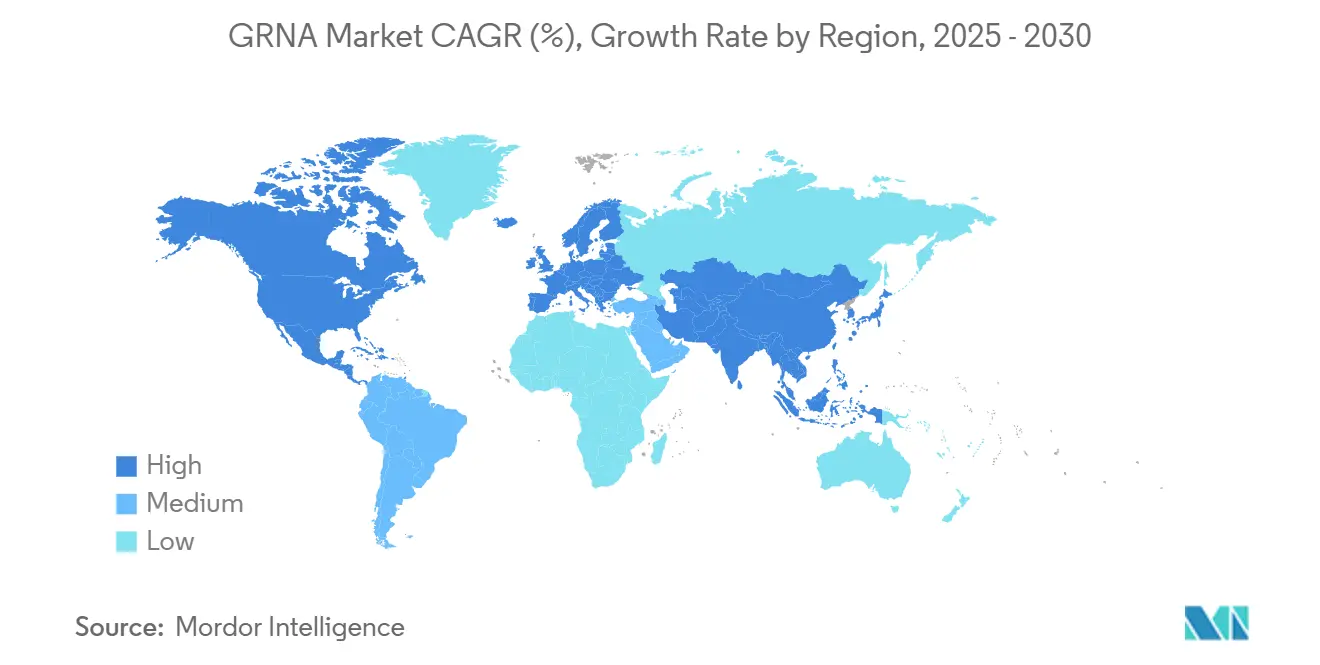
| Fastest Growing Market | Asia Pacific |
| Largest Market | North America |
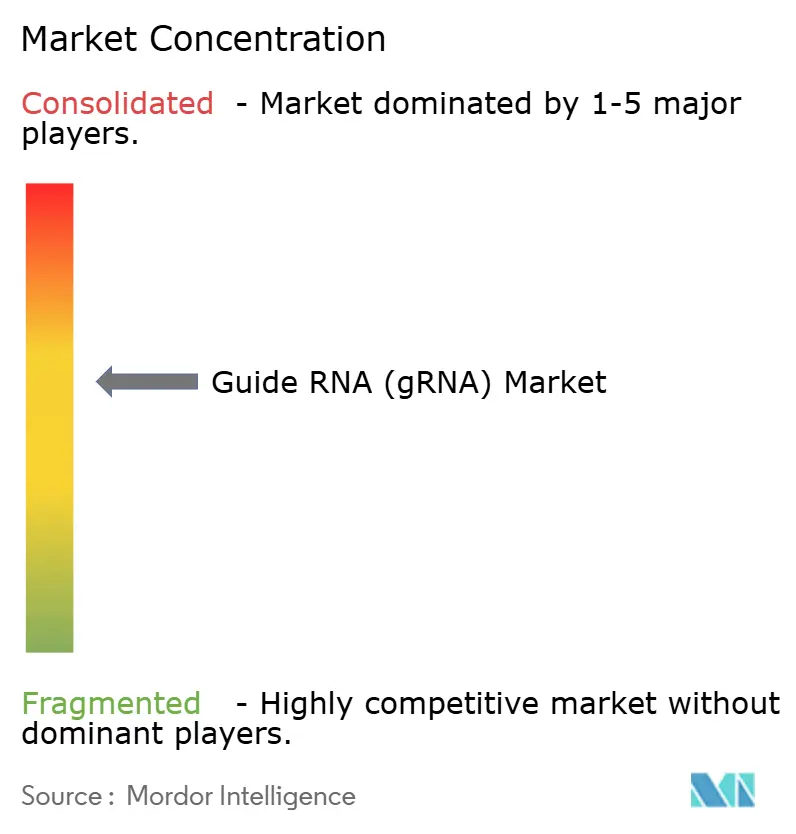
| Market Concentration | Medium |
Major Players *Disclaimer: Major Players sorted in no particular order Image © Mordor Intelligence. Reuse requires attribution under CC BY 4.0. | |
GRNA Market Analysis by Mordor Intelligence
The gRNA market size touched USD 0.70 billion in 2025 and is projected to reach USD 1.64 billion by 2030, implying an 18.4% CAGR that keeps the segment ahead of most other genome-engineering inputs in absolute growth and velocity. The transition from bench reagent to clinical-grade component accelerated after the FDA approved Casgevy, the first CRISPR therapy, in December 2023, validating guide RNA’s therapeutic value and spurring follow-on regulatory designations that foster fresh procurement cycles within the gRNA market. Synthetic design algorithms powered by machine learning, falling custom-synthesis costs, and template-independent enzymatic chemistry are reinforcing scale economies that widen the customer base across discovery, diagnostics, and manufacturing. At the same time, patent litigation, raw-material supply constraints, and the capital intensity of GMP production inject operational complexity that shapes risk assessments for investors assigning capital to the gRNA market. North America’s head start in regulatory acceptance keeps it at the forefront, yet rapid liberalization in Asia Pacific is rebalancing the global gRNA market as Chinese, Japanese, and Indian programs expand pilot manufacturing runs and clinical filings.
Key Report Takeaways
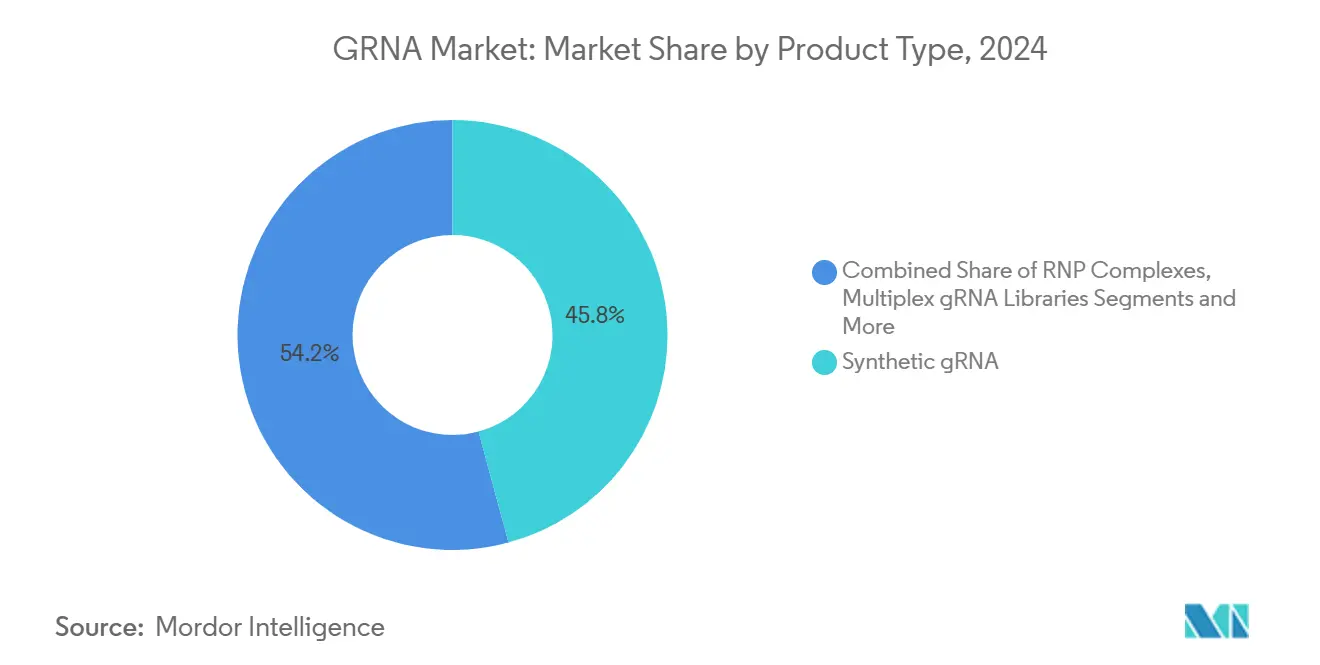
- By product type, synthetic guides held 45.8% of the gRNA market share in 2024, while multiplex gRNA libraries are projected to advance at a 17.7% CAGR through 2030.
- By application, genome editing accounted for 52.8% of the gRNA market size in 2024 and cell and gene therapy is expected to post a 27.4% CAGR to 2030.
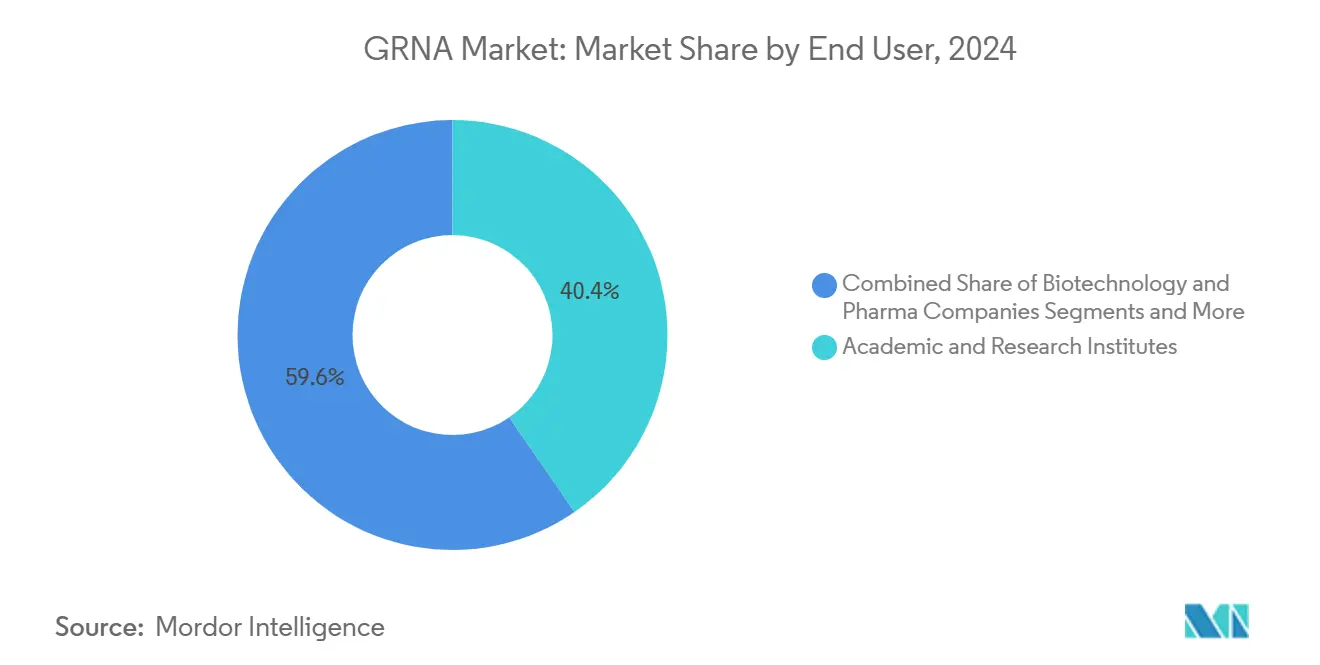
- By end user, academic and research institutes commanded 40.4% of the gRNA market share in 2024; biopharma companies are positioned to grow at a 19.0% CAGR through 2030.
- By geography, North America captured 48.5% revenue share of the gRNA market in 2024, whereas Asia Pacific is forecast to register an 18.6% CAGR during 2025-2030.
Global GRNA Market Trends and Insights
Drivers Impact Analysis*
| Driver | (~) % Impact on CAGR Forecast | Geographic Relevance | Impact Timeline |
|---|---|---|---|
| Surge In CRISPR-Based Therapeutics Pipeline | +4.20% | Global, with North America & EU leading | Medium term (2-4 years) |
| Falling Costs & Turnaround Time For Custom gRNA Synthesis | +3.80% | Global, with manufacturing hubs in US, Europe, Asia | Short term (≤ 2 years) |
| Expanding Funding For Genome-Engineering Research | +3.10% | North America & EU core, spill-over to APAC | Medium term (2-4 years) |
| Growing Use of Agricultural Biotechnology | +2.90% | Global, with early gains in US, Brazil, Argentina | Long term (≥ 4 years) |
| AI-Driven gRNA Design Platforms Enhance On-Target Efficiency | +2.70% | Global, concentrated in tech-advanced regions | Short term (≤ 2 years) |
| Chemically-Modified gRNAs Enable In-Vivo Delivery Beyond Liver | +1.80% | Global, with clinical focus in North America & EU | Long term (≥ 4 years) |
| Source: Mordor Intelligence | |||
Surge in CRISPR-Based Therapeutics Pipeline
More than 85 active CRISPR trials now span oncology, rare blood disorders, and metabolic diseases, each pulling high-purity materials from the gRNA market.[1]Tao Ruiyu et al., “Enhancing CAR-T Cell Therapy with CRISPR,” frontiersin.orgThe FDA’s umbrella guidance for gene-editing products streamlines pre-IND review, encouraging biopharma groups like Vertex and Regeneron to lock in multi-year master supply agreements for GMP-grade guides. Early evidence of complete responses in solid-tumor settings underscores the scale of clinical ambitions that will demand larger production lots from the gRNA market. Pipeline breadth also extends into prime-editing and base-editing approaches that rely on longer RNA constructs, raising per-dose consumption levels. The therapeutic cascade, therefore, keeps the gRNA market on a rising demand trajectory across forecast years.
Falling Costs and Turnaround Time for Custom gRNA Synthesis
Template-independent enzymatic chemistry now doubles achievable oligo lengths while removing hazardous solvents, compressing delivery windows from weeks to mere days. Synthego’s 18,000 ft² GMP facility, commissioned in April 2025, illustrates the automation wave sweeping the gRNA market, even though subsequent restructuring highlights the capital burden of staying compliant. 3TC scaffold tweaks increase transcript stability, letting therapeutic developers cut dose levels without sacrificing efficacy, which stimulates follow-on orders for optimized sequences.[2]Y.C.J. Chey et al., “Optimal SpCas9- and SaCas9-Mediated Gene Editing by Enhancing gRNA Transcript Levels through Scaffold Poly-T Tract Reduction,” BMC Genomics, biomedcentral.com These advances extend purchasing power beyond top-tier pharma to mid-sized biotech ventures, enlarging the total addressable gRNA market.
Expanding Funding for Genome-Engineering Research
Public-private consortia such as Danaher and the Innovative Genomics Institute’s Beacon program anchor long-term grants that translate bench findings into pipeline assets, ensuring steady laboratory pull on the gRNA market. Even as venture capital dipped in 2024, NIH and EU funds filled budget gaps, maintaining momentum in exploratory screens that rely on high-diversity libraries. China’s renewed ethics framework post-“CRISPR babies” scandal unlocked provincial budgets for agricultural and medical editing projects, amplifying Asia Pacific’s share of the gRNA market. Across all regions, clarified guidance minimizes administrative drag, accelerating grant disbursement schedules and sustaining reagent throughput.
Growing Use of Agricultural Biotechnology
Revised USDA SECURE rules shift regulatory focus to product traits, enabling gene-edited crops to bypass GMO-style labeling hurdles and broadening demand for plant-specific reagents within the gRNA market. Commercial introductions—flavor-enhanced tomatoes, biofortified corn, and disease-resistant mustard greens—demonstrate consumer tolerance, which motivates seed producers to commission kilogram-scale guide pools. India, Nigeria, and Brazil now recognize similar science-based criteria, geographically diversifying the gRNA market for agritech applications. More than 1,000 CRISPR agriculture patents have been filed, consolidating intellectual property defensibility and encouraging premium pricing for proprietary plant-editing guides.
Restraints Impact Analysis*
| Restraint | (~) % Impact on CAGR Forecast | Geographic Relevance | Impact Timeline |
|---|---|---|---|
| Off-Target Effects & Safety Concerns | -2.80% | Global, with heightened scrutiny in EU & Japan | Short term (≤ 2 years) |
| Complex Intellectual-Property Landscape | -2.10% | Global, with litigation concentrated in US & EU | Medium term (2-4 years) |
| Supply-Chain Vulnerability For Synthetic RNA Feedstocks | -1.60% | Global, with manufacturing concentration risks | Short term (≤ 2 years) |
| Regulatory Uncertainty For CRISPR-Edited Crop Release | -1.30% | EU core, with spillover effects globally | Long term (≥ 4 years) |
| Source: Mordor Intelligence | |||
Off-Target Effects and Safety Concerns
Extended RNA scaffolds and high-fidelity Cas variants reduce unintended edits, yet regulators now require multi-platform detection assays, adding cost and time burdens for entrants into the gRNA market. AI-driven tools like DeepCRISPR refine sequence design but still need clinical validation across diverse genomic contexts, prolonging lock-in periods for material specifications.[3]Ruiyu Tao et al., “Revolutionizing Cancer Treatment: Enhancing CAR-T Cell Therapy with CRISPR/Cas9 Gene Editing Technology,” Frontiers in Immunology, frontiersin.orgThe EMA and FDA both expect orthogonal off-target evaluations, which stretch pre-clinical timelines and force redundancy in guide redesign cycles. These additional steps slow first-mover advantage, temporarily dampening growth in the gRNA market.
Complex Intellectual-Property Landscape
Federal remand of the University of California v. Broad Institute dispute reopens foundational claims, driving up legal fees and royalties tied to key sequence motifs used across the gRNA market. Overlapping patents exceed 11,000 worldwide, complicating freedom-to-operate analyses for newcomers. Licensing models that open after exclusivity periods, while progressive, still require dual rights in many jurisdictions, raising barriers. Nobel laureates’ decision to cancel certain European patents introduces additional uncertainty that can stall regional commercialization schedules. The legal maze, therefore, exerts a measurable drag on the gRNA market CAGR.
*Our forecasts treat driver/restraint impacts as directional, not additive. The impact forecasts reflect baseline growth, mix effects, and variable interactions.
Segment Analysis
By Product Type: Synthetic Guides Extend Their Leadership Amid Quality Demands
Synthetic formats represented 45.8% of the gRNA market in 2024 because cGMP alignment, batch consistency, and tight length tolerances match regulatory expectations. Multiplex libraries log the fastest 17.7% CAGR, mirroring pharmaceutical demand for pooled knockout screens that uncover druggable pathways. RNP complexes offering Cas-RNA pre-assembly win favor in ex vivo cell therapy workflows, where brief cellular exposure mitigates genotoxicity. IVT guides remain popular for low-budget research, yet a lot of heterogeneity and residual template contaminants limit penetration into regulated trials. Enzymatic synthesis eliminates phosphoramidite waste streams, positioning itself as a greener challenger that could pull future orders from high-volume buyers in the gRNA market.
Second-generation chemical tweaks extend in vivo half-life, freeing systemic doses from hepatic confines and broadening therapeutic use cases, which enlarges the gRNA market size tied to non-liver disorders. Plasmid-encoded constructs serve niche cell-line creation but rarely scale into commercial volumes. The collapse of pure-play supplier Synthego and the acquisition of its assets by EditCo Bio illustrate consolidation forces that are likely to alter vendor rosters in the gRNA market.


By Application: Genome Editing Retains Primacy While Cell Therapy Accelerates
Genome editing preserved 52.8% share of the gRNA market size in 2024 on the strength of standardized lab protocols, abundant design software, and entrenched academic curricula. Cell and gene therapy lines, however, register a 27.4% CAGR, fueled by FDA projections of 10-20 approvals annually through mid-decade. Each autologous product consumes milligram-range, clinical-grade guides, inflating revenue contribution per patient.
Diagnostic assays using Cas13a tap collateral cleavage for amplification-free detection of viruses, creating a healthcare sub-segment that depends on room-temperature-stable guide formulations. Agricultural biotechnology, supported by trait-focused regulations, fosters long-run demand for kilogram-scale guide pools. Functional genomics screens, backed by next-generation sequencing, sustain high-library turnover in pharmaceutical discovery units. AI platforms that iteratively refine guide efficiency feed a data flywheel that cements vendor loyalty within the gRNA market.
By End User: Academic Centers Anchor Volume While Biopharma Drives Margin
Academic institutions held 40.4% of the gRNA market share in 2024, reflecting grant-driven purchasing cycles and shared-resource core facilities. Biopharma entities, though smaller in transaction count, post the strongest 19.0% CAGR owing to high-margin purchases of GMP-validated guides for clinical trials. CROs bridge discovery and development by offering design-to-dose packages, attracting venture-backed start-ups that lack internal expertise. Hospital laboratories begin adopting CRISPR diagnostics, seeding future offtake. Agro-industrial firms place bulk orders for seed-line editing, trimming per-unit cost yet boosting overall gRNA market volume.
Geography Analysis
North America captured 48.5% of the gRNA market in 2024, underpinned by FDA validation, federal grants, and dense biotech clusters in Boston and the Bay Area. More than 200 U.S. companies operate in gene editing, creating a robust domestic customer list for guide suppliers. Canada’s regulatory clarity in agriculture adds incremental volumes for crop-focused guides.
Asia Pacific posts the fastest 18.6% CAGR as Chinese, Japanese, and Indian regulators adopt science-based frameworks that distinguish gene editing from transgenesis. Provincial Chinese grants fund new CRISPR industrial parks, while Japan’s IP High Court ruling in July 2025 influences local licensing behavior. India aligns biosafety assessments with U.S. precedents, smoothing import lines and encouraging multinational setups.
Europe remains a sizable but slower-growing node within the gRNA market. The European Patent Office’s March 2024 reinstatement of Broad claims clarified freedom-to-operate, nudging some hesitant programs forward. The European Parliament’s pro-NGT stance signals a lighter approach for plant approvals, though member-state specifics still impose administrative lag. Switzerland and the United Kingdom leverage independent regimes to expedite clinical-grade manufacturing, offering alternative gateways into the European gRNA market.

Competitive Landscape
The gRNA market is moderately fragmented, with the top five providers estimated to control about 40% of the global supply. Large conglomerates such as Danaher and Thermo Fisher leverage integrated portfolios to bundle design software, reagents, and analytics, putting price pressure on mid-tier firms. Synthego’s Chapter 11 filing in May 2025 underscores the capital intensity of stand-alone RNA facilities and signals a wave of consolidation as deep-pocketed strategics acquire distressed assets.
Strategic collaborations shape differentiation: Regeneron and Mammoth co-develop ultracompact nuclease systems tied to exclusive guide supply arrangements that cement recurring order books. Intellia and ReCode pair editing chemistry with delivery vectors, embedding guide sequences into asset-specific contracts. Patent complexity favors incumbents with broad IP portfolios; Vertex’s USD 50 million license with Editas exemplifies pre-emptive freedom-to-operate spending. Agricultural suppliers, less encumbered by clinical GMP constraints, compete on cost leadership and region-specific germplasm expertise, maintaining a diverse vendor list in the lower-margin segment of the gRNA market.
Compliance expectations now include alignment with new FDA draft guidance on cybersecurity for sequence databases, forcing suppliers to harden IT stacks. Firms integrating AI-driven design portals see higher customer retention because performance data loops back into improved offerings, a differentiator that creates stickiness in the gRNA market. Regional manufacturers in Latin America and Africa retain localized crop portfolios, balancing the global tide toward consolidation.
GRNA Industry Leaders
Thermo Fisher Scientific
Danaher Corp.
Merck KGaA
Synthego Corporation
Agilent Technologies
- *Disclaimer: Major Players sorted in no particular order

Recent Industry Developments
- July 2025: BioSpring shared its plans to build one of the world’s largest RNA-manufacturing complexes. This facility will produce pharmaceutical-grade guide RNAs and other therapeutic oligonucleotides.
- April 2025: AIRNA raised USD 155 million in a Series B funding round. This investment will help advance its lead RNA therapeutic (ATTD) through mid-stage trials and expand its pipeline of guide-RNA-enabled therapies.
- February 2025: Agilent Technologies announced a USD 725 million investment to expand its U.S. and European facilities for therapeutic-grade nucleic acids. The company specifically identified CRISPR guide RNAs as a priority output.


Global GRNA Market Report Scope
| Synthetic gRNA |
| In-vitro Transcribed (IVT) gRNA |
| Plasmid-Encoded gRNA Constructs |
| RNP Complexes (gRNA + Cas) |
| Multiplex gRNA Libraries |
| Genome Editing |
| Functional Genomics Screens |
| Diagnostics |
| Cell & Gene Therapy |
| Agricultural Biotechnology |
| Academic & Research Institutes |
| Biotechnology & Pharmaceutical Companies |
| Contract Research Organizations (CROs) |
| Hospitals & Diagnostic Laboratories |
| Agro-industrial Firms |
| North America | United States |
| Canada | |
| Mexico | |
| Europe | Germany |
| United Kingdom | |
| France | |
| Italy | |
| Spain | |
| Rest of Europe | |
| Asia Pacific | China |
| Japan | |
| India | |
| South Korea | |
| Australia | |
| Rest of Asia Pacific | |
| Middle East & Africa | GCC |
| South Africa | |
| Rest of Middle East & Africa | |
| South America | Brazil |
| Argentina | |
| Rest of South America |
| By Product Type | Synthetic gRNA | |
| In-vitro Transcribed (IVT) gRNA | ||
| Plasmid-Encoded gRNA Constructs | ||
| RNP Complexes (gRNA + Cas) | ||
| Multiplex gRNA Libraries | ||
| By Application | Genome Editing | |
| Functional Genomics Screens | ||
| Diagnostics | ||
| Cell & Gene Therapy | ||
| Agricultural Biotechnology | ||
| By End User | Academic & Research Institutes | |
| Biotechnology & Pharmaceutical Companies | ||
| Contract Research Organizations (CROs) | ||
| Hospitals & Diagnostic Laboratories | ||
| Agro-industrial Firms | ||
| By Geography | North America | United States |
| Canada | ||
| Mexico | ||
| Europe | Germany | |
| United Kingdom | ||
| France | ||
| Italy | ||
| Spain | ||
| Rest of Europe | ||
| Asia Pacific | China | |
| Japan | ||
| India | ||
| South Korea | ||
| Australia | ||
| Rest of Asia Pacific | ||
| Middle East & Africa | GCC | |
| South Africa | ||
| Rest of Middle East & Africa | ||
| South America | Brazil | |
| Argentina | ||
| Rest of South America | ||


Key Questions Answered in the Report
How quickly is the gRNA market expanding?
Revenue is rising at an 18.4% CAGR from 2025 to 2030, reaching USD 1.64 billion.
Which product type leads today's gRNA market?
Synthetic guides hold 45.8% share because their batch consistency aligns with GMP requirements.
Why are multiplex gRNA libraries in high demand?
Pharmaceutical discovery teams use them for pooled gene-function screens, driving a 17.7% CAGR.
What is the fastest-growing region?
Asia Pacific is set to grow at 18.6% CAGR as China, Japan, and India liberalize gene-editing rules.
How do patent disputes influence gRNA pricing?
Ongoing UC-Broad litigation lifts licensing costs, trimming overall CAGR potential by 2.1%.
Page last updated on:


