Aftercoolers Market Size and Share
Market Overview
| Study Period | 2020 - 2031 |
|---|---|
| Market Size (2026) | USD 1.86 Billion |
| Market Size (2031) | USD 3.22 Billion |
| Growth Rate (2026 - 2031) | 11.60% CAGR |
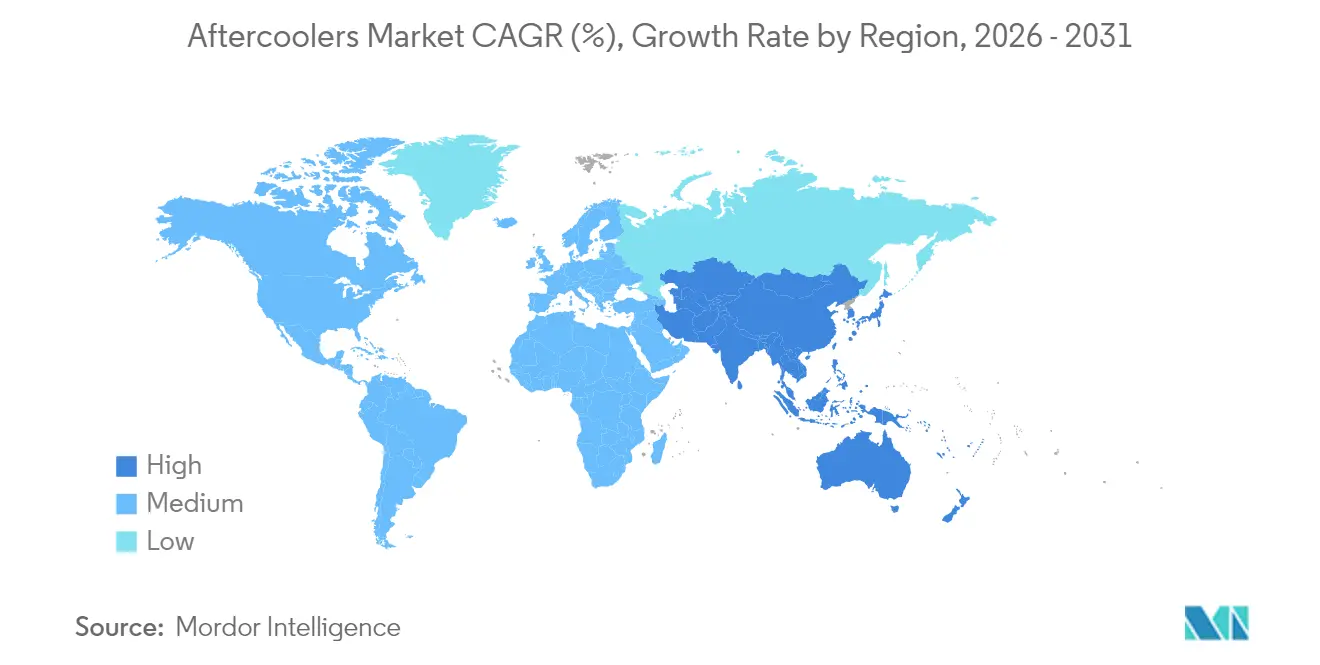
| Fastest Growing Market | Asia Pacific |
| Largest Market | Asia Pacific |
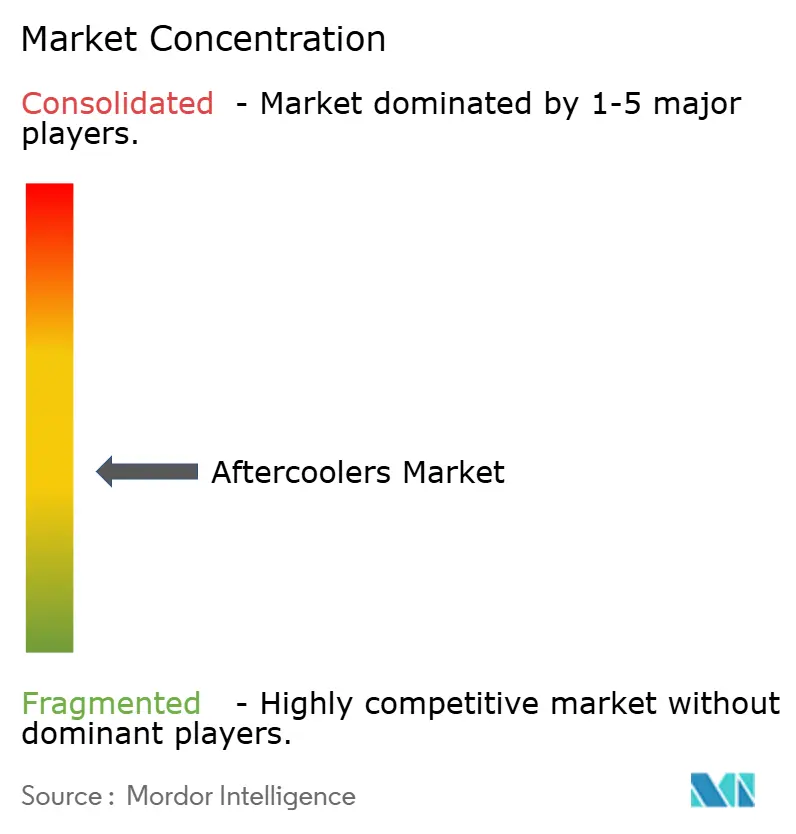
| Market Concentration | Medium |
Major Players *Disclaimer: Major Players sorted in no particular order Image © Mordor Intelligence. Reuse requires attribution under CC BY 4.0. | |
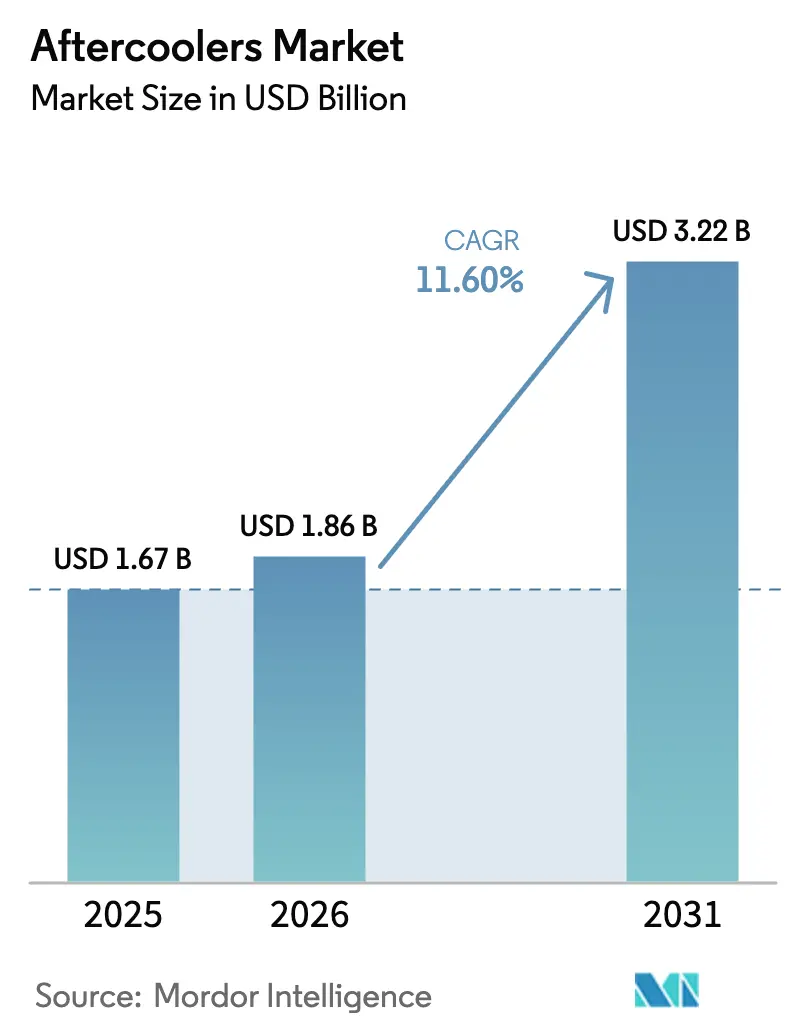
Aftercoolers Market Analysis by Mordor Intelligence
Aftercoolers market size in 2026 is estimated at USD 1.86 billion, growing from 2025 value of USD 1.67 billion with 2031 projections showing USD 3.22 billion, growing at 11.60% CAGR over 2026-2031. The rapid adoption of automated production lines, energy-efficiency regulations, and stricter air-quality mandates is accelerating the installation of compressed-air systems in manufacturing, food processing, and the pharmaceutical industry, thereby increasing demand for high-performance aftercoolers. Competitive intensity remains moderate, as global incumbents leverage materials science, digital monitoring, and service packages to differentiate themselves against low-priced imports. Meanwhile, small and medium-sized enterprises face capital hurdles when evaluating advanced water-cooled systems.
Key Report Takeaways
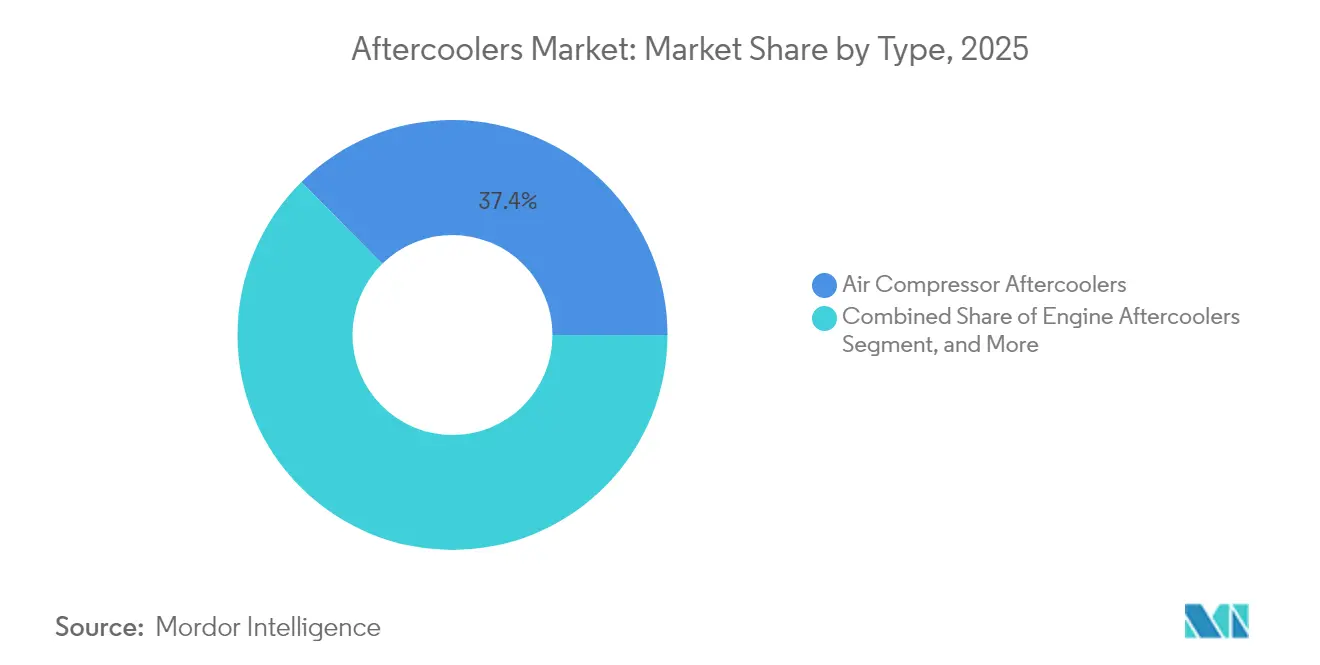
- By type, air compressors aftercoolers held 37.40% of the aftercoolers market size in 2025, while hydraulic oil models are projected to advance at a 13.85% CAGR through 2031.
- By cooling method, air-cooled units led with a 61.10% aftercooler market share in 2025; water-cooled alternatives registered the fastest trajectory at a 13.05% CAGR to 2031.
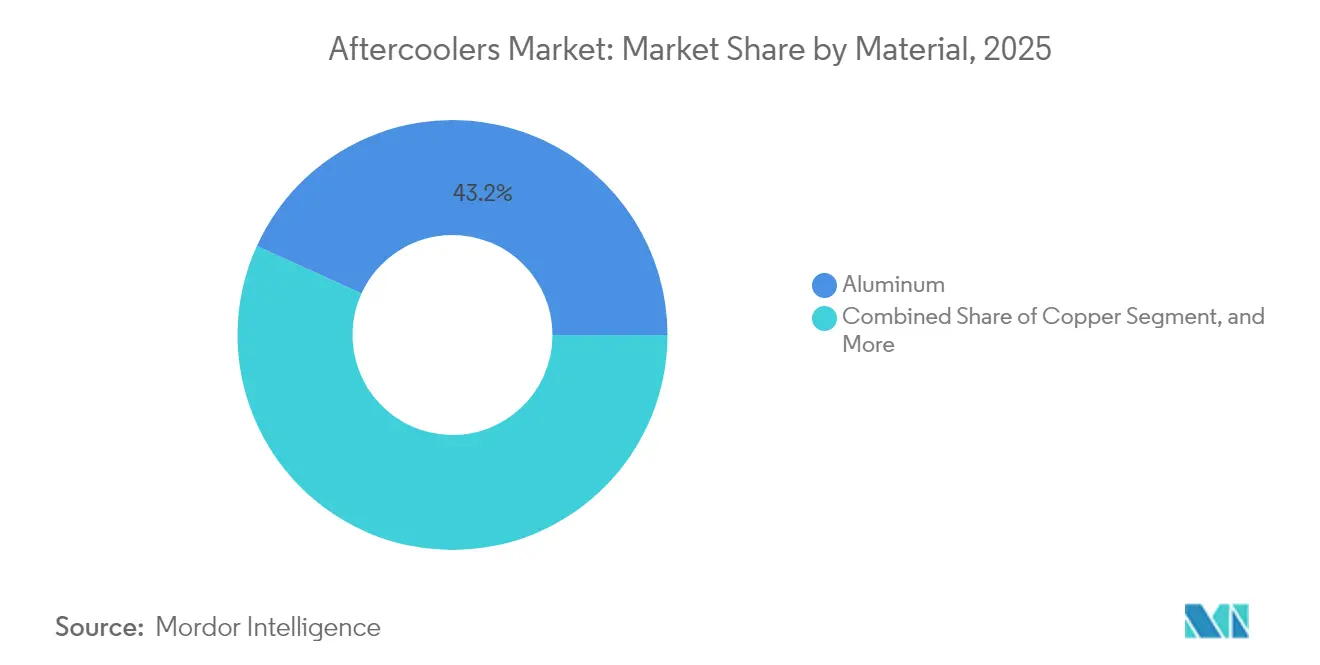
- By material, aluminium captured 43.20% of the aftercoolers market size in 2025 and is forecast to expand at a 12.25% CAGR during 2026-2031.
- By application, industrial operations accounted for 30.40% of the aftercoolers market size in 2025, whereas pharmaceuticals represent the most dynamic application, progressing at a 12.90% CAGR.
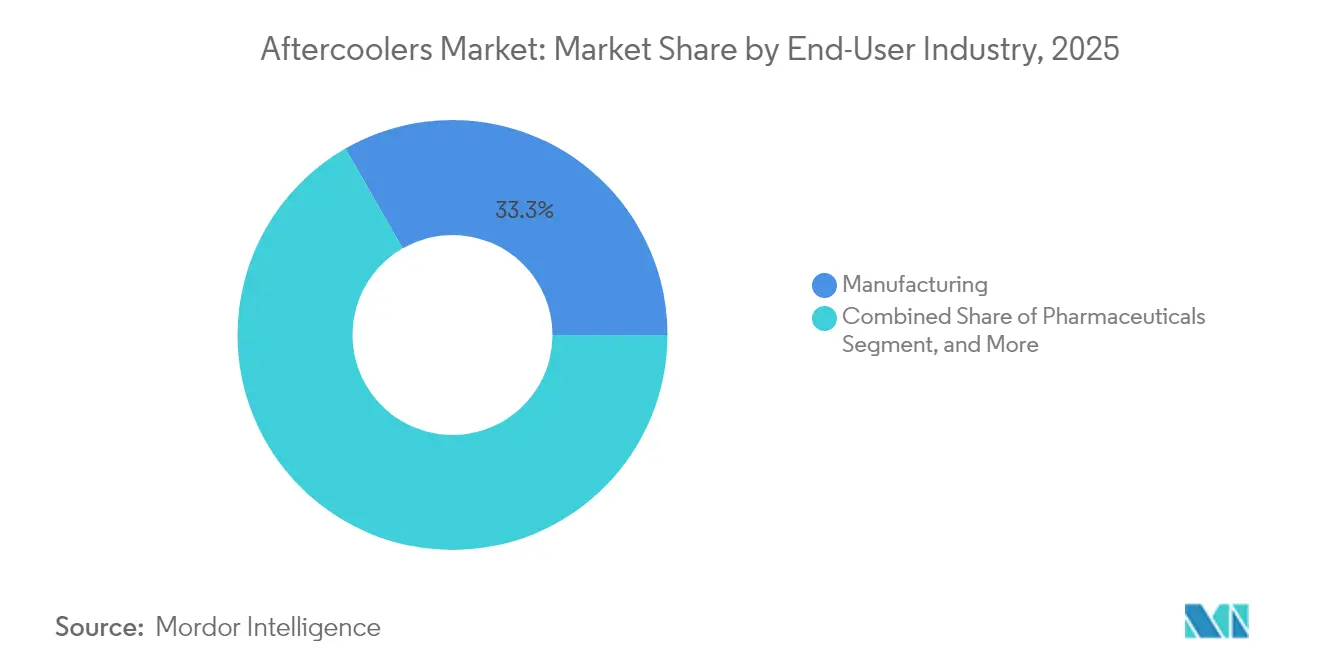
- By end-user, manufacturing industries retained a 33.30% share in 2025, while pharmaceuticals exhibited the strongest growth at a 13.10% CAGR through 2031.
- By sales channel, direct sales dominated with a 47.20% share in 2025; aftermarket services are accelerating the fastest at 12.55% CAGR on the strength of a growing installed base.
- by geography, Asia-Pacific led with a 38.10% share in 2025 and is projected to register a 12.95% CAGR through 2031.
Note: Market size and forecast figures in this report are generated using Mordor Intelligence’s proprietary estimation framework, updated with the latest available data and insights as of 2026.
Global Aftercoolers Market Trends and Insights
Drivers Impact Analysis*
| Driver | (~) % Impact on CAGR Forecast | Geographic Relevance | Impact Timeline |
|---|---|---|---|
| Rising industrial automation elevates compressed-air installations | +2.10% | Global, with APAC and North America leading | Medium term (2-4 years) |
| Energy-efficiency regulations favour high-performance aftercoolers | +1.80% | North America and Europe, expanding to APAC | Long term (≥ 4 years) |
| Stringent food and beverage-pharma purity mandates for moisture-free air | +1.40% | Global, concentrated in developed markets | Medium term (2-4 years) |
| Oil and gas - power revamp projects demand rugged high-capacity units | +1.20% | Middle East, North America, Asia-Pacific | Short term (≤ 2 years) |
| Industry 4.0 smart aftercoolers enable predictive maintenance | +0.90% | Developed markets, gradual EM adoption | Long term (≥ 4 years) |
| Modular microgrid compressor packages require compact aftercoolers | +0.70% | Global, renewable energy focused regions | Medium term (2-4 years) |
| Source: Mordor Intelligence | |||
Rising Industrial Automation Elevates Compressed-Air Installations
Automation upgrades are increasing compressed-air consumption by 15-20% across automotive, electronics, and precision manufacturing plants, where moisture-free air is essential for robotic tools and pneumatic actuators.[1]International Federation of Robotics, “World Robotics Industrial Robots Report,” ifr.org Integrated assembly lines depend on ISO 8573 air-quality classes, prompting investment in larger or additional aftercoolers. Distributed manufacturing and near-shoring strategies have led to an increase in greenfield projects that incorporate aftercoolers at the design stage, ensuring uptime and process integrity. Industry platforms monitor air temperature and dew point in real time, reinforcing the role of smart aftercoolers in predictive maintenance regimes. These dynamics automate the core engine for the sustained expansion of the aftercoolers market.
Energy-Efficiency Regulations Favor High-Performance Aftercoolers
The U.S. Department of Energy’s 2024 compressed-air standards set minimum efficiency thresholds that newly installed aftercoolers must meet. California’s Title 24 guidelines and parallel European Union directives amplify demand for units with optimized fin geometry, aluminium alloys, and reduced pressure drop, often delivering 20-30% energy savings relative to legacy designs. Manufacturers are redirecting research budgets toward computational fluid dynamics modelling to achieve compliance without sacrificing flow capacity.[2]American Society of Heating, Refrigerating and Air-Conditioning Engineers, “Industrial Cooling Systems Standards,” ashrae.org Incentive programs for energy-efficient equipment improve payback periods, supporting procurement decisions even in budget-constrained facilities. The resulting uptake positions energy mandates as a long-duration catalyst for both replacement and greenfield sales.
Stringent Food and Beverage-Pharma Purity Mandates for Moisture-Free Air
FDA requirements under 21 CFR 117 and GMP protocols mandate that processors maintain low dew points and prevent microbial growth, necessitating the use of precision aftercoolers in conjunction with filtration and dryers.[3]U.S. Food and Drug Administration, “Food Safety Modernization Act Regulations,” fda.gov European Medicines Agency guidance confirms similar standards, elevating equipment specifications for sterile environments. Pharmaceutical tablet coating and aseptic filling lines rely on temperature-controlled aftercoolers to avoid condensation that compromises product integrity. Food processors implementing HACCP protocols specify stainless-steel heat exchangers or corrosion-resistant coatings to ensure hygiene and regulatory conformity. Compliance audits reinforce recurring replacement cycles, sustaining segment-specific demand within the aftercoolers market.
Oil and Gas-Power Revamp Projects Demand Rugged High-Capacity Units
Combined-cycle turbines, LNG compression trains, and refinery debottlenecking projects require water-cooled, or hybrid aftercoolers rated for elevated pressures, corrosive gases, and 24-hour duty cycles.[4]Baker Hughes, “Saudi Arabia Gas Expansion Project Contract,” bakerhughes.com Baker Hughes’ USD 200 million supply agreement for Saudi Arabia's expansion exemplifies large orders that embed customized aftercoolers into packaged compressor systems. Operators prioritize modular designs for faster field installation and ease of maintenance in remote sites. Specification sheets mandate 316 SS or duplex alloys, galvanic isolation, and high-capacity condensate separation to ensure multi-year reliability. Infrastructure modernization within energy value chains thus provides stable, high-value opportunities for premium aftercooler vendors.
Restraints Impact Analysis*
| Restraint | (~) % Impact on CAGR Forecast | Geographic Relevance | Impact Timeline |
|---|---|---|---|
| Up-front capex of advanced water-cooled systems deters SMEs | -1.60% | Global, particularly emerging markets | Short term (≤ 2 years) |
| Low-cost imports trigger price competition and margin pressure | -1.30% | North America and Europe primarily | Medium term (2-4 years) |
| Shortage of thermal-design talent slows custom projects in EMs | -0.80% | Emerging markets, Asia-Pacific focus | Long term (≥ 4 years) |
| ESG scrutiny on plant water-use curbs water-cooled adoption | -0.60% | Global, developed markets leading | Medium term (2-4 years) |
| Source: Mordor Intelligence | |||
Up-Front Capex of Advanced Water-Cooled Systems Deters SMEs
Water-cooled aftercoolers cost 40-60% more than air-cooled units once cooling towers, water treatment skids, and controls are factored in. Small and medium manufacturers working with constrained capital budgets often select less-efficient air-cooled equipment to avoid external financing. The need for specialized contractors during installation further elevates project outlays, discouraging upgrades in emerging markets with limited technical resources. As a result, adoption curves lag among SMEs, despite attractive lifecycle energy savings, which temper near-term penetration rates in the aftercooler market.
Low-Cost Imports Trigger Price Competition and Margin Pressure
Chinese exporters have lifted aftercooler shipments by 25% since 2024, offering standard models at discounts of 30-40% compared with Western brands. Price-focused customers, especially in aftermarket replacements, opt for lower-cost units, compressing margins for incumbents. European and North American suppliers respond with extended warranties and bundled services, but higher support costs erode profitability. Persistent price deflation risks underfunding R&D, potentially delaying material and design innovations that could otherwise lift overall market value.
*Our forecasts treat driver/restraint impacts as directional, not additive. The impact forecasts reflect baseline growth, mix effects, and variable interactions.
Segment Analysis
By Type: Air Compressor Units Retain Scale Advantage
Air compressors' aftercoolers held 37.40% of the aftercoolers market size in 2025, driven by the widespread use of rotary screw and centrifugal compressors in factories and workshops. Investments in automated assembly and precision machining rely on these units to reduce discharge temperatures, thereby preventing downstream condensation that can impair pneumatic valves. Product lines span compact brazed-plate designs for 10 kW compressors to shell-and-tube assemblies servicing multimegawatt industrial packages. Hydraulic oil aftercoolers, which are advancing at a 13.85% CAGR, benefit from the rising electrification of off-highway machinery, where high-pressure hydraulic circuits dissipate significant thermal loads.
Field feedback highlights the continuing relevance of engine aftercoolers in marine propulsion and power generation, where charge-air cooling mitigates turbocharger outlet temperatures. Turbine and portable aftercoolers cater to aerospace test stands and temporary construction sites. Diverse duty profiles sustain a broad engineering catalogue, underpinning consistent baseline revenue even as emerging smart monitoring features redefine value propositions in the aftercooler market.


By Cooling Method: Air-Cooled Dominance Meets Water-Cooled Momentum
Air-cooled variants commanded a 61.10% aftercooler market share in 2025 due to their simplicity of installation and independence from water supplies. Heat is rejected through ambient airflow across finned surfaces, minimizing the need for auxiliary infrastructure in arid or water-restricted regions. However, energy audits reveal water-cooled designs deliver 20-30% higher heat-removal efficiency, saving substantial compressor energy on high-capacity lines. Utilities with favourable water tariffs and plants targeting ISO-50001 certification increasingly justify the higher initial cost.
Hybrid solutions, which combine primary water-cooled stages with secondary air-cooled sections, are now specified for seasonal climates to balance operating costs and water stewardship. Manufacturers are standardizing modular skid packages that integrate pumps, filters, and digital flow meters, reducing on-site engineering hours. These innovations accelerate the uptake of water-cooled products, supporting a forecasted 13.05% CAGR while preserving the dominant installed base of air-cooled products in the global aftercoolers market.
By Material: Aluminium Extends Leadership Through Alloy Innovation
Aluminium units secured a 43.20% market share of the aftercoolers market in 2025, driven by their corrosion resistance, high heat-transfer coefficient, and low weight. New alloy classes, such as AA3F05, combine fine-grain microstructures with zinc-magnesium additions to improve mechanical strength at elevated temperatures. Laser-welded plate-fin cores enable thinner walls, reducing raw material consumption while maintaining pressure integrity.
In seawater or corrosive chemical environments, brass and copper remain relevant, although price volatility limits their adoption where aluminum meets thermal specifications. Composite tubes featuring polymer liners and metallic outer shells are being evaluated for their ability to withstand extreme thermal cycling. Life-cycle assessments, which account for scrap value and energy-related carbon savings, are increasingly influencing material selection, reinforcing aluminium’s favourable balance of performance and sustainability within the aftercoolers market.
By Application: Industrial Operations Dominate, Pharmaceuticals Surge
Industrial processes accounted for 30.40% of the aftercooler market size in 2025, reflecting the foundational role of compressed air in machining, conveying, and surface finishing. Retrofits to legacy plants often replace undersized aftercoolers to unlock compressor efficiency gains and improve tool longevity. Meanwhile, pharmaceutical lines installing lyophilization and aseptic filling modules seek dew-point control to prevent microbial contamination, propelling a 12.90% CAGR for the segment.
Commercial building automation integrates aftercoolers in centralized compressed-air plants that serve HVAC actuators and instrumentation. Food processors focus on sanitary finishes and condensate separation to meet FDA inspections. Oil and gas operators emphasize ruggedized shells and high-alloy tubes resisting sour-gas corrosion, whereas power generators prize continuous-duty reliability. This application diversity cushions cyclical swings, broadening revenue resilience for suppliers across the aftercoolers market.
By End-User Industry: Manufacturing Commands, Pharmaceuticals Accelerate
Manufacturing plants absorbed 33.30% of 2025 shipments, with automotive, electronics, and general engineering relying on compressed-air utilities to power robotics, pick-and-place arms, and paint booths. Tight takt times heighten sensitivity to moisture-induced valve failures, raising demand for preventive replacement of aging aftercoolers. Pharmaceuticals, scaling bioreactor capacities, and fill-finish suites exhibit the fastest uptake at a 13.10% CAGR, driven by rigorous GMP audits and the expansion of vaccine production.
Energy and utilities install large shell-and-tube aftercoolers in gas pipelines and turbine skids. Food processors deploy stainless-steel heat exchangers that withstand aggressive wash-down chemicals, while rail and marine transport specify compact, vibration-resistant units. Integration depth across multiple sectors underscores how the aftercoolers market anchors reliability strategies in diverse industrial ecosystems.
By Sales Channel: Direct Engagement Retains Primacy as Aftermarket Builds
Direct contracts accounted for 47.20% of global revenue in 2025, as buyers of engineered-to-order systems increasingly demand application engineering, CFD validation, and site commissioning expertise. Key accounts often enter into multi-year service agreements that are bundled with remote monitoring portals. Distributor networks address regional workshops and tier-two suppliers that prefer off-the-shelf catalogue units.
Aftermarket revenue, expanding at a 12.55% CAGR, benefits from a growing installed base that surpasses typical 10-year refurbishment cycles. E-commerce portals streamline parts identification and expedite shipment, reducing compressor downtime. Some OEMs are piloting subscription models that bundle replacement coils, gaskets, and analytics software, signaling an evolving monetization path within the aftercooler market.
Geography Analysis
Asia-Pacific led with a 38.10% share in 2025 and is projected to register a 12.95% CAGR through 2031, propelled by China’s “Made in China 2025” plan, India’s Production Linked Incentives, and Southeast Asia’s electronics expansions. Government programs channel capital toward smart factories, boosting the adoption of high-efficiency aftercoolers in automotive, semiconductor, and machinery clusters. Japanese and South Korean producers emphasize precision cooling solutions for robotics and battery manufacturing lines, solidifying regional technical leadership.
North America, while mature, continues to experience incremental growth as U.S. plants modernize their compressed-air systems to comply with Department of Energy standards and corporate net-zero pledges. The shift to electric-vehicle assembly and the build-out of semiconductor fabs in the United States sustain steady order flow. Canada’s LNG export projects and Mexico’s auto parts corridor provide targeted opportunities, particularly for rugged, water-cooled units rated for desert climates.
Europe maintains balanced progress underpinned by energy-efficiency directives and industrial digitization grants. Germany’s Mittelstand integrates smart monitoring modules, France upgrades process industries, and the United Kingdom redirects pharmaceutical capacity post-Brexit. Eastern European plants attract foreign direct investment, necessitating localized aftermarket support. Across the continent, water-cooled adoption rises where utilities offer reclaimed-water tariffs, further diversifying regional demand in the aftercoolers market.

Competitive Landscape
The market structure remains moderately fragmented, with the top five suppliers controlling roughly 45-50% of global revenue, allowing mid-tier specialists to thrive in their respective niches. Atlas Copco, Ingersoll Rand, and Kaeser Kompressoren capitalize on broad portfolios, digital dashboards, and global service fleets. Recent capacity expansions in Belgium and targeted acquisitions in Italy and China demonstrate investment aimed at reducing lead times and expanding application coverage.
Product differentiation hinges on heat-transfer efficiency, corrosion-resistant alloys, and embedded IoT sensors that relay dewpoint and delta-T data to cloud platforms. Vendors bundle condition-based maintenance, warranty extensions, and performance guarantees backed by computational simulations. Competitive gaps surface around rapid-deployment skids for renewable-energy microgrids and modular production pods, where smaller innovators introduce lightweight aluminium designs tailored for containerized compressor sets.
Price pressure from low-cost imports persists in standard catalogue ranges, prompting established brands to emphasize total-cost-of-ownership calculators, trade-in rebates, and energy-savings audits. Consolidation trends appear in the form of vertical integration with filter, dryer, and controls suppliers, delivering turnkey air-treatment packages. This convergence positions service quality and lifecycle analytics as central battlegrounds within the aftercoolers market.
Aftercoolers Industry Leaders
Atlas Copco AB
Ingersoll Rand Inc.
Kaeser Kompressoren SE
Parker Hannifin Corporation
Gardner Denver, Inc.
- *Disclaimer: Major Players sorted in no particular order

Recent Industry Developments
- July 2025: Atlas Copco deployed its Optimizer 4.0 system with integrated aftercooler monitoring at a food and beverage manufacturing facility in Europe, enabling the customer to achieve EUR 5,000 (USD 5,807.2) in annual energy savings through optimized compressed air system efficiency and real-time performance monitoring of aftercooler operations.
- May 2025: Atlas Copco installed its Optimizer 4.0 control system at a global glass ceramics manufacturer, integrating aftercooler performance optimization that contributed to approximately EUR 36,000 (USD 41,811.44) in annual energy savings through improved thermal management and system sequencing efficiency.
- April 2025: A fast-moving consumer goods producer implemented Atlas Copco's Optimizer 4.0 system with aftercooler integration, achieving EUR 21,000 (USD 24,307) in annual energy savings through enhanced compressed air system efficiency and optimized cooling performance across multiple production lines.
- March 2025: A cardboard packaging producer achieved a 20% annual energy savings through Atlas Copco's redesign of its compressed air system, incorporating optimized aftercooler configurations and advanced control systems, which reduced the carbon footprint while maintaining production capacity.


Global Aftercoolers Market Report Scope
The Aftercoolers Market Report is Segmented by Type (Air Compressor Aftercoolers, Engine Aftercoolers, Hydraulic Oil Aftercoolers, Other Types), Cooling Method (Air-Cooled, Water-Cooled), Material (Aluminum, Brass, Copper, Other Materials), Application (Industrial, Commercial, Food and Beverage Processing, Pharmaceutical, Oil and Gas, Power Generation, Others), End-User Industry (Manufacturing, Energy and Utilities, Pharmaceuticals, Food Processing, Transportation, Others), Sales Channel (Direct Sales, Distributor Sales, Aftermarket), and Geography (North America, South America, Europe, Asia Pacific, Middle East, Africa). The Market Forecasts are Provided in Terms of Value (USD).
| Air Compressor Aftercoolers |
| Engine Aftercoolers |
| Hydraulic Oil Aftercoolers |
| Other Types (Turbine Coolers, Portable Aftercoolers, Filter Pre-coolers) |
| Air-Cooled Aftercoolers |
| Water-Cooled Aftercoolers |
| Aluminum |
| Brass |
| Copper |
| Other Materials |
| Industrial |
| Commercial |
| Food and Beverage Processing |
| Pharmaceutical |
| Oil and Gas |
| Power Generation |
| Others Applications (Automotive, Chemical, Manufacturing) |
| Manufacturing |
| Energy and Utilities |
| Pharmaceuticals |
| Food Processing |
| Transportation |
| Others End-User Industries |
| Direct Sales |
| Distributor Sales |
| Aftermarket |
| North America | United States |
| Canada | |
| Mexico | |
| South America | Brazil |
| Argentina | |
| Rest of South America | |
| Europe | Germany |
| France | |
| United Kingdom | |
| Italy | |
| Spain | |
| Russia | |
| Rest of Europe | |
| Asia Pacific | China |
| India | |
| Japan | |
| South Korea | |
| ASEAN | |
| Rest of Asia Pacific | |
| Middle East | Saudi Arabia |
| United Arab Emirates | |
| Turkey | |
| Rest of Middle East | |
| Africa | South Africa |
| Egypt | |
| Nigeria | |
| Rest of Africa |
| By Type | Air Compressor Aftercoolers | |
| Engine Aftercoolers | ||
| Hydraulic Oil Aftercoolers | ||
| Other Types (Turbine Coolers, Portable Aftercoolers, Filter Pre-coolers) | ||
| By Cooling Method | Air-Cooled Aftercoolers | |
| Water-Cooled Aftercoolers | ||
| By Material | Aluminum | |
| Brass | ||
| Copper | ||
| Other Materials | ||
| By Application | Industrial | |
| Commercial | ||
| Food and Beverage Processing | ||
| Pharmaceutical | ||
| Oil and Gas | ||
| Power Generation | ||
| Others Applications (Automotive, Chemical, Manufacturing) | ||
| By End-User Industry | Manufacturing | |
| Energy and Utilities | ||
| Pharmaceuticals | ||
| Food Processing | ||
| Transportation | ||
| Others End-User Industries | ||
| By Sales Channel | Direct Sales | |
| Distributor Sales | ||
| Aftermarket | ||
| By Geography | North America | United States |
| Canada | ||
| Mexico | ||
| South America | Brazil | |
| Argentina | ||
| Rest of South America | ||
| Europe | Germany | |
| France | ||
| United Kingdom | ||
| Italy | ||
| Spain | ||
| Russia | ||
| Rest of Europe | ||
| Asia Pacific | China | |
| India | ||
| Japan | ||
| South Korea | ||
| ASEAN | ||
| Rest of Asia Pacific | ||
| Middle East | Saudi Arabia | |
| United Arab Emirates | ||
| Turkey | ||
| Rest of Middle East | ||
| Africa | South Africa | |
| Egypt | ||
| Nigeria | ||
| Rest of Africa | ||


Key Questions Answered in the Report
How large is the aftercoolers market in 2026?
The aftercoolers market size stands at USD 1.86 billion in 2026 and is forecast to grow at 11.60% CAGR to 2031.
Which region leads global demand?
Asia-Pacific holds 38.10% of global sales, supported by extensive manufacturing expansions in China and India.
Why are water-cooled aftercoolers gaining popularity?
Energy-efficiency mandates and the need for precise temperature control drive a 13.05% CAGR for water-cooled designs despite higher capital cost.
Which application segment is expanding fastest?
Pharmaceutical manufacturing posts a 12.90% CAGR, fueled by stringent GMP air-quality requirements.
What factors restrain small and medium enterprise adoption?
High up-front costs of water-cooled systems and competition from low-priced imports limit SME investment in advanced aftercoolers.
Page last updated on:


