
Market Overview
| Study Period | 2021 - 2031 |
|---|---|
| Forecast Data Period | 2026 - 2031 |
| Base Year Market Size (2025) | USD 8.15 Billion |
| Market Size (2026) | USD 9.43 Billion |
| Market Size (2031) | USD 17.82 Billion |
| Growth Rate (2026 - 2031) | 13.58 % |
| Market Concentration | Medium |
Major Players *Disclaimer: Major Players sorted in no particular order Image © Mordor Intelligence. Reuse requires attribution under CC BY 4.0. | |
Brazil Biofuel Market Analysis by Mordor Intelligence
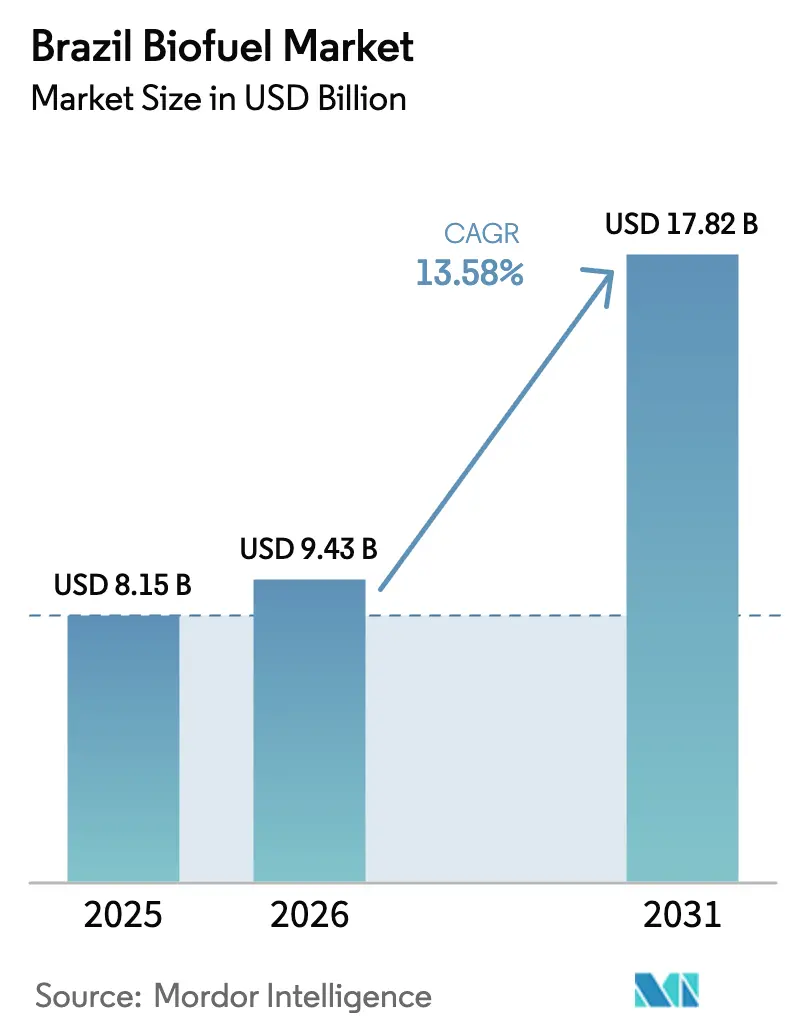
The Brazil Biofuel Market size is projected to be USD 8.15 billion in 2025, USD 9.43 billion in 2026, and reach USD 17.82 billion by 2031, growing at a CAGR of 13.58% from 2026 to 2031.
Growth rests on RenovaBio’s carbon-credit pull, statutory E27-to-E30 and B15-to-B20 blend hikes, and the structural cost edge that sugarcane enjoys over other global feedstocks. Flex-fuel vehicle ubiquity sustains elastic ethanol demand, while downstream refiners accelerate hydrotreatment projects to harvest sustainable aviation fuel (SAF) premiums. Carbon-credit pricing above BRL 70 unlocks second-generation retrofits, and high-irrigation cane yields continue to shield producers from commodity-price whiplash. Although electric-vehicle (EV) incentives temper long-term gasoline displacement, the sheer size of Brazil’s internal-combustion fleet keeps the Brazil biofuel market on an expansion path through 2031.[1]Reuters staff, “Brazil Biofuel Blend Mandates,” reuters.com
Key Report Takeaways
- By fuel type, bioethanol led with 55.8% Brazil biofuel market share in 2025, while SAF is set to climb at a 25.6% CAGR to 2031.
- By generation, first-generation pathways held 69.3% share of the Brazil biofuel market size in 2025, while second-generation cellulosic routes project a 15.2% CAGR through 2031.
- By feedstock, sugar crops accounted for 75.5% of the Brazil biofuel market size in 2025; lignocellulosic residues will advance at a 15.7% CAGR between 2026 and 2031.
- By technology, fermentation captured a 70.4% share in 2025, whereas hydrotreatment is poised to register a 16.3% CAGR to 2031.
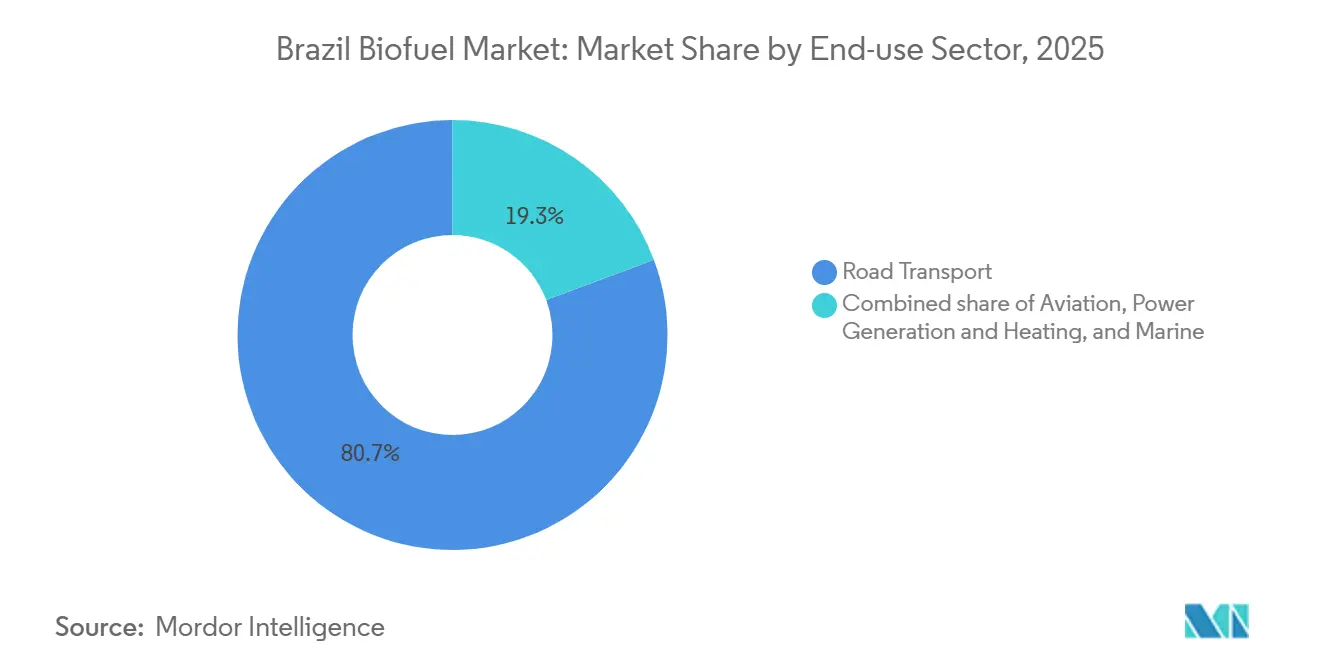
- By end-use sector, road transport absorbed 80.7% of demand in 2025; aviation demand is projected to rise at a 25.6% CAGR through 2031.
Note: Market size and forecast figures in this report are generated using Mordor Intelligence’s proprietary estimation framework, updated with the latest available data and insights as of January 2026.
Brazil Biofuel Market Trends and Insights
Drivers Impact Analysis*
| Driver | (~) % Impact on CAGR Forecast | Geographic Relevance | Impact Timeline |
|---|---|---|---|
| RenovaBio decarbonization targets | 2.50% | National, strongest in Southeast and South | Medium term (2-4 years) |
| Mandatory ethanol & biodiesel blend ratios | 2.00% | National, enforced by ANP | Short term (≤2 years) |
| Abundant low-cost sugarcane feedstock | 1.80% | Southeast, Center-West | Long term (≥4 years) |
| Flex-fuel vehicle fleet expansion | 2.20% | National | Medium term (2-4 years) |
| SAF R&D programs by Azul, GOL, Embraer | 1.50% | National production, international offtake | Long term (≥4 years) |
| CBIO carbon-credit price momentum | 1.30% | National, premium for second-generation fuel | Short term (≤2 years) |
| Source: Mordor Intelligence | |||


RenovaBio Decarbonization Targets Drive Carbon-Credit Revenue
RenovaBio obliges distributors to offset 10.1% of 2026 emissions, expanding to 11.8% by 2028, which anchors a predictable credit stream for compliant producers.[2]Ministry of Mines and Energy, “RenovaBio Targets,” gov.br CBIO prices rose from BRL 45 in early 2024 to BRL 85 by year-end 2025, rewarding mills that retrofit for cellulosic ethanol or hydrotreatment.[3]Argus Media, “CBIO Price Rally,” argusmedia.com Raízen’s Bonfim 2G plant earns 1.8 CBIOs per cubic meter, a 50% lift over first-generation ethanol, enhancing margins by USD 0.15 per liter.[4]Raízen S.A., “Bonfim 2G Plant,” raizen.com.br Transparent ANP accounting reduces counterparty risk, enabling CBIO-backed loans that accelerate retrofit paybacks.
Mandatory Blend Ratios Lock in Structural Demand
The Fuel of the Future Law lifts ethanol blends to E30 by 2028 and biodiesel to B20 by 2030, removing discretionary toggles that destabilized earlier mandates. The higher E30 ceiling alone requires 2.5 billion additional liters of ethanol a year, equal to the capacity from eight greenfield mills, while B20 pulls an extra 1.2 billion liters of biodiesel, tightening oilseed markets. ANP audits inventory monthly and levies penalties up to BRL 50,000 per violation, ensuring compliance across 27 states. Flex-fuel penetration above 95% of new car sales nullifies infrastructure barriers, allowing rapid field execution.
Sugarcane Feedstock Advantage Underpins Cost Leadership
Eight-point-five million hectares of cane yielded 580 million tons in the 2024–2025 harvest, delivering cash costs of USD 0.32–0.35 per liter, 40% under U.S. corn ethanol. Bagasse cogeneration covers 60% of milling power needs and generated USD 1.2 billion in grid sales in 2025, lifting plant gate margins. Genetic advances caused sucrose content to jump from 13.5% in 2020 to 14.8% in 2025, adding 9% volume without acreage growth. This structural moat shields domestic supply from global feedstock shocks.
Flex-Fuel Fleet Expansion Sustains Demand Elasticity
Flex-fuel vehicles formed 87% of Brazil’s 2.1 million new light-vehicle sales in 2025; the installed base now tops 30 million units. When ethanol traded below 70% of the gasoline price in late 2025, E100 consumption leaped 18% quarter-on-quarter, clearing surpluses. Automakers such as Volkswagen and GM maintain flex-fuel lineups through 2030, ensuring continued demand optionality.
Restraints Impact Analysis*
| Restraint | (~) % Impact on CAGR Forecast | Geographic Relevance | Impact Timeline |
|---|---|---|---|
| ILUC & deforestation concerns in Cerrado | −1.2% | Center-West | Medium term (2-4 years) |
| Soy-oil price volatility squeezes biodiesel margins | −0.8% | National, acute in South and Center-West | Short term (≤2 years) |
| Logistics bottlenecks in North & Northeast corridors | −0.6% | North and Northeast | Long term (≥4 years) |
| EV fiscal incentives diluting investor appetite | −1.0% | Major urban centers | Medium term (2-4 years) |
| Source: Mordor Intelligence | |||
ILUC & Deforestation Concerns Threaten Export Access
Soybean-linked land conversion cleared 7,800 km² of Cerrado in 2024, attracting EU scrutiny under the 2025 Deforestation Regulation. Brazilian biodiesel exports worth USD 420 million risk exclusion unless full traceability is proven, a challenge for smallholders lacking satellite monitoring. Only 38% of ethanol output carried third-party certification in 2025, forcing mills to fund compliance upgrades that raise cash costs by USD 0.02–0.04 per liter.
Soy-Oil Price Volatility Squeezes Biodiesel Margins
Soy oil ranged from USD 1,100 to USD 1,580 per ton in 2024–2025, compressing biodiesel margins from USD 0.18 to USD 0.06 per liter and prompting 12 plants to idle. Used cooking oil trades at a 25% discount, yet collection logistics exist chiefly in three southern states, limiting substitution.
*Our forecasts treat driver/restraint impacts as directional, not additive. The impact forecasts reflect baseline growth, mix effects, and variable interactions.
Segment Analysis
By Fuel Type: Bioethanol Dominance Meets SAF Disruption
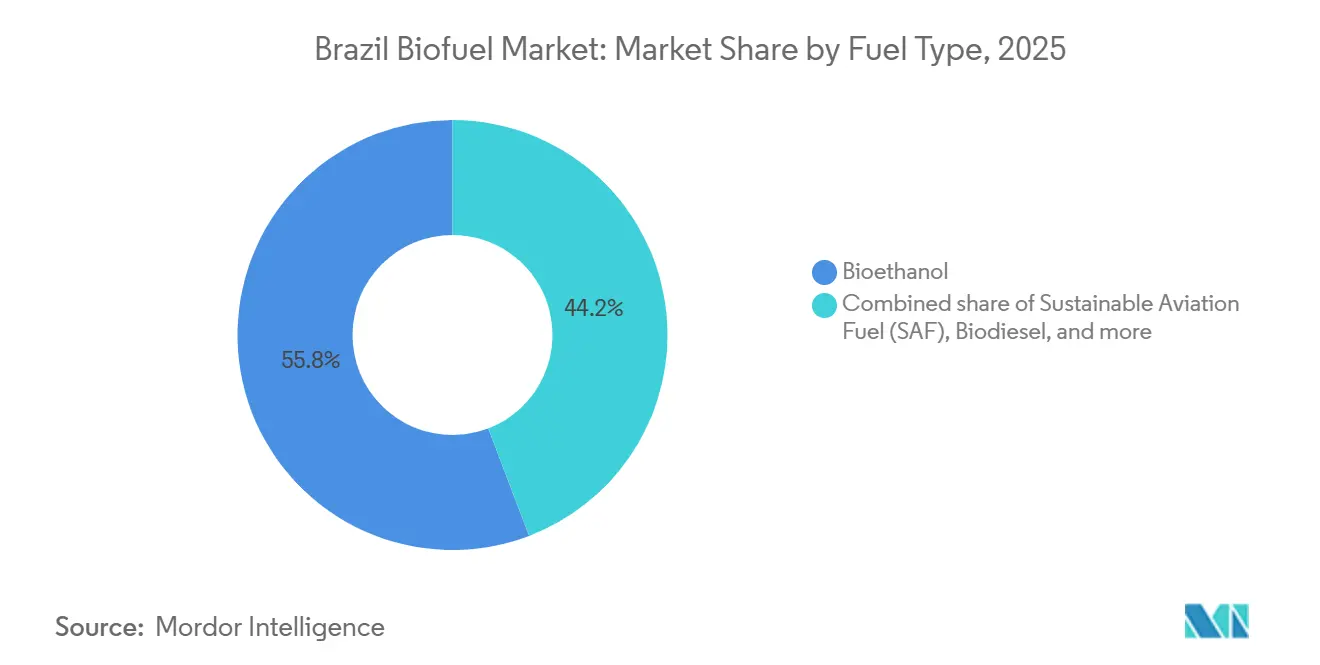
Bioethanol retained a 55.8% hold on the Brazil biofuel market in 2025, reflecting half a century of fermentation experience and widespread flex-fuel fleet adoption. SAF, though less than 2% in 2025, is scaling at 25.6% CAGR, buoyed by airline offtake contracts and hydrotreatment investments. Biodiesel’s 28% share rests on B15 mandates but faces soy-oil margin risk, while HVO capacity under construction signals a pivot to higher energy density diesel substitutes.
SAF becomes the fastest rising slice of the Brazil biofuel market as Petrobras and Raízen accelerate refinery retrofits. Azul aims for 10% jet blending by 2030, equivalent to 150 million liters yearly commitment, and Embraer certification removes technical doubts. Biodiesel share growth tilts on feedstock diversification toward used cooking oil and animal fats to escape soy-oil volatility, while bio-naphtha lines cater to petrochemical clients but remain niche.


By Generation: First-Gen Scale Versus Second-Gen Breakthroughs
First-generation pathways commanded 69.3% of the Brazil biofuel market in 2025, thanks to 400 cane mills and cash costs under USD 0.35 per liter. Second-generation cellulosic ethanol is growing at a 15.2% CAGR as mills monetize the 140 million-ton annual bagasse and straw stream.
Second-generation output reached 80 million liters in 2025 and pockets higher CBIO revenue, generating 1.8 credits per cubic meter versus 1.2 for first-generation fuel. GranBio’s plant restart illustrates debt-restructuring efficacy, while enzyme firms target cost cuts to USD 0.30 per liter by 2028, underpinning break-even economics.
By Feedstock: Sugarcane Supremacy Faces Residue Competition
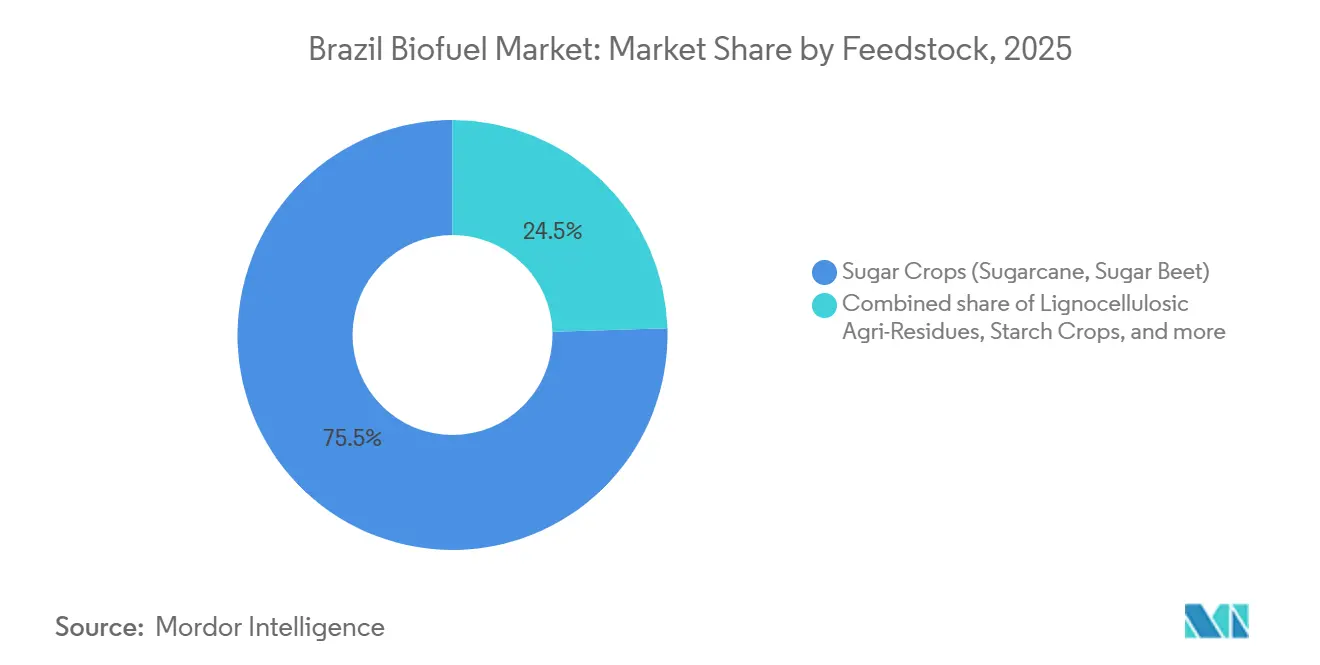
Sugar crops delivered 75.5% of input volume in 2025, benefitting from year-round tropical cultivation, ratooning, and co-generated power that offsets OPEX. Lignocellulosic residues, primarily bagasse and straw, rise at 15.7% CAGR as mills retrofit digesters.
Oilseeds accounted for an 18% share, yet soy-oil price gyrations restrict further penetration. Used cooking oil recovery hit 180 million liters in 2025, but the national potential approaches 600 million liters, contingent on municipal collection rollout.
By Technology: Fermentation Maturity Versus Hydrotreatment Surge
Fermentation held 70.4% of capacity in 2025, underpinned by mature yeast strains and capex advantage. Hydrotreatment, negligible two years earlier, climbs at 16.3% CAGR on the back of Petrobras’s USD 1.2 billion build and refinery co-processing pilots by BP Bunge.
Trans-esterification remains the main biodiesel route yet faces displacement as HVO meets diesel specs without blending ceilings. Gasification and Fischer-Tropsch stay in pilot stages due to capex multiples three times higher than fermentation.
By End-Use Sector: Road Transport Lock-In Versus Aviation Upswing
Road transport consumed 80.7% of output in 2025, a testament to 30 million flex-fuel vehicles and 42,000 ethanol pumps. Aviation, although small, shows a 25.6% CAGR, reflecting CORSIA mandates and the lack of electrification substitutes for medium-haul jets.
Marine adoption remains marginal pending IMO fuel-spec guidance, while power generation relies mainly on cane-mill cogeneration that exports surplus to the grid. Regional consumption skews to São Paulo and Minas Gerais, which together bought 48% of ethanol in 2025.
Geography Analysis
Brazil’s Southeast led biofuel consumption in 2025 with a 56% share and maintained average ethanol pump prices at 67% of gasoline parity, anchoring demand resilience. The region also houses most 2G retrofits, easing feedstock-to-mill logistics. Center-West states of Goiás and Mato Grosso posted the highest production growth as land prices remain 40% below São Paulo, though rail bottlenecks limit export velocity.
North and Northeast corridors bear elevated freight costs of USD 0.08–0.12 per liter because of underdeveloped pipelines and reliance on trucking over 1,500 km distances. These penalties offset cheaper land and labor, restraining greenfield attraction despite abundant cane potential. Government feasibility studies for the Paulínia-Brasília-Bahia pipeline underscore long-term intention yet lack funding timelines.
Southern states benefit from robust used cooking oil collection, yielding 120 million liters in 2025, which diversifies biodiesel feedstock and enhances CBIO scores for small refiners. The region’s colder climate favors HVO over FAME because hydrotreatment delivers lower cloud points, prompting Petrobras to prioritize supply to Paraná and Rio Grande do Sul once Duque de Caxias ramps to nameplate in 2028.
Regulatory Landscape
Brazil’s biofuels market is governed by RenovaBio (Law 13.576/2017) and related updates, alongside the Fuel of the Future framework (Law 14.993/2024). Under this broader decarbonization agenda, the framework formalizes sector programs covering sustainable aviation fuel (ProBioQAV), green diesel/renewable diesel (PNDV), and biomethane. ANP remains the core regulator for compliance, including certification and target-setting mechanics for distributors, and it published definitive RenovaBio decarbonization targets for the 2026 calendar year.
Blending and compliance rules continue to anchor demand. Biodiesel blending moved from B15 (in force for 2025) to B16 effective March 1, 2026, with the National Energy Policy Council (CNPE) empowered to adjust the biodiesel blend within a 13% to 25% range. On the carbon-credit side, ANP Resolution 984/2025 updated RenovaBio certification and compliance procedures. Enforcement has also tightened by limiting market participation of distributors that do not meet their individual RenovaBio obligations.
Competitive Landscape
Brazil hosts a moderately concentrated field where Raízen, BP Bunge, and Petrobras Biocombustíveis jointly command 45% of ethanol capacity and 38% of biodiesel output. Scale advantages emerge from vertical integration: Raízen links 26 cane mills with 7,000 service stations and an active CBIO trading desk, capturing margin from feedstock to retail. BP Bunge funnels USD 800 million into second-generation cellulosic retrofits, while Petrobras channels USD 1.2 billion toward SAF and HVO to secure airline offtakes.
Mid-tier players like Copersucar and São Martinho lean on marketing networks and CBIO arbitrage rather than capex-heavy retrofits, leaving them exposed if credit prices soften below BRL 60. Technology leadership influences ranking: Raízen’s 2024 enzyme patents promise a 12% yield gain, lowering cost by USD 0.05 per liter, and could extend its advantage once filed internationally.
New entrants emphasize niche playbooks. ECB Group’s Omega Green pursues 720 million liters of HVO derived from palm oil, though sustainability certification remains a hurdle. GranBio’s restart under RenovaBio-linked finance exemplifies rising appetite for residue-based capacity, yet project economics hinge on enzyme cost declines and credit stability.
Brazil Biofuel Industry Leaders
Raízen S.A.
BP Bunge Bioenergia S.A.
Petrobras Biocombustíveis S.A.
Atvos Agroindustrial
Copersucar S.A.
- *Disclaimer: Major Players sorted in no particular order


Market Opportunities and Future Outlook
The clearest opportunity sits in drop-in fuels for aviation and diesel pools. Under the 2024 Fuel of the Future Law, the dedicated national programs (ProBioQAV and PNDV) link project development with compliance demand, which is showing up in multi-year pipelines tied to HEFA and refinery co-processing routes. Acelen Renovaveis arranged USD 1.5 billion in financing for a Bahia biorefinery targeting 1 billion liters per year of SAF and HVO, and a consortium behind the Refinaria Riograndense initiative publicized plans to take a final investment decision in June 2026 for an approximately USD 1 billion advanced biofuels project in Rio Grande do Sul. These projects concentrate opportunity around feedstock contracting (used cooking oil, animal fats, and vegetable oils), hydrogen supply and hydrotreatment capacity, and logistics for airport and diesel distribution.
A second opportunity area is feedstock and technology diversification beyond sugarcane ethanol and soy-based biodiesel, supported by both cost and margin management. Corn ethanol capacity additions in Mato Grosso, including Inpasa’s expansion package (new plant in Rondonopolis and Nova Mutum expansion), broaden the national supply base and create scope for integrated production and co-products in Center-West agribusiness corridors. In parallel, biomethane scaling under the same policy umbrella supports demand for project development around agro-industrial residues and municipal waste streams, particularly where producers can pair decarbonization-credit revenue with firm offtake structures and measurable lifecycle-carbon performance.
Recent Industry Developments
- June 2026: Petrobras approved a USD 1.2 billion final investment decision for the RPBC Biorrefino project in Cubatao to produce bio-jet fuel (BioQAV) and renewable diesel, with operations targeted for 2030. This advances Brazil’s domestic supply build-out for drop-in fuels, supported by hydrotreatment capacity and secured feedstock supply. The project also aligns with airline and diesel-pool decarbonization pathways.
- March 2026: ANP published the definitive RenovaBio decarbonization targets for fuel distributors for the 2026 calendar year. By clarifying annual obligations, the update reinforced CBIO demand visibility for certified producers. It also strengthened the compliance-driven revenue layer tied to carbon intensity performance.
- June 2024: BP Bunge secured USD 600 million in green financing from IFC and DEG for four cellulosic ethanol upgrades targeting 120 million liters per year of output. The financing supports second-generation scale-up that monetizes bagasse and straw streams. It also aligns the upgrades with RenovaBio credit economics and improves the competitiveness of residue-based ethanol versus conventional routes.


Research Methodology Framework and Report Scope
Market Definition and Coverage
This market covers the value of biofuels supplied in Brazil for use as fuel, mainly ethanol and biodiesel, including volumes sold as neat fuel and volumes blended into conventional fuels across permitted blend ratios.
Scope exclusions: We exclude non-fuel biomass uses (such as food ingredients and industrial chemicals) and any double counting across blending, distribution, and end-use stages.
Segmentation Overview
- By Fuel Type
- Bioethanol
- Biodiesel (FAME)
- Renewable Diesel/HVO
- Sustainable Aviation Fuel (SAF)
- Bio-naphtha and Other Drop-in Biofuels
- By Generation
- First-Generation (Sugar and Starch)
- Second-Generation (Cellulosic)
- Third-Generation (Algae-based)
- Fourth-Generation (Synthetic Biology/Photobiological)
- By Feedstock
- Sugar Crops (Sugarcane, Sugar Beet)
- Starch Crops (Corn, Wheat, Cassava)
- Oilseeds (Soy, Rapeseed, Palm)
- Used Cooking Oil and Animal Fat
- Lignocellulosic Agri-Residues
- Algae
- By Technology
- Fermentation
- Trans-esterification
- Hydrotreatment (HVO/SAF)
- Gasification and FT-Synthesis
- Pyrolysis and Upgrading
- By End-use Sector
- Road Transport
- Aviation
- Marine
- Power Generation and Heating
Data Sources, Market Sizing, and Validation
Desk Research
Desk work starts with building a clean fact base on Brazil fuel demand and the biofuel supply system, and then mapping where biofuels enter the pool. We relied on public series such as ANP statistical yearbooks and open datasets, Brazil government energy planning publications, USDA FAS biofuels briefs, and IEA bioenergy country updates to understand production, blends, and policy-driven demand signals.
To convert volumes into value, we reviewed public fuel price references, tax and blend rule announcements, and reported industry capacity additions, then used company filings and investor materials to sanity-check revenue direction and utilization comments. Where helpful, we also used paid subscriptions for company financials and news screening, and an import-export shipment-level database to cross-check trade flows and timing. This list of desk sources is illustrative rather than exhaustive, since we also reviewed many other public documents for data collection, validation, and clarification.
Primary Interviews and Surveys
Primary work was used to pressure-test the desk model in a Brazil context, especially on blend compliance behavior, pricing pass-through, and the split between hydrous and anhydrous ethanol where it changes realized value. We spoke with participants across producers, distributors, and downstream fuel stakeholders, and we also checked views with policy and technical experts to confirm what changed, when it changed, and how quickly those changes showed up in volumes.
Table rows reflect the respondent split used to balance perspectives across the ethanol and biodiesel value chain in Brazil.
Distribution of primary research fieldwork respondents
| Company type | Respondent position |
|---|---|
| Top tier: 39% | CXOs: 12% |
| Mid tier: 40% | Functional/Unit leaders: 31% |
| Smaller Players: 21% | Managers: 57% |
Market-Sizing & Forecasting
Sizing is built from a top-down and bottom-up approach where national fuel consumption, blending mandates, and observed biofuel production and trade are used to reconstruct the demand pool that biofuels actually serve. Once that demand pool is built, value is calculated by applying representative realized pricing that is adjusted for product mix and major policy and tax shifts.
To keep the totals realistic, we corroborate the outcome with selective bottom-up checks, such as rolling up a sample of producer capacity and utilization signals, and using volume times price checks for key fuels where reliable public series exist. Inputs that matter most in Brazil include ethanol production and sales trends, biodiesel production growth tied to diesel blend changes, the split of hydrous versus anhydrous ethanol, and import or export movements that tighten or loosen supply.
For the forecast, scenario analysis is used, since blend mandates, fuel demand, and pricing can shift quickly with policy and macro conditions. Assumptions are first drafted from historical patterns and then refined through expert feedback, which is where we close gaps when a public series is delayed or when a rule change has not yet shown up in annual totals.
Data Validation & Update Cycle
Validation is done through several passes so the final series is consistent across volumes, pricing, and timing. Our analysts compare outputs against independent signals such as reported production totals, blend mandate milestones, and directional fuel demand indicators, then investigate large swings before sign-off.
Where mismatches show up, we re-check conversion factors and currency timing, and we assess whether a move was temporary or structural. If the variance cannot be explained with public data, we re-contact industry sources to reconcile assumptions. Reports are refreshed annually, with interim updates when material policy actions, major capacity changes, or sharp fuel-price moves occur. A final pre-delivery review is also completed so clients receive the most current view.
Mordor Intelligence's Brazil Biofuel Market Size Compared With Other Published Estimates
Published market sizes for Brazil biofuels often disagree because the underlying scope choices are not the same, even when the titles look identical. Differences usually come from what fuels are counted, whether value is measured at producer level or includes taxes and retail margins, and how blend rules are translated into volumes.
The main gap comes from estimates that include wider bioenergy products or count full retail fuel value. In this model, Mordor Intelligence limits the build to ethanol and biodiesel volumes tied to Brazil blend-linked demand signals and fuel-specific pricing references.
Benchmark comparison
| Source | Market Size | Gaps in Research Methodology |
|---|---|---|
| Mordor Intelligence | USD 8.15 B (2025) | |
| Regional Consultancy A | USD 12.67 B (2024) | This figure appears to use a broader value capture, likely counting additional fuel categories or applying a higher price basis, which can inflate value versus a blend-linked biofuel component build. |
| Trade Journal B | USD 0.78 B (2023) | This estimate likely narrows coverage to a subset of fuels, channels, or time windows, which can understate totals when major biofuel streams and mandated blending volumes are not fully captured. |
The spread in numbers is mostly explained by whether the estimate counts only the biofuel value inside the blended fuel pool or layers in adjacent products and downstream margins. By tying totals to observable volumes, policy-driven blending, and consistent price conversion steps, we can trace the result back to clear variables and repeat the calculation when inputs change.


Key Questions Answered in the Report
What was the value of the Brazil biofuel market in 2026?
The Brazil biofuel market size reached USD 9.43 billion in 2026.
How fast is sustainable aviation fuel expected to grow in Brazil?
SAF volume is projected to expand at a 25.6% CAGR between 2026 and 2031.
Which feedstock dominates Brazilian biofuel production?
Sugarcane leads, supplying 75.5% of feedstock volume in 2025.
Why are CBIOs important for Brazilian producers?
CBIO credits link revenue to carbon intensity, adding up to USD 0.15 per liter in margin for 2G ethanol.
Which companies hold the largest share of Brazilian ethanol capacity?
Raízen, BP Bunge, and Petrobras Biocombustíveis together control about 45% of capacity.
How will the E30 mandate influence ethanol demand?
Moving from E27 to E30 by 2028 will require an extra 2.5 billion liters of ethanol each year.
Page last updated on:


 Your data is secure and never sold or shared.


