Organic Biogas Market Size and Share
Market Overview
| Study Period | 2021 - 2031 |
|---|---|
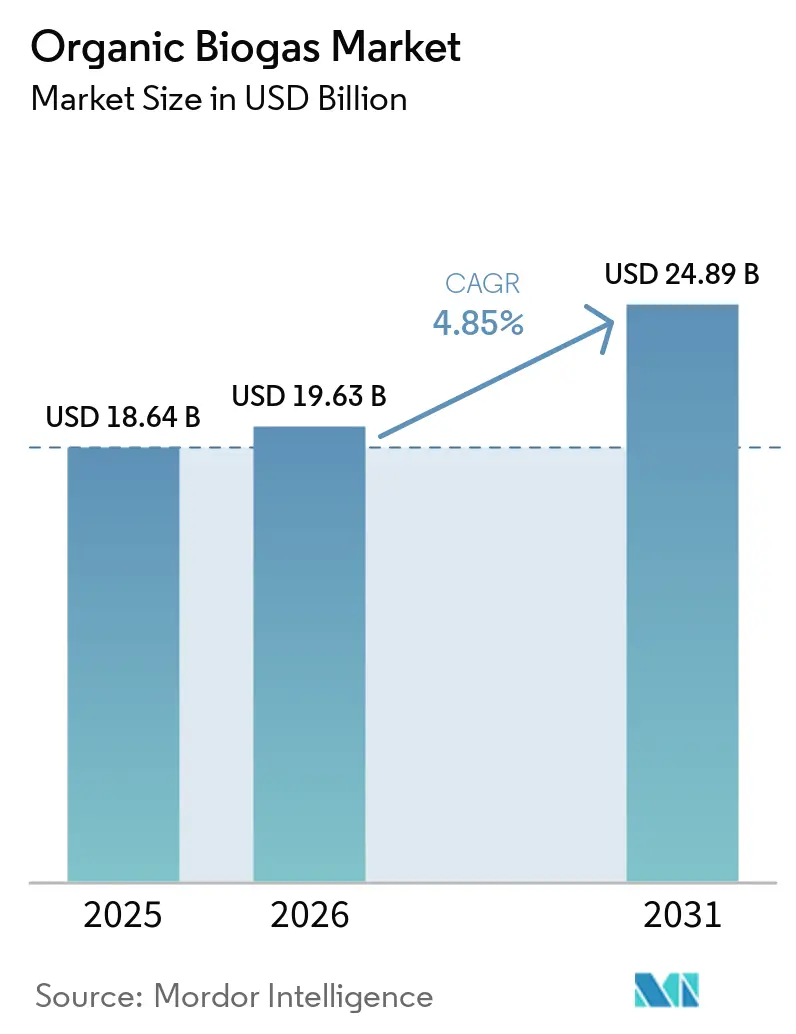
| Market Size (2026) | USD 19.63 Billion |
| Market Size (2031) | USD 24.89 Billion |
| Growth Rate (2026 - 2031) | 4.85% CAGR |
| Fastest Growing Market | Asia Pacific |
| Largest Market | Europe |
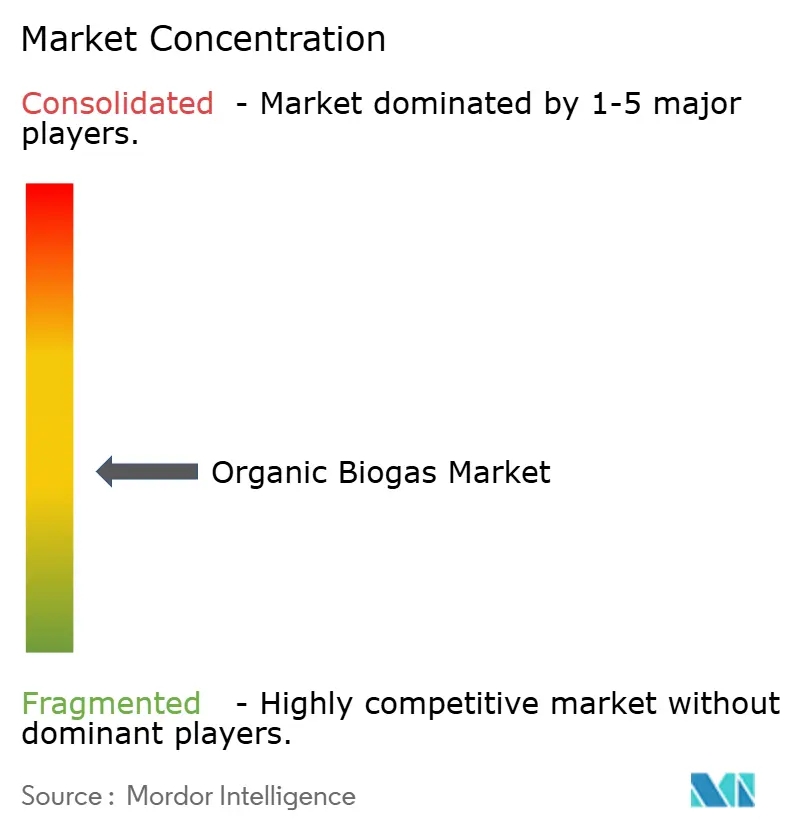
| Market Concentration | Medium |
Major Players *Disclaimer: Major Players sorted in no particular order Image © Mordor Intelligence. Reuse requires attribution under CC BY 4.0. | |
Organic Biogas Market Analysis by Mordor Intelligence
The Organic Biogas Market size is projected to be USD 18.64 billion in 2025, USD 19.63 billion in 2026, and reach USD 24.89 billion by 2031, growing at a CAGR of 4.85% from 2026 to 2031. Rising demand for renewable natural gas (RNG) credits, policy-driven gate-fee revenues, and consolidation among project developers are reshaping competitive dynamics. Vehicle-fuel use is accelerating as California’s Low Carbon Fuel Standard (LCFS) continues to pay premium carbon-intensity credits, while power-only combined heat and power (CHP) plants grapple with post-FIT economics. Dry, high-solids digestion is winning share because it lowers water consumption and allows modular deployment close to diversified feedstock sources. Meanwhile, Europe still commands the largest regional share, but Asia-Pacific is adding capacity faster on the back of China’s 14th Five-Year Plan and India’s SATAT program.
Key Report Takeaways
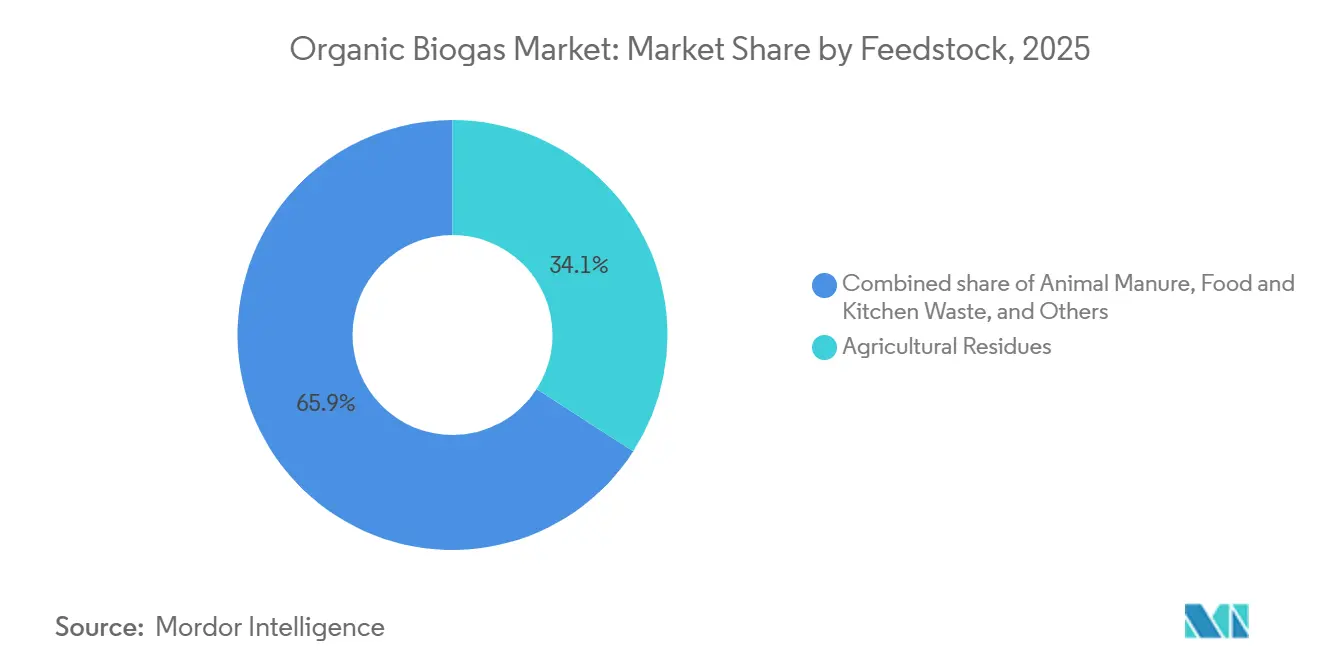
- By feedstock, agricultural residues accounted for 34.1% of the organic biogas market size in 2025, and food and kitchen waste is advancing at a 6.7% CAGR through 2031.
- By technology, wet anaerobic digestion retained 52.3% share in 2025; dry/high-solids systems represent the fastest-growing technology at 7.1% CAGR to 2031.
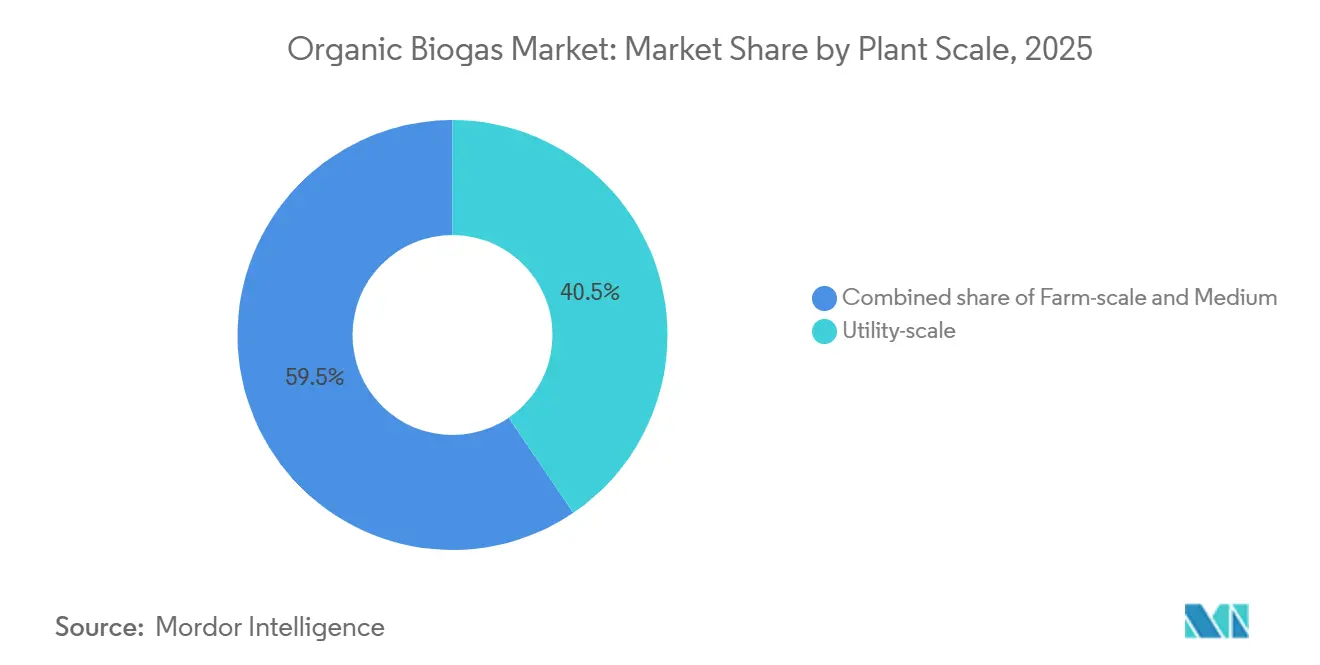
- By plant scale, utility-scale projects above 1 MW captured 40.5% share in 2025 and are growing at 5.5% CAGR over the forecast period.
- By application, CHP led with 39.6% of the organic biogas market share in 2025, while vehicle fuel is projected to expand at 8.4% CAGR through 2031.
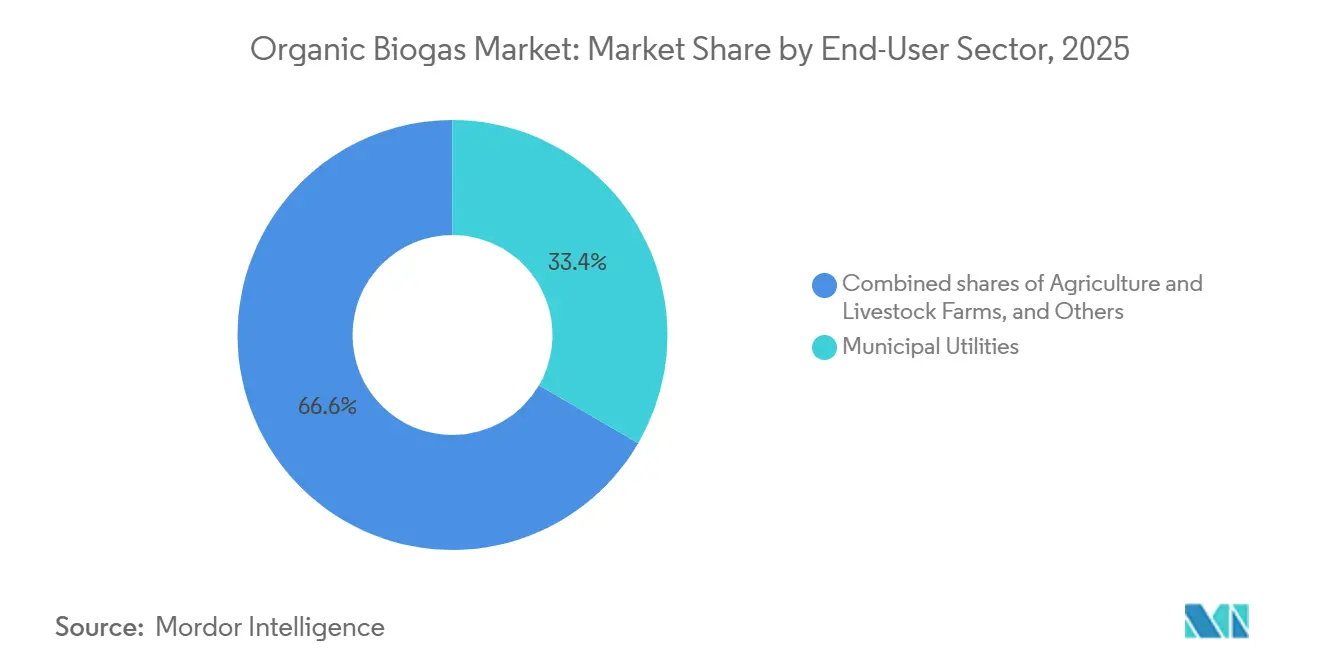
- By end-user, municipal utilities held 33.4% share in 2025, whereas transport fuel distributors recorded the highest projected CAGR at 7.9% through 2031.
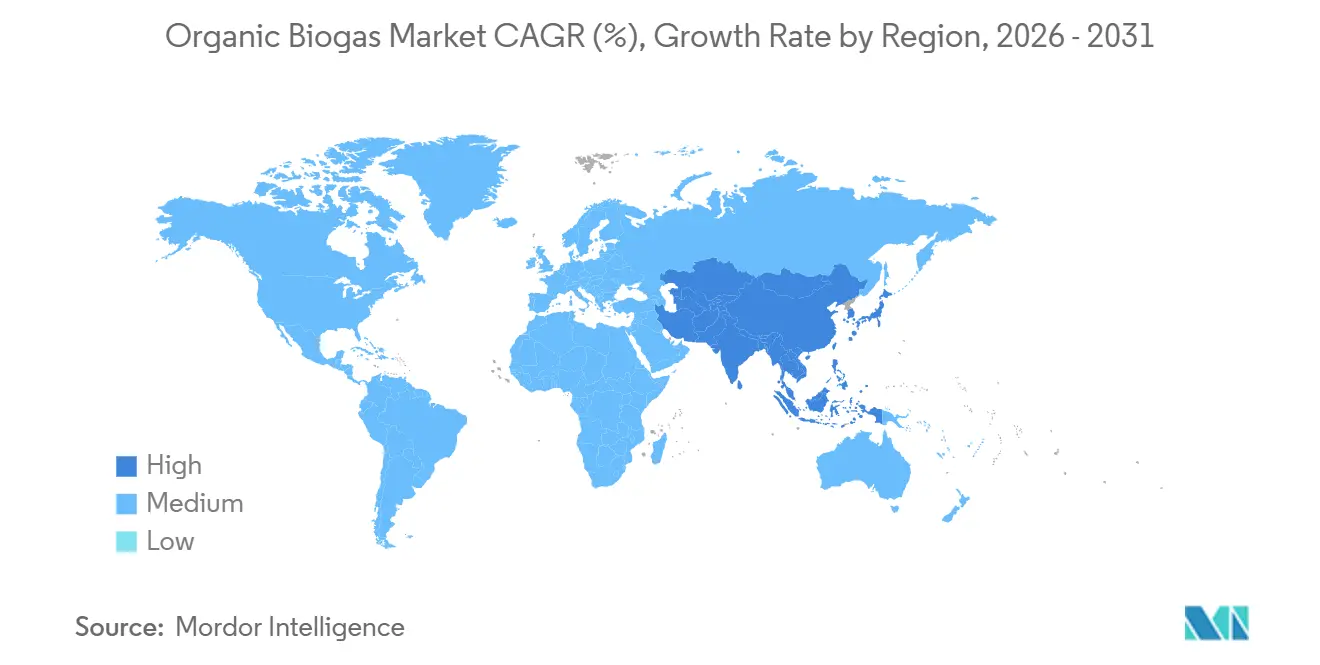
- By geography, Europe controlled 41.2% of 2025 revenue, but Asia-Pacific is the fastest-growing region at 6.4% CAGR to 2031.
Note: Market size and forecast figures in this report are generated using Mordor Intelligence’s proprietary estimation framework, updated with the latest available data and insights as of January 2026.
Global Organic Biogas Market Trends and Insights
Drivers Impact Analysis*
| Driver | (~) % Impact on CAGR Forecast | Geographic Relevance | Impact Timeline |
|---|---|---|---|
| Government incentives & renewable-energy targets | +1.20% | Europe, North America prominent | Medium term (2-4 years) |
| Rising organic-waste generation & landfill-diversion mandates | +0.90% | APAC urban centers, EU directive regions | Long term (≥ 4 years) |
| Decarbonization mandates for transportation fuels | +1.5% | North America, core EU, expanding APAC | Medium term (2-4 years) |
| Carbon-negative bio-fertilizer demand | +0.4% | Agriculture regions worldwide | Long term (≥ 4 years) |
| Corporate RNG procurement via virtual pipelines | +0.80% | North America primary, EU secondary | Short term (≤ 2 years) |
| Bio-LNG demand for green maritime corridors | +0.40% | Europe, APAC shipping routes | Long term (≥ 4 years) |
| Source: Mordor Intelligence | |||
Government Incentives & Renewable-Energy Targets
Investment-grade policy clarity underpins the organic biogas market. The US RNG Incentive Act anchors production tax credits that insulate developers from wholesale power volatility. Brazil’s 2025 biomethane statute obliges gas suppliers to cut emissions 10% from 2026, immediately sharpening purchase obligations for low-carbon molecules. Denmark’s 70% emission-reduction law executes a biomethane-first grid strategy that absorbs nearly all domestic feedstock potential. India’s SATAT scheme provides offtake guarantees that scale domestic bio-CNG plants, fostering a forty-fold demand rise by FY 2030.(1)Editorial Team, “SATAT Scheme Targets Bio-CNG Surge,” Natural Gas World, naturalgasworld.comSuch aligned measures give financiers confidence to back multimegawatt facilities with 15-year paybacks.
Rising Organic-Waste Generation & Landfill-Diversion Mandates
Municipal tipping-fee escalation and methane-abatement goals propel organic biogas market growth in cities. Advanced digesters now remove 95% biochemical oxygen demand from food waste while yielding 0.292 L methane per gram of chemical oxygen demand removed.(2)Source: Research Group, “Methane Yield from Food Waste in High-Load AD,” World Academy of Science Engineering and Technology, waset.orgAnaerobic membrane bioreactors co-located at wastewater plants treat high-strength organics and generate grid-quality biomethane streams. Typical metropolitan projects repay capital within six years once digestate fertilizer and carbon credits are monetized. Urban feedstock consistency enables larger facilities, lowering unit costs and boosting profitability relative to seasonally constrained farm residues.
Decarbonization Mandates for Transportation Bio-Fuels
Low Carbon Fuel Standards (LCFS) in California, Oregon, and British Columbia award credits on carbon intensity, granting biomethane premiums up to 60% of revenue stacks. Clean Energy Fuels and partners deploy virtual pipelines to truck RNG from dispersed sites toward demand hubs that lack direct pipeline access. Scandinavian Biogas’ 120 GWh Mönsterås unit liquefies biomethane into bio-LNG for heavy transport and short-sea shipping. Such models establish the organic biogas market as a bridge fuel until hydrogen and full electrification mature.
Carbon-Negative Bio-Fertilizer Demand
Digestate, rich in 2-4% nitrogen and 3-5% potassium, substitutes for synthetic fertilizer while enhancing soil carbon. Separation technologies yield liquid fractions for fertigation and pelletized solids with extended shelf life. Sales now deliver 15-25% of project revenue at European sites. Voluntary carbon markets recognize nutrient recycling as carbon-negative, adding a new stackable credit strengthening the organic biogas market outlook.
Restraints Impact Analysis*
| Restraint | (~) % Impact on CAGR Forecast | Geographic Relevance | Impact Timeline |
|---|---|---|---|
| High upfront CAPEX of anaerobic-digestion plants | -0.80% | Emerging markets most sensitive | Short term (≤ 2 years) |
| Feedstock seasonality & logistics complexity | -0.50% | Agricultural regions worldwide | Medium term (2-4 years) |
| Grid-injection bottlenecks & compliance costs | -0.40% | Europe, North America pipeline markets | Medium term (2-4 years) |
| Local opposition (odour, traffic) | -0.30% | Dense-population developed markets | Long term (≥ 4 years) |
| Source: Mordor Intelligence | |||
High Upfront CAPEX of Anaerobic-Digestion Plants
Utility-scale digesters cost USD 3-8 million per MW, reflecting bespoke preprocessing, biogas upgrading, and odor management systems. EnviTec’s EUR 50 million upgrades at Forst and Friedland double gas-upgrading capacity yet illustrate steep capital hurdles even for experienced operators. Although lenders cite technology risk, asset-class maturity, and 95% uptime records increasingly secure project finance in developed markets, while emerging regions still face constrained debt availability.
Grid-Injection Bottlenecks & Gas-Quality Compliance Costs
EN 16723 purity standards force installation of H₂S scrubbers, carbon-dioxide membranes, and moisture control, adding USD 1-3 million to plant budgets.(3)Source: Technical Bulletin, “EN 16723 Biomethane Quality Standards,” MDPI, mdpi.com Queue times for pipeline access exceed 24 months in parts of Germany and France, delaying revenue realization. Wärtsilä’s Puregas CA80 recovers 99.9% methane but demands specialized upkeep, which smaller operators struggle to afford.
*Our forecasts treat driver/restraint impacts as directional, not additive. The impact forecasts reflect baseline growth, mix effects, and variable interactions.
Segment Analysis
By Feedstock: Food Waste Gains as Ag Residues Plateau
Agricultural residues retained 34.1% of the organic biogas market share in 2025. In contrast, food waste meets municipal diversion mandates and is expanding at 6.7% annually, delivering reliable gate fees that improve project IRRs.
Municipal curbside programs are diverting 18 million tons of food waste per year within the EU alone, funneling high-energy substrates into digesters that realize 520 Nm³ of biogas per ton, roughly 45% more than average crop residues. California’s dairy sector illustrates parallel momentum: 12.3 million tons of manure fed to digesters in 2024 generated RNG credits worth USD 620 million, surpassing farm milk revenue for herds under 800 cows. The sewage sludge market is expected to decline after Germany bans land application from large plants in 2029.


By Technology: Dry Systems Challenge Wet Digestion Dominance
Wet CSTR continues to dominate with 52.3% share because of operational reliability and legacy investments, yet dry digestion is growing 7.1% per year by leveraging 70% lower water use and 40% smaller footprint. A DRANCO high-solids plant can reduce retention time to 21 days, boosting throughput without proportional capex.
Two-stage co-digestion designs boost methane yields from lipid-rich waste. However, this comes at an added cost of USD 1.2 million for a 1 MW setup. While Laguna-type systems are favored in tropical livestock hubs for their cost-effectiveness, they face scrutiny due to an average methane slip, jeopardizing their climate credentials. In 2025, the introduction of active-suction membrane covers reduced this slip. Yet, in markets where credit is hard to come by, this innovation has pushed the payback period out by over a year.
By Plant Scale: Utility Projects Dominate, Farm Units Multiply
Utility-scale assets above 1 MW seized 40.5% of 2025 installations and continue to grow at 5.5% CAGR as grid-injection economics absorb fixed upgrading and interconnection costs. A 5 MW unit in Denmark generates EUR 24.2 million in blended biomethane and certificate revenue, delivering a 9.2% unlevered IRR.
Medium-scale digesters (250 kW–1 MW), mainly clustering around agro-industrial districts. Farm-scale units below 250 kW are multiplying fastest in India, China, and Africa, but despite subsidies covering up to 75% of capex, unit-level economics remain marginal unless predictive IoT controls lift capacity factors into the mid-80% range.
By Application: Vehicle Fuel Surges as CHP Stagnates
CHP contributed 39.6% to the 2025 revenue; however, it is expected to experience modest growth due to the expiration of legacy FITs and persistently low wholesale power prices in Europe. Bio-CNG and bio-LNG together represent the highest-growth use, adding 8.4% yearly through 2031 as fleets adopt RNG to satisfy tightening emission limits.
Organic biogas is influenced by mandates such as California's 12.5% renewable gas requirement by 2030. Stand-alone electricity plants are primarily utilized in regions where diesel generation costs are prohibitively high, while district heating adoption is supported by Nordic carbon taxes exceeding EUR 90 per ton.
By End-User Sector: Transport Distributors Outpace Municipal Utilities
Municipal wastewater utilities still form the single largest customer class at 33.4% share, but transport fuel distributors are scaling faster at 7.9% CAGR, locking in 15-year offtake contracts that securitize future LCFS compliance costs.
Agricultural enterprises' digesters double as manure-management tools required by nutrient caps. Food processors are accelerating installations to meet corporate net-zero schedules, while waste-management firms pivot from declining landfill gas revenues toward food-waste AD investment.
Geography Analysis
Europe maintained 41.2% of 2025 revenue, anchored by Germany’s 9,500 plants and Denmark’s world-leading 28% biomethane grid penetration. Feedstock sources mature, and interconnection queues stretch to 18 months in regions such as Bavaria. Nordic countries are experiencing growth, driven by a 30% renewable transport fuel mandate and the early adoption of bio-LNG.
Asia-Pacific will expand 6.4% annually through 2031, making it the fastest-growing region in the organic biogas market. China’s CNY 50 billion rural-digester fund and India’s 5,000-plant SATAT target underpin momentum, though execution lags amid land fears and offtake-price disputes. Japan is emerging as a niche leader post-2024 Food Recycling Law amendments, and Southeast Asian growth is backed by palm-effluent lagoon projects.
In North America, California drives RNG demand via LCFS, while Canada’s provincial carbon taxes have triggered a dozen new projects in British Columbia and Quebec. Mexico adds capacity mainly for on-site steam in food factories because of limited pipeline access. South America and the Middle East & Africa remain small but are logging pilot projects in Brazil’s sugar sector and the UAE’s waste-to-energy build-out.(4)European Biogas Association, “Statistical Report 2026,” europeanbiogas.eu

Competitive Landscape
The organic biogas market is moderately fragmented. Seven M&A deals above USD 100 million closed between 2024 and early 2026, with Copenhagen Infrastructure Partners and Asterion Industrial Partners leading platform roll-ups. European incumbents such as EnviTec and PlanET are vertically integrating EPC and O&M to lock in service revenue, whereas North American specialists Clean Energy Fuels and Anaergia prioritize long-term RNG offtake to harvest LCFS and RIN credits.
Technology leadership is shifting toward dry digestion and membrane upgrading. BTS Biogas’s DRANCO line reduces capex per cubic meter of gas by 15% and slashes water use by 70%. Air Liquide’s membrane systems, present in 120 plants worldwide, deliver 98.5% methane purity with 15% lower energy draw than PSA, locking in life-cycle opex savings. Patent filings in upgrading climbed 42% from 2023 to 2025, led by Wärtsilä’s low-energy amine regeneration process that trims costs by EUR 0.012 m⁻³. Compliance with ISO 23043 and EN 16723 is emerging as a barrier to entry, giving incumbents with in-house labs a certification edge.
Organic Biogas Industry Leaders
DMT Environmental Technology
Anaergia Inc.
BTS Biogas SRL
Envitec Biogas AG
PlanET Biogas Group
- *Disclaimer: Major Players sorted in no particular order

Recent Industry Developments
- March 2026: Asterion Industrial Partners completed a EUR 1.5 billion acquisition across Italy and Spain, consolidating 18 biogas plants with a combined capacity of 240 MW under a unified platform. The portfolio targets a 15% internal rate of return (IRR) through digestate valorization and renewable natural gas (RNG) sales within Italy's Guarantee of Origin certificate market, which trades at EUR 8 per megawatt-hour.
- May 2025: Gasum recently inaugurated a new biogas plant in Götene, Sweden, with an investment of EUR 58 million, as part of its strategy to expand the Nordic renewable natural gas (RNG) supply chain. This plant is designed to produce 120 gigawatt hours (GWh) of liquefied biogas annually.
- March 2025: Brazil's "Fuel of the Future" law mandates a 10% reduction in the greenhouse gas intensity of natural gas supplied in the country, starting in 2026, with biomethane playing a key role in achieving this goal.
- January 2025: EnviTec Biogas doubled upgrading capacity at Forst and added 43 GWh output at Friedland after EUR 50 million investment.


Global Organic Biogas Market Report Scope
Organic biogas is a renewable fuel produced through the anaerobic digestion of organic materials, including agricultural waste, manure, food waste, and sewage, by microorganisms in the absence of oxygen. Primarily consisting of methane and carbon dioxide, it serves as a sustainable energy source for cooking, electricity generation, and heating.
The Global Organic Biogas Market is segmented into feedstock, technology, plant scale, application, end-user, and geography. By feedstock, the market is segmented into agricultural residues, animal manure, food and kitchen waste, sewage sludge, industrial organic waste, and energy crops. By technology, the market is segmented into wet anaerobic digestion (wet AD), dry digestion, two-stage systems, and lagoon anaerobic digestion (lagoon AD). By plant scale, the market is segmented into farm-scale, medium-scale, and utility-scale plants. By application, the market is segmented into electricity generation, heat, combined heat and power (CHP), vehicle fuel, pipeline renewable natural gas (RNG), and industrial steam. By end-user, the market is segmented into municipal utilities, agriculture, food and beverage, waste management, and transport distributors. The report also covers the market size and forecasts for the organic biogas market in 20 countries across major regions. For each segment, the market sizing and forecasts have been done on the basis of value (USD).
| Agricultural Residues |
| Animal Manure |
| Food and Kitchen Waste |
| Sewage Sludge |
| Industrial Organic Waste |
| Energy Crops (e.g., maize silage, sorghum) |
| Wet Anaerobic Digestion (CSTR) |
| Dry/High-Solids Digestion |
| Two-Stage/Co-digestion Systems |
| Lagoon/Covered-lagoon AD |
| Farm-scale (Below 250 kW) |
| Medium (250 kW to1 MW) |
| Utility-scale (Above 1 MW) |
| Electricity Generation |
| Heat Only |
| Combined Heat and Power (CHP) |
| Vehicle Fuel (Bio-CNG/Bio-LNG) |
| Pipeline RNG Injection |
| Industrial Steam / Process Heat |
| Municipal Utilities |
| Agriculture and Livestock Farms |
| Food and Beverage Manufacturers |
| Waste-management Companies |
| Transport Fuel Distributors |
| Others |
| North America | United States |
| Canada | |
| Mexico | |
| Europe | United Kingdom |
| Germany | |
| France | |
| Spain | |
| Nordic Countries | |
| Russia | |
| Rest of Europe | |
| Asia-Pacific | China |
| India | |
| Japan | |
| South Korea | |
| ASEAN Countries | |
| Australia and New Zealand | |
| Rest of Asia-Pacific | |
| South America | Brazil |
| Argentina | |
| Colombia | |
| Rest of South America | |
| Middle East and Africa | United Arab Emirates |
| Saudi Arabia | |
| South Africa | |
| Egypt | |
| Rest of Middle East and Africa |
| By Feedstock | Agricultural Residues | |
| Animal Manure | ||
| Food and Kitchen Waste | ||
| Sewage Sludge | ||
| Industrial Organic Waste | ||
| Energy Crops (e.g., maize silage, sorghum) | ||
| By Technology | Wet Anaerobic Digestion (CSTR) | |
| Dry/High-Solids Digestion | ||
| Two-Stage/Co-digestion Systems | ||
| Lagoon/Covered-lagoon AD | ||
| By Plant Scale | Farm-scale (Below 250 kW) | |
| Medium (250 kW to1 MW) | ||
| Utility-scale (Above 1 MW) | ||
| By Application | Electricity Generation | |
| Heat Only | ||
| Combined Heat and Power (CHP) | ||
| Vehicle Fuel (Bio-CNG/Bio-LNG) | ||
| Pipeline RNG Injection | ||
| Industrial Steam / Process Heat | ||
| By End-User Sector | Municipal Utilities | |
| Agriculture and Livestock Farms | ||
| Food and Beverage Manufacturers | ||
| Waste-management Companies | ||
| Transport Fuel Distributors | ||
| Others | ||
| By Geography | North America | United States |
| Canada | ||
| Mexico | ||
| Europe | United Kingdom | |
| Germany | ||
| France | ||
| Spain | ||
| Nordic Countries | ||
| Russia | ||
| Rest of Europe | ||
| Asia-Pacific | China | |
| India | ||
| Japan | ||
| South Korea | ||
| ASEAN Countries | ||
| Australia and New Zealand | ||
| Rest of Asia-Pacific | ||
| South America | Brazil | |
| Argentina | ||
| Colombia | ||
| Rest of South America | ||
| Middle East and Africa | United Arab Emirates | |
| Saudi Arabia | ||
| South Africa | ||
| Egypt | ||
| Rest of Middle East and Africa | ||


Key Questions Answered in the Report
How large is the organic biogas market in 2026?
The organic biogas market size is USD 19.63 billion in 2026, on its way to USD 24.89 billion by 2031.
What is the forecast CAGR for organic biogas through 2031?
Revenue is projected to grow at a 4.85% CAGR from 2026 to 2031.
Which application is growing fastest?
Vehicle fuel, including bio-CNG and bio-LNG, is expanding at 8.4% per year through 2031.
Which region will add capacity most rapidly?
Asia-Pacific leads with 6.4% CAGR, driven by China’s rural biogas push and India’s SATAT program.
What technology is gaining share over traditional wet digestion?
Dry or high-solids anaerobic digestion is growing 7.1% annually thanks to lower water use and modular deployment.
Why is digestate valorisation important?
Monetizing digestate as certified bio-fertilizer could unlock USD 2.8 billion of additional revenue while sequestering carbon in soils.
Page last updated on:


