
Search And Rescue (SAR) Equipment Market Size and Share
Market Overview
| Study Period | 2020 - 2031 |
|---|---|
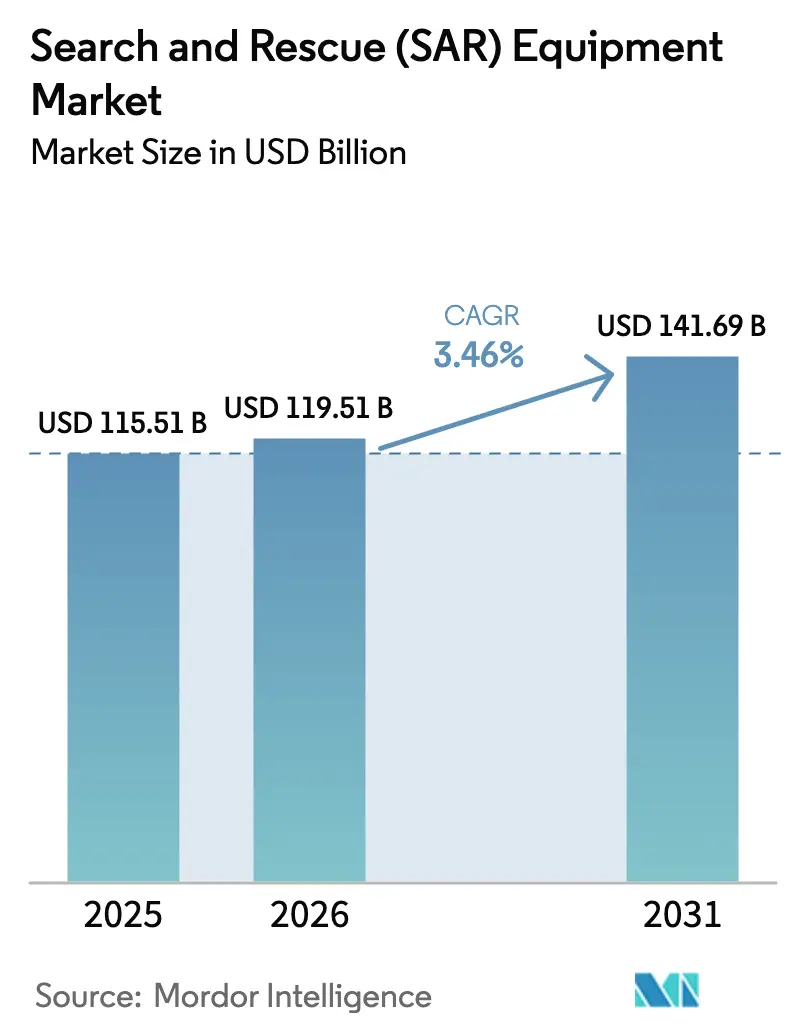
| Market Size (2026) | USD 119.51 Billion |
| Market Size (2031) | USD 141.69 Billion |
| Growth Rate (2026 - 2031) | 3.46 % |
| Fastest Growing Market | Asia Pacific |
| Largest Market | North America |
| Market Concentration | Medium |
Major Players *Disclaimer: Major Players sorted in no particular order Image © Mordor Intelligence. Reuse requires attribution under CC BY 4.0. | |
Search And Rescue (SAR) Equipment Market Analysis by Mordor Intelligence
The search and rescue equipment market size was valued at USD 115.51 billion in 2025 and estimated to grow from USD 119.51 billion in 2026 to reach USD 141.69 billion by 2031, at a CAGR of 3.46% during the forecast period (2026-2031). Escalating climate-driven disasters, the switch to next-generation Cospas-Sarsat beacons, and steady modernization cycles across defense and civilian fleets continue to underpin demand. Autonomous air, surface, and ground platforms linked to LEO-satellite networks are improving mission reach. At the same time, government stimulus, such as Canada’s wildfire-management outlay and the European Union’s rescEU fleet, keeps procurement pipelines active. At the same time, interoperability gaps between analog radios and emerging digital systems pose execution risk, and tighter post-pandemic budgets could slow capital programs in several high-debt economies.
Key Report Takeaways
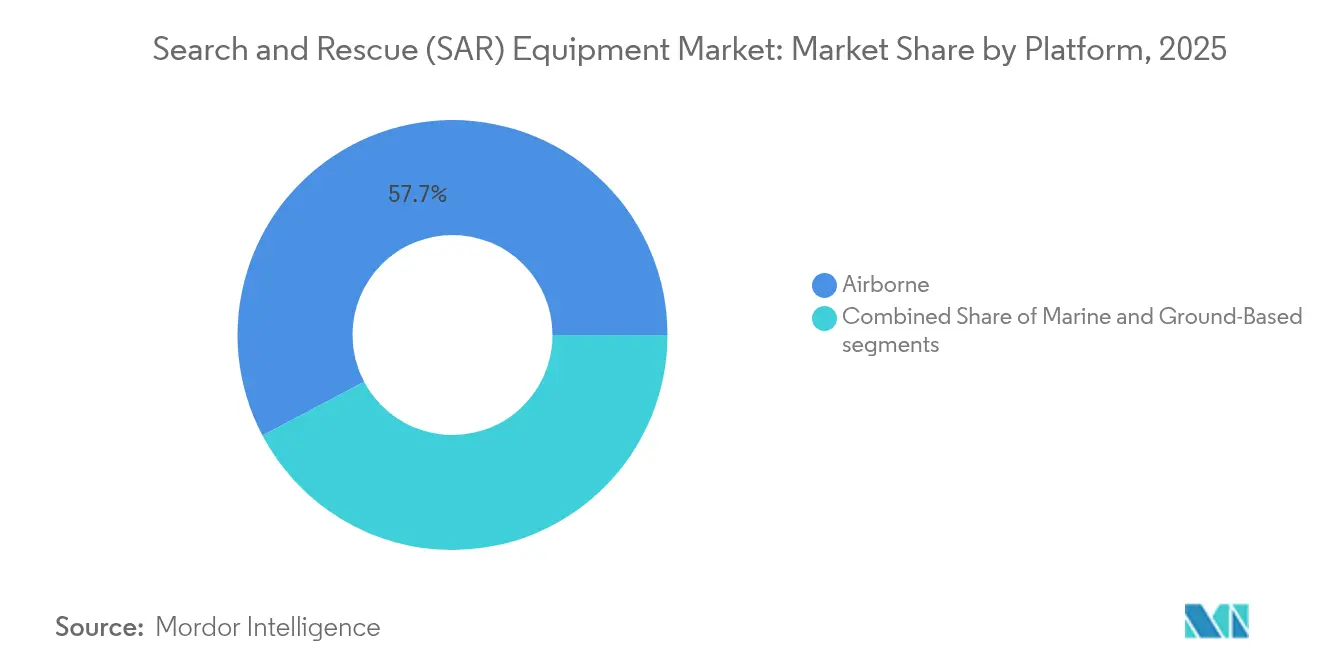
- By platform, airborne systems held 57.74% of the search and rescue equipment market share in 2025, while ground-based systems posted the fastest growth at a 6.05% CAGR through 2031.
- By equipment, communication systems commanded the highest growth profile at 7.12% CAGR, whereas rescue equipment retained 32.10% of the search and rescue equipment market size in 2025.
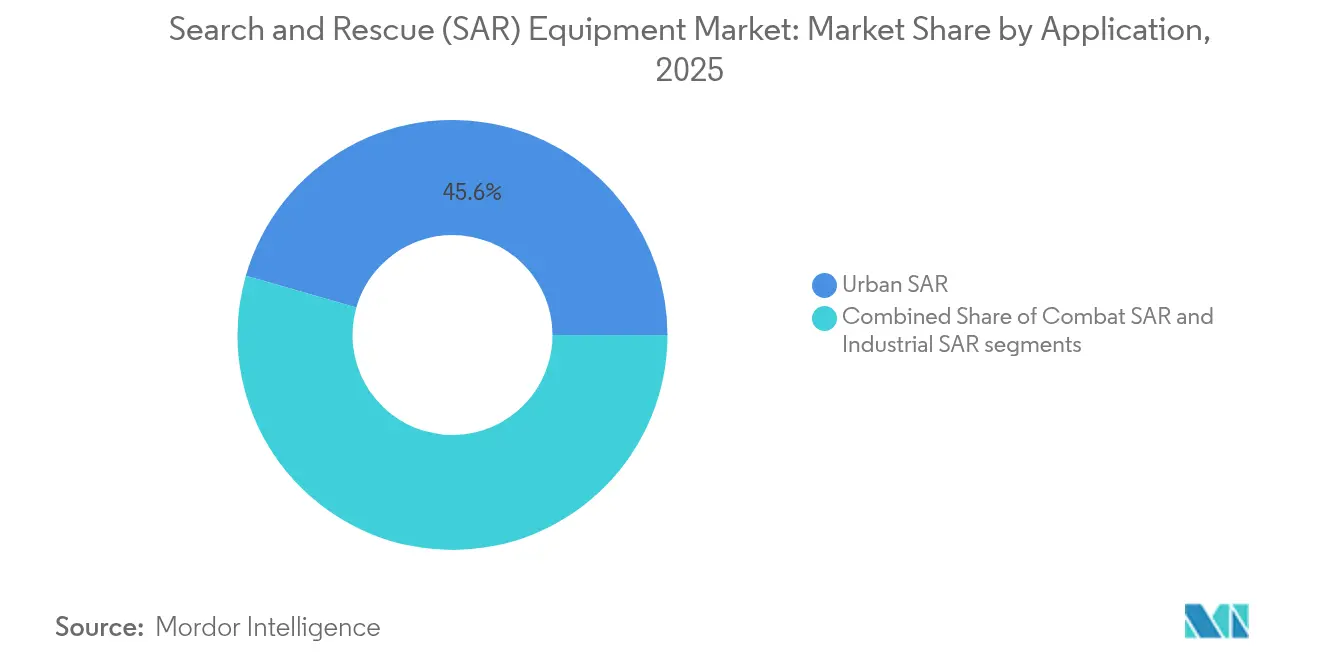
- By application, urban SAR accounted for a 45.55% share in 2025; industrial SAR is projected to expand at a 5.62% CAGR to 2031.
- By end-user, defense and military agencies led with 51.00% revenue share in 2025, while industrial operators are expected to register a 5.66% CAGR through 2031.
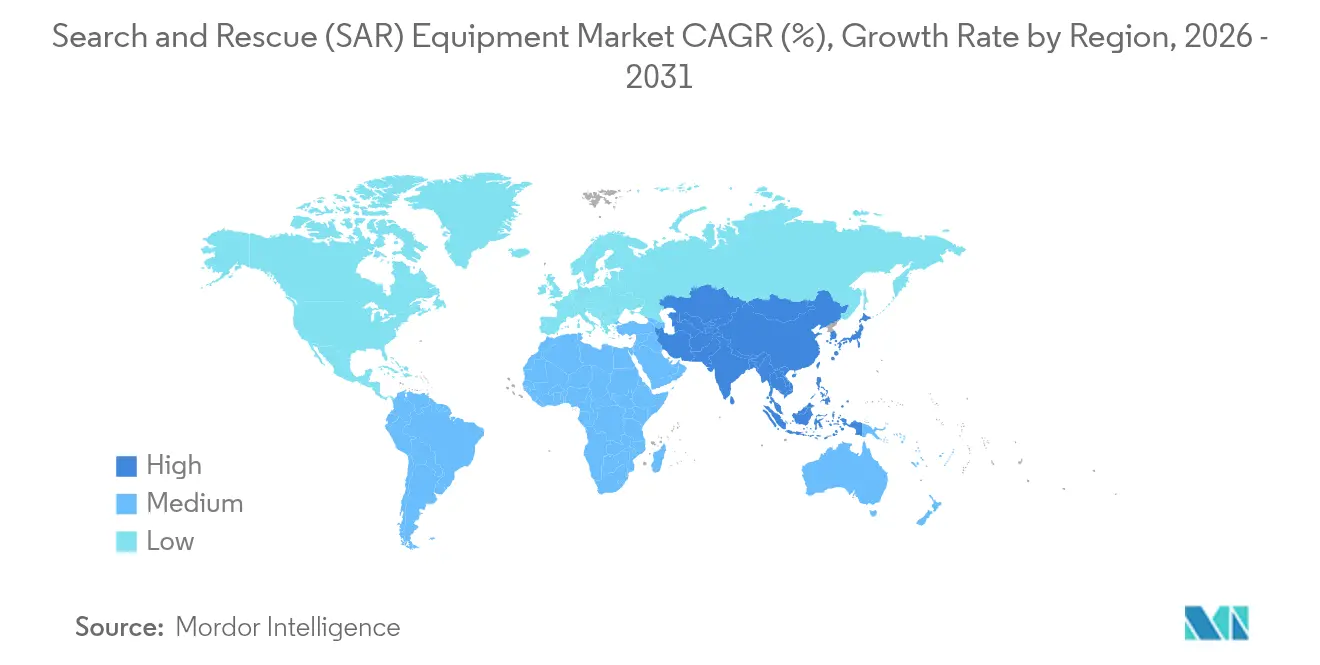
- By geography, North America contributed 38.12% of 2025 revenue; Asia-Pacific is set to grow at a 5.57% CAGR to 2031.
Note: Market size and forecast figures in this report are generated using Mordor Intelligence’s proprietary estimation framework, updated with the latest available data and insights as of 2026.
Global Search And Rescue (SAR) Equipment Market Trends and Insights
Drivers Impact Analysis*
| Driver | (~) % Impact on CAGR Forecast | Geographic Relevance | Impact Timeline |
|---|---|---|---|
| Rising frequency and severity of climate-driven disasters boosting multi-domain SAR procurement | +0.8% | Global, concentrated in North America, Europe, Asia-Pacific coastal regions | Medium term (2-4 years) |
| Proliferation of UAVs and autonomous platforms for wide-area imaging | +0.6% | Global, early adoption in North America and Europe, expanding to Asia-Pacific | Short term (≤ 2 years) |
| LEO-satellite and IoT convergence enabling real-time situational awareness | +0.5% | Global coverage with priority deployment in remote and maritime areas | Medium term (2-4 years) |
| Expansion of offshore energy, remote mining and polar logistics hubs | +0.4% | Arctic routes, offshore energy corridors, remote mining locations worldwide | Long term (≥ 4 years) |
| Mandatory migration to 2nd-generation Cospas-Sarsat MEOSAR beacons | +0.3% | Global maritime and aviation sectors | Short term (≤ 2 years) |
| Global replacement cycle of aging SAR rotorcraft and fixed-wing fleets | +0.4% | North America and Europe primarily, spillover to developed Asia-Pacific markets | Medium term (2-4 years) |
| Source: Mordor Intelligence | |||
Rising frequency and severity of climate-driven disasters boosting multi-domain SAR procurement
Severe weather caused USD 380 billion in global economic losses during 2024, leaving a 69% protection gap in insurance coverage. Governments are responding by shifting funding from post-event relief to proactive capability build-outs. Natural Resources Canada earmarked USD 346.1 million for wildfire equipment and training, and similar commitments appear in FEMA’s USD 33.1 billion FY 2025 budget. More billion-dollar storms heighten the need for multi-domain assets that can deploy rapidly across forests, coasts, and urban centers, moving the search and rescue equipment market toward fleet renewals and higher-technology payloads.
Proliferation of UAVs and autonomous platforms for wide-area imaging
Thermal-equipped drones now deliver 95% precision in human-detection trials, and YOLOv8 inference models allow real-time target confirmation. As defense drone spending scales, cost curves favor civilian SAR agencies adopting “drone-as-a-service” contracting. Mixed fleets, such as the Queensland Police’s Bell 429 helicopters and rotary-wing UAS, illustrate operational optimisation in dense urban terrain.
LEO-satellite and IoT convergence enabling real-time situational awareness
Galileo SAR services achieve 100% detection probability with 99.8% location accuracy within 5 km.[1]Source: International Civil Aviation Organization, “Search and Rescue Workshop Presentation,” icao.int Global GNSS revenue is on track to more than double by 2033, and the Return Link Service now offers distress signal confirmation to survivors. Coupled with Earth observation feeds, responders gain continuous weather, thermal, and traffic updates. Consumer devices such as smartphones and satellite SOS further extend redundancy when terrestrial grids fail.
Expansion of offshore energy, remote mining and polar logistics hubs
New Arctic shipping corridors and offshore rigs are spurring purpose-built capacity. Equinor’s five-year lease of AW 139 helicopters, agent-based SAR time-motion models for the Barents Sea, and national workshop findings on North Atlantic crisis response indicate demand for season-adaptive equipment, polar-rated communications, and multinational coordination protocols.[2]Source: Offshore Magazine, “Equinor Boosts North Sea Search and Rescue Helicopter Fleet,” offshore-mag.com
Restraints Impact Analysis*
| Restraint | (~) % Impact on CAGR Forecast | Geographic Relevance | Impact Timeline |
|---|---|---|---|
| Stringent multi-agency certification (Cospas-Sarsat, IMO, FAA, EASA) | –0.4% | Global, heightened complexity in international operations | Medium term (2-4 years) |
| Scarcity of Certified Training for Urban Robotics SAR Crews | –0.3% | Urban centers worldwide, acute shortages in developing regions | Long term (≥ 4 years) |
| Post-pandemic fiscal tightening delaying capital procurements | –0.2% | Developed economies with high debt-to-GDP ratios | Short term (≤ 2 years) |
| Interoperability gaps between legacy analog radios and next-gen digital/AI systems | –0.3% | Global, with legacy system concentration in established markets | Medium term (2-4 years) |
| Source: Mordor Intelligence | |||
Stringent multi-agency certification requirements
Complying with IMO, FAA, EASA, and Cospas-Sarsat mandates extends product cycles and raises testing costs, particularly for dual-use payloads needing separate military and civilian approvals. The IAMSAR Manual amendments add equipment tracking obligations, and FCC rule changes in 70/80/90 GHz bands require coordination across maritime and aviation domains, reinforcing the barrier for small entrants.
Scarcity of certified training for urban robotics SAR crews
FEMA backs only 28 Type 1 urban search and rescue task forces nationally, while SkillsUSA competitions highlight a global shortfall in technicians able to run drones, ground robots, and AI-enabled sensors. Community-level CERT programs cover basic first aid, but scaling an advanced curriculum to meet next-gen platform complexity remains a long-term challenge to full equipment utilization.
*Our forecasts treat driver/restraint impacts as directional, not additive. The impact forecasts reflect baseline growth, mix effects, and variable interactions.
Segment Analysis
By Platform: Airborne systems anchor the revenue base
Airborne assets generated 57.74% of 2025 revenue, underscoring the search and rescue equipment market’s reliance on helicopters, fixed-wing aircraft, and UAS. Airbus’s RACER demonstrator delivers 400 km/h cruise and 20% fuel-burn gains, widening the mission envelope for high-speed extractions. Fixed-wing models augment range for open-ocean operations, while long-endurance UAS equipped with synthetic-aperture radar fill detection gaps over rough seas. Blended manned-unmanned tasking reduces sortie cycles and directs crewed platforms to confirmed survivor sites.
Ground-based platforms, however, hold the fastest CAGR at 6.05% as urbanisation and industrial corridors demand all-terrain vehicles, robotic crawlers, and wearable exoskeletons for confined-space rescues. Integration with 5G and edge-computing nodes allows near-instant video offload to command posts. The search and rescue equipment market size for ground solutions is expected to climb steadily as cities harden critical infrastructure and private operators mandate on-site response fleets.



By Equipment: Communication systems accelerate digital transition
Migration from VHF analog radios to software-defined, multi-band devices drives a 7.12% CAGR for communication equipment. FCC approval for high-frequency air-to-surface links unlocks gigabit channels for sensor fusion, while MEOSAR readiness deadlines push beacon refresh cycles. In 2025, rescue equipment still led overall revenue at 32.10%, covering stretchers, power cutters, and evacuation kits. Yet, as agencies prioritise real-time data exchange, the market share for communication suites will witness faster growth.
Search sensors benefit from improved uncooled IR arrays, and rescue radars adopt phased-array steering for clutter rejection. Technical equipment—planning, analytics, and 3D mapping software—leverages AI to automate crew-task pairing and stock-level alerts. Other categories capture emerging IoT beacons and autonomous tenders aimed at hazardous-material scenarios, diversifying supplier opportunities within the broader search and rescue equipment industry.
By Application: Industrial settings outpace broader growth
Urban SAR maintained leadership with 45.55% revenue in 2025, yet industrial SAR posts a 5.62% CAGR as offshore wind, deep-water hydrocarbons, and remote mineral assets demand dedicated coverage. Operators increasingly fund self-contained platforms, citing regulator pressure to shorten response times where government assets are distant. Therefore, the search and rescue equipment market size for industrial use is forecasted to expand more quickly than the combat or maritime public-safety segments.
Combat SAR remains strategically important for defense ministries upgrading night vision, counter-UAS, and electronic warfare suites. Urban environments gravitate toward robotics, thermal imaging, and multiband comms to manage high-rise extractions and tunnel incidents. Each application vertical feeds specialised payload road maps inside the overarching search and rescue equipment market.
By End-User: Industrial operators step up procurement
Defense and military agencies accounted for 51.00% of 2025 sales, but industrial operators—oil, gas, mining, and offshore wind—are on a 5.66% CAGR trajectory as they invest in self-reliant fleets. Dual-use supply chains allow contractors to repurpose military-grade avionics for civilian rigs, aligning with sustainability mandates and insurer expectations. Public-safety departments continue to benefit from FEMA grants and regional cost-share schemes, though capital pacing may soften under fiscal tightening.
Cross-sector convergence is rising: defense prime RTX Corporation fields hyperspectral sensors adaptable for commercial pipeline monitoring, while private energy majors lease spare rotorcraft time to coastal guard units during low-demand windows. Such partnerships expand addressable revenue without overextending public budgets, strengthening resilience across the search and rescue equipment market.
Geography Analysis
North America controlled 38.12% of 2025 turnover, anchored by FEMA’s USD 33.1 billion fiscal-year budget and sustained Coast Guard, Air Force, and state wildfire outlays. The region’s integrated aerospace-industrial base accelerates the fielding of hybrid-electric propulsion, polar hardening kits, and cloud-based command software, keeping the search and rescue equipment market ahead in capability.
Europe maintains a sizable share through rescEU pooled assets and Galileo’s mature SAR payload. Joint procurement drives volume discounts, while Arctic member states channel funds into ice-class hulls and long-range drones. Europe’s regulatory emphasis on green aviation also nudges suppliers to develop biofuel-compatible engines and recyclable composite structures.
Asia-Pacific is the fastest-growing theatre at 5.57% CAGR. Rapid coastal urbanisation, frequent typhoons, and seismic hazards force governments to upscale inventories—from Japan’s satellite-enabled command upgrade to Australia’s Disaster Ready Fund. Industrial SAR revenues grow as LNG carriers, offshore rigs, and mountain mining sites purchase bespoke kits. Cross-border disaster-relief exercises foster doctrine convergence and shore up regional demand for interoperable systems.

Regulatory Landscape
The SAR equipment regulatory environment is shaped by overlapping maritime, aviation, and spectrum regimes that affect beaconing, communications, and detection payloads. For maritime distress locating, IMO Resolution MSC.510(105) defines technical characteristics for 9 GHz search and rescue transponders (SART), while aviation and outdoor rescue users of personal locator beacons operate under national radio rules such as the FCC framework for PLBs (47 CFR 95.2987), which ties certification to RTCM standards and independent test validation.
In Europe, radio and sensor deployments are influenced by harmonized standards and national interface specifications, including ETSI EN 303 661 for Ground Based Synthetic Aperture Radar (GBSAR) frequency usage, with implementation and harmonization timelines extending through 2026. Germanys Federal Network Agency also publishes interface specifications governing emergency beacon radio parameters, including 121.5 MHz and 406 MHz use cases, creating compliance checkpoints for suppliers selling into multiple jurisdictions and for operators running cross-border SAR missions.
Value Chain Analysis
The SAR equipment value chain starts with mission requirements definition and procurement by defense ministries, coast guards, public safety agencies, and industrial operators. It then moves through platform and subsystem OEMs (including airframes, radios, sensors, beacons, winches/hoists, and command-and-control software), followed by certification and test services, and finally fielding through integrators, training providers, and MRO organizations that sustain readiness. Certification dependencies across IMO and aviation authorities, along with radio approvals, increase the role of test labs and compliance specialists earlier in the chain as programs migrate toward next-generation Cospas-Sarsat beacons. At the same time, multi-band communications and radar payloads raise system-level integration effort.
Upstream constraints for high-end electronics, including semiconductors and specialized transmit-receive modules used in radar and advanced communications, can drive schedule risks and lead primes and tier suppliers toward longer-lead procurement and dual sourcing. Downstream, service-led models are expanding, with public-private operating arrangements and long-term maintenance contracts becoming central to lifecycle economics; for example, Leonardo and Heli-One extended support for Norways AW101 SAR fleet through 2030, reinforcing how MRO capacity and spares provisioning increasingly anchor total program value beyond initial equipment delivery.
Competitive Landscape
The market shows moderate concentration: top defense conglomerates combine airframes, sensors, and networking software into turnkey packages, yet category fragmentation leaves room for niche innovators. RTX Corporation’s USD 218 billion backlog and USD 10.3 billion annual R&D spend exemplify scale advantages. Airbus leverages rotorcraft speed records to secure high-altitude, long-range tenders, whereas Leonardo fields AW 139 variants tailored for offshore leases like Equinor’s North Sea program.
Technology trends emphasise open-architecture avionics, AI-assisted mission planning, and modular payload bays. Established players partner with software start-ups for computer-vision triage tools or sat-com operators for resilient L-band connectivity. New entrants focus on swarm-capable micro-UAS, low-SWaP sensors, and cloud-native command dashboards, gradually eroding incumbent share in subsystem niches.
Industrial operators increasingly procure directly, squeezing margins for intermediaries but providing specialist vendors a foothold. Meanwhile, governments push domestic content rules, which could reshape sourcing for foreign primes and invite joint-venture assembly lines. Over time, strategic manoeuvring will hinge on accelerating certification cycles and bundling training solutions to close skill gaps.
Search And Rescue (SAR) Equipment Industry Leaders
RTX Corporation
Thales Group
Honeywell International, Inc.
Leonardo S.p.A.
Textron Inc.
- *Disclaimer: Major Players sorted in no particular order


Market Opportunities and Future Outlook
Commercialization and contracting-out of SAR services create whitespace for operators and OEMs to bundle aircraft, mission kits, and availability-based support into multi-year commitments. The UKs UKSAR2G program, cited at GBP 1.6 billion in industry reporting around Bristow, shows how government demand can be met through contracted operations, shifting buying criteria toward dispatch reliability, training, and integrated communications rather than standalone hardware procurement.
Fleet modernization and mission-kit upgrades also support additional opportunity in medium-lift helicopters and their subsystems, including hoists, lighting, sensors, and secure communications, alongside long-duration support packages. In June 2026, Leonardo disclosed an order from Avincis for 15 helicopters (AW169 and AW139) to expand emergency medical services and search and rescue in Europe, and in February 2026 Leonardo selected the Pegasus rescue hoist for AW139, indicating continued investment in mission-critical lift and recovery equipment. On the technology side, standards-driven radio compliance and European harmonization work, including ETSI EN 303 661 through 2026, highlight demand for suppliers that can deliver certified, interoperable payloads across jurisdictions, especially where mixed analog-digital fleets still operate.
Recent Industry Developments
- July 2026: Thales announced a new high-power LED Search and Landing Light (SLL) system for SAR missions, with software-defined architecture and flush-mounted integration. The development expands night-time SAR capability and supports easier sensor integration across platforms. This strengthens Thales' position in mission-critical SAR hardware and supports broader platform retrofit opportunities.
- June 2026: Leonardo announced an order from Avincis for 15 helicopters (10 AW169 and 5 AW139) to support SAR and medical service expansion in Europe, deliveries 2028-2031. The expansion of the medium-lift SAR helicopter fleet in Europe shows continued demand for versatile airborne capabilities in civilian and defense contexts. The agreement secures Leonardo's long term maintenance pipelines and boosts its European SAR footprint.
- February 2026: Leonardo selected the Pegasus next-generation rescue hoist from Onboard Systems for the AW139 platform to improve reliability and operational capability. The upgrade enhances rescue operations and enables multi mission SAR deployments on the platform. The choice reinforces Leonardo's ecosystem with a modern hoist supplier and retrofit opportunities.


Research Methodology Framework and Report Scope
Market Definition and Coverage
This market covers the revenue generated from equipment used to locate, communicate with, and safely recover people in distress across land, sea, and air operations. We count the sale of dedicated SAR hardware and systems used by public safety, defense, and industrial response teams.
Scope exclusions: We exclude general-purpose PPE and routine medical consumables that are not procured or used primarily for search and rescue missions.
Segmentation Overview
- By Platform
- Airborne
- Helicopters
- Fixed-Wing Aircraft
- Unmanned Aerial Vehicles (UAVs)
- Marine
- Ground-Based
- Airborne
- By Equipment
- Rescue Equipment
- Power Rescue Tools
- Medical and Evacuation Kits
- Search Equipment
- Thermal / IR Sensors
- Rescue Radars
- Communication Equipment
- SATCOM Terminals
- Software-Defined Radios
- Technical Equipment
- Planning and Command Systems
- Other Equipment
- Rescue Equipment
- By Application
- Combat SAR
- Urban SAR
- Industrial SAR
- By End-User
- Defense and Military Agencies
- Public Safety and Law-Enforcement
- Industrial Operators
- By Geography
- North America
- United States
- Canada
- Mexico
- Europe
- United Kingdom
- Germany
- France
- Italy
- Russia
- Rest of Europe
- Asia-Pacific
- China
- India
- Japan
- South Korea
- Rest of Asia-Pacific
- South America
- Brazil
- Argentina
- Rest of South America
- Middle East and Africa
- Middle East
- Saudi Arabia
- United Arab Emirates
- Israel
- Rest of Middle East
- Africa
- South Africa
- Rest of Africa
- Middle East
- North America
Data Sources, Market Sizing, and Validation
Desk Research
We begin by organizing what is measurable in the public domain, then mapping those items to SAR use cases so the model does not drift into broader safety or defense spending. Key inputs are pulled from official datasets and standards bodies, such as NOAA for weather and storm impacts, FEMA for disaster response programs, the US Coast Guard for SAR mission reporting, ICAO and IMO guidance for aviation and maritime safety requirements, and the Cospas-Sarsat program for beacon and alerting ecosystem updates.
After that, we review demand and supply signals that help size addressable spending, including government budget documents and procurement notices, company annual reports and investor presentations, reputable press releases on fleet upgrades, and peer-reviewed journals that discuss rescue communications, detection, and survivability equipment performance. Where helpful, we use paid subscription sources covering company financials and global contracts and tenders, to standardize supplier revenue splits and confirm program timing. The desk sources listed here are illustrative only, and we also used additional references to collect data, validate assumptions, and clarify unclear points.
Primary Interviews and Surveys
Primary work is used to pressure-test what desk sources cannot fully show, mainly the share of equipment revenue that is truly SAR-led versus adjacent safety spending. We spoke with and surveyed procurement and operations stakeholders across defense, coast guard and maritime services, emergency management, and industrial response teams. We then rechecked assumptions by region, since mission mix and replacement cycles differ by theater and procurement cadence.
Distribution of primary research fieldwork respondents
| Company type | Respondent position | Region |
|---|---|---|
| Top tier: 30% | CXOs: 17% | APAC: 52% |
| Mid tier: 53% | Functional/Unit leaders: 24% | EMEA: 29% |
| Smaller Players: 17% | Managers: 59% | Americas: 19% |
Market-Sizing & Forecasting
The model starts with a top-down build where incident exposure and preparedness spending are translated into an addressable demand pool by platform, then adjusted using adoption and replacement patterns reported by users. To keep the numbers grounded, we corroborate with selective bottom-up checks, including sampled supplier revenue splits, program-level procurement timing, and volume-by-ASP cross-checks for common SAR equipment baskets.
Inputs used in the sizing include disaster frequency and severity indicators, active fleet and asset counts for SAR-capable platforms, beacon and emergency-communication upgrade cycles (including satellite alerting transitions), training and readiness spending signals, and typical refurbishment or replacement intervals for mission equipment. Forecasts lean on scenario analysis, where baseline, conservative, and accelerated procurement paths are tied back to budget visibility and operational priorities confirmed in interviews. When bottom-up data is incomplete for smaller suppliers, we fill gaps using peer revenue ratios and tender density, then normalize totals so they remain consistent with observable demand indicators.
Data Validation & Update Cycle
Outputs are validated through triangulation across independent signals. We check the modeled spend against procurement activity, mission intensity trends, and supplier-side revenue direction. Any sharp swings are reviewed by analysts for drivers such as one-off disaster years, delayed delivery schedules, or currency translation effects, and then assumptions are revisited with follow-up calls when needed.
Before sign-off, the work goes through multi-step internal review, including variance checks at regional and platform levels, plus consistency checks against historical patterns. Reports are refreshed annually, with interim updates triggered when material events occur, such as large procurement awards, regulation changes affecting mandated equipment, or major shifts in disaster response funding. Right before delivery, a final review pass is completed so clients receive the most current view available.
Mordor Intelligence's Search and Rescue Equipment Market Estimate Compared With Other Published Estimates
Different published numbers can look far apart in this market because the line between SAR equipment and wider safety, emergency medical, and defense gear is not always drawn the same way. We see gaps most often when studies apply a broad equipment basket, assume uniform replacement timing, or convert currencies using different base-year averages.
The main gap comes from mixing general emergency response equipment into SAR demand. Mordor Intelligence counts revenue only when the equipment is procured for search, detection, rescue, or mission-critical SAR communications, and not for routine safety stock or non-SAR medical consumables.
Benchmark comparison
| Source | Market Size | Gaps in Research Methodology |
|---|---|---|
| Mordor Intelligence | USD 115.51 B (2025) | |
| Global Consultancy A | USD 98.40 B (2025) | Uses a narrower scope centered on rescue and recovery gear, and it appears to undercount search, detection, and SAR communications systems, which reduces the addressable spend pool. |
| Industry Association B | USD 132.20 B (2025) | Expands scope into broader emergency response and safety equipment spending, and it applies aggressive refresh assumptions that lift annual replacement demand beyond typical SAR upgrade cycles. |
Taken together, the spread mainly reflects what is counted as SAR-specific equipment and how replacement cycles are treated in the base year. Our approach stays traceable to observable demand signals, and it is repeatable because each adjustment is tied back to mission use, procurement timing, and validation feedback from end users.


Key Questions Answered in the Report
What is the current value of the search and rescue equipment market?
The market is valued at USD 119.51 billion in 2026 and is forecasted to grow to USD 141.69 billion by 2031 at a 3.46% CAGR.
Which platform segment leads the market?
Airborne systems dominated with 57.74% revenue share in 2025, reflecting the mission flexibility of helicopters, fixed-wing aircraft and UAS.
Why are communication systems the fastest-growing equipment category?
Agencies are replacing analog radios with multi-band, software-defined devices to support AI and satellite data streams, giving the segment a 7.12% CAGR.
Which region is expanding quickest?
Asia-Pacific posts the fastest regional growth as coastal development, frequent natural disasters and defense upgrades drive procurement.
How are industrial operators influencing demand?
Offshore energy, mining and polar logistics companies are investing in self-contained fleets, making industrial operators the fastest-growing end-user group.
What is the biggest restraint on market growth?
Complex, multi-agency certification processes lengthen development timelines and raise costs, particularly for new entrants making dual-use equipment.
Page last updated on:





