
Market Overview
| Study Period | 2021 - 2031 |
|---|---|
| Market Size (2026) | USD 272.22 Billion |
| Market Size (2031) | USD 361.64 Billion |
| Growth Rate (2026 - 2031) | 5.85 % |
| Fastest Growing Market | Asia Pacific |
| Largest Market | North America |
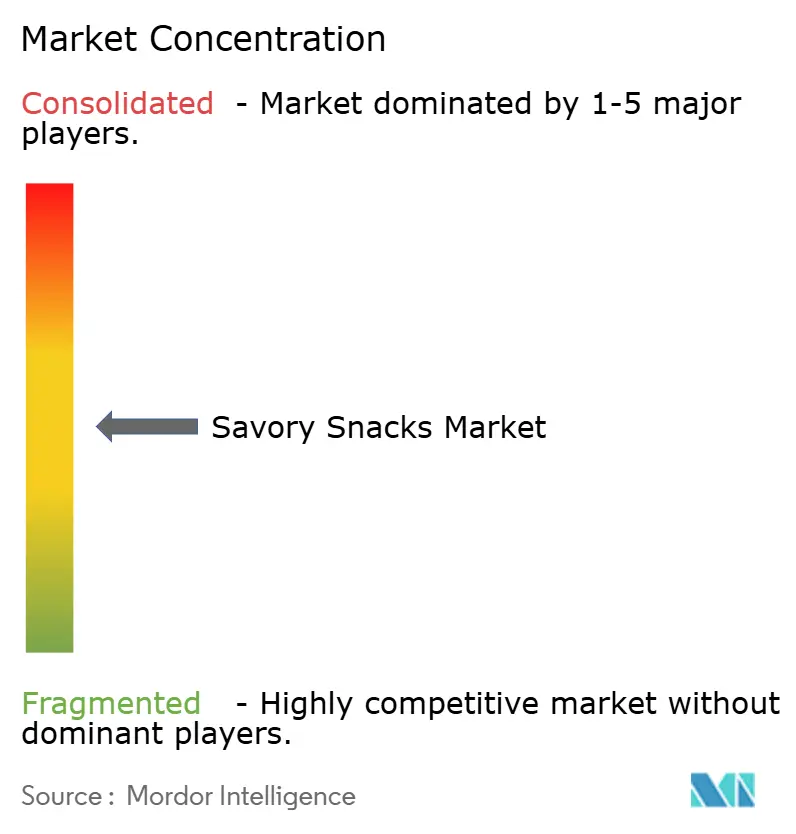
| Market Concentration | Medium |
Major Players
*Disclaimer: Major Players sorted in no particular order Image © Mordor Intelligence. Reuse requires attribution under CC BY 4.0. |
|
Savory Snacks Market Analysis by Mordor Intelligence
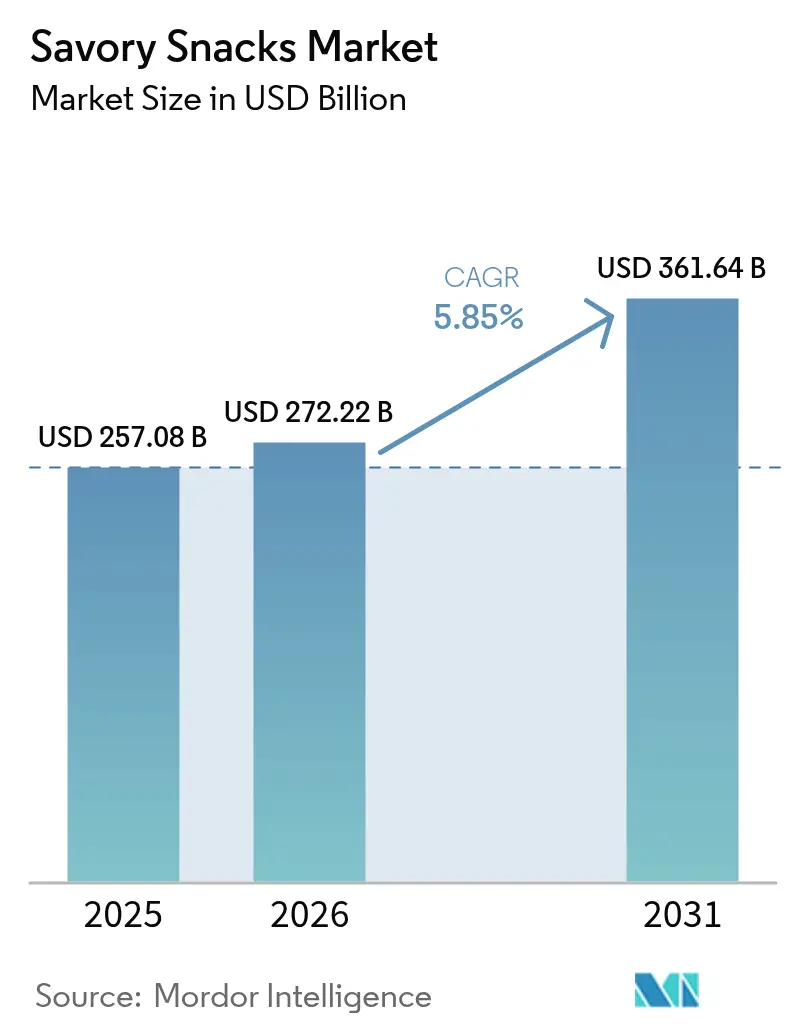
The savory snacks market size was valued at USD 257.08 billion in 2025 and estimated to grow from USD 272.22 billion in 2026 to reach USD 361.64 billion by 2031, at a CAGR of 5.85% through 2031. Momentum is building as consumers redirect discretionary spending toward convenient, indulgent, yet increasingly health-forward eating moments that blur mealtime boundaries. Elevated demand for protein-dense nuts and seed mixes, the widening influence of clean-label claims, and the rapid adoption of online grocery all reinforce the premiumization trajectory that underpins value growth. Incumbent brands are refreshing portfolios through acquisitions, fortified formulations, and AI-enabled flavor launches, while regional specialists defend share through localized tastes and agile direct-to-consumer models. Although input-cost volatility and evolving sodium caps tighten margins, investment in resilient supply chains and salt-reduction technologies is helping manufacturers protect profitability.
Key Report Takeaways
- By product type, chips and crisp-based snacks led with 38.32% of global savory snacks market share in 2025, whereas nuts, seeds, and trail mixes are forecast to expand at a 6.93% CAGR through 2031.
- By flavor profile, flavored variants captured 75.17% of the savory snacks market size in 2025 and are progressing at a 6.66% CAGR to 2031.
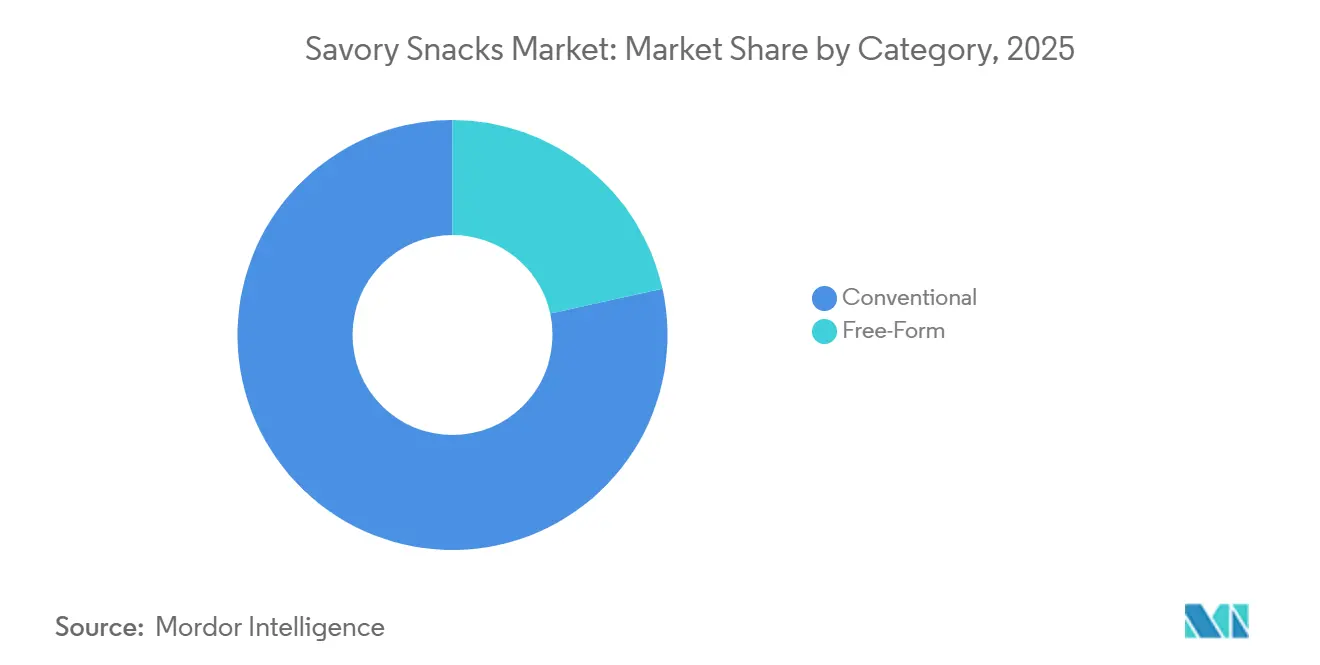
- By category, conventional products controlled 78.46% of 2025 revenue, while free-form snacks are advancing at a 7.52% CAGR over 2026-2031.
- By distribution channel, supermarkets and hypermarkets held 53.95% share in 2025; online retail stores are accelerating at an 11.34% CAGR to 2031.
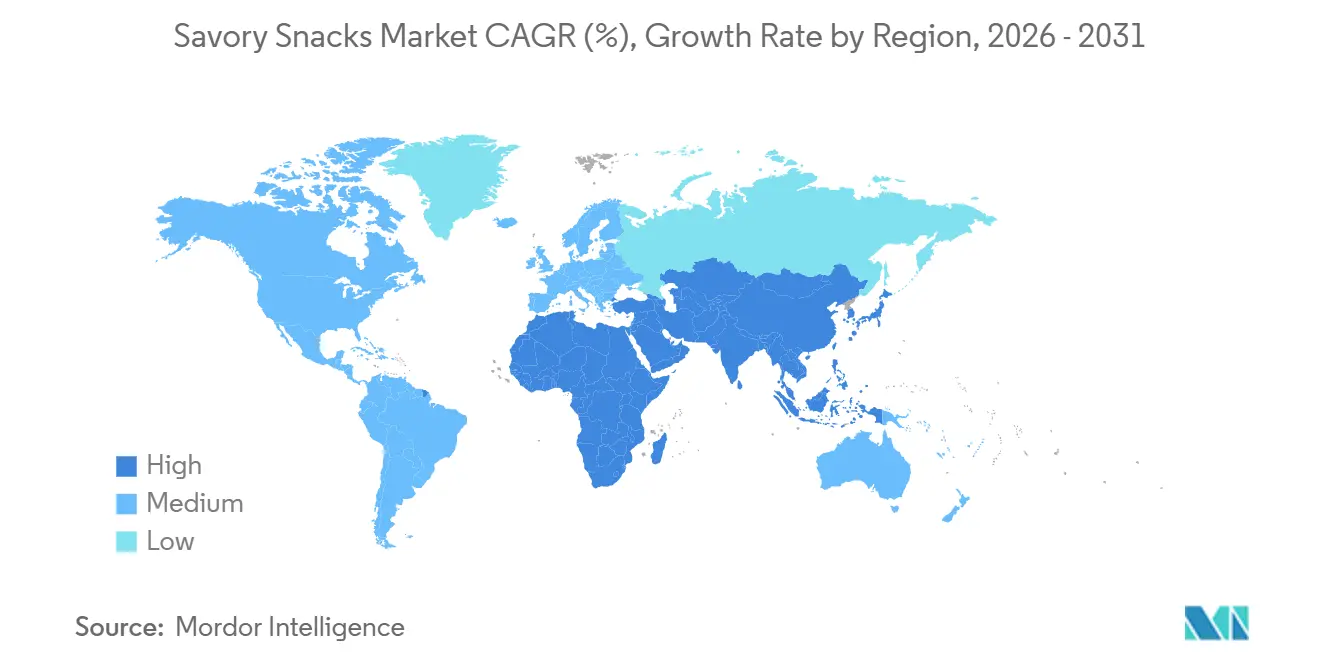
- By geography, North America retained 38.74% of 2025 revenue, whereas Asia-Pacific represents the fastest-growing region with a 7.83% CAGR through 2031.
Note: Market size and forecast figures in this report are generated using Mordor Intelligence’s proprietary estimation framework, updated with the latest available data and insights as of 2026.
Market Trends and Insights
Drivers Impact Table of Savory Snacks Market*
| DRIVER | (~) % IMPACT ON CAGR FORECAST | GEOGRAPHIC RELEVANCE | IMPACT TIMELINE |
|---|---|---|---|
| Changing consumer lifestyles and snacking habits | +1.2% | Global, with pronounced effects in North America, Asia-Pacific, and Europe | Short term (≤ 2 years) |
| Health-driven demand for functional and fortified snacks | +1.0% | Global, strongest in North America and Europe | Medium term (2-4 years) |
| Premiumization and artisanal formats | +0.8% | North America, Europe, urban centers in Asia-Pacific | Medium term (2-4 years) |
| Online and omni-channel retail expansion | +1.5% | Global, accelerating in Asia-Pacific, North America, and South America | Short term (≤ 2 years) |
| AI-driven flavor customization and micro-batch production | +0.6% | North America, Asia-Pacific, early adoption in Europe | Medium term (2-4 years) |
| Upcycling food-waste streams for protein-rich inputs | +0.4% | Europe, North America, emerging in Asia-Pacific | Long term (≥ 4 years) |
| Source: Mordor Intelligence | |||
Changing consumer lifestyles and snacking habits
Snacking occasions now account for more than major part of daily eating events in the United States, displacing structured meals as work-from-home arrangements and flexible schedules erode traditional breakfast, lunch, and dinner boundaries. A 2025 Mondelez survey revealed that consumers are placing greater emphasis on the social aspect of snacking, with 64% regularly snacking to connect with others, an 8% increase from the previous year[1]Source: Mondelez International, "Mondelēz International State of Snacking Survey", mondelezinternational.com. Millennials and Gen Z favor small, flavor-packed portions that fit around varied routines, propelling savory snacks market penetration in single-serve and family-share packs alike. Urbanization across Mumbai, Jakarta, and Manila shortens meal windows, boosting reliance on packaged snacks that deliver crunch, umami, and satiety on the go. Household stocking of resealable pouches is rising as late-night “fourth-meal” occasions emerge, reinforcing repeat purchase. Manufacturers therefore bundle multipacks and flavor variety cartons to capture incremental consumption across dayparts.
Health-driven demand for functional and fortified snacks
Shoppers increasingly treat snacks as nutrition carriers, seeking protein, fiber, probiotics, and omega-3 claims previously reserved for health aisles. A Cargill's 2025 Protein Profile survey indicates that 61% of consumers plan to increase their protein intake in 2024, compared to 48% in 2019 across North America[2]Source: Cargill Incorporated, "The 2025 Protein Profile," cargill.com. Also, PepsiCo’s USD 1.2 billion acquisition of Siete Foods injected grain-free, cassava-based tortilla chips into Frito-Lay’s mainstream network, illustrating how fortified propositions scale rapidly when paired with strong distribution. Pulse-based crackers now deliver 8–10 g protein per serving, challenging protein bars for gym-bag real estate. Probiotic-enhanced extruded snacks survive high heat with spore-forming strains, linking gut health with indulgence. In Europe, the Novel Foods framework gives larger firms an advantage, as clinical-study budgets and dossier expertise create hurdles for start-ups
Premiumization and artisanal formats
Functional claims: protein fortification, added fiber, probiotics, omega-3 fatty acids are migrating from niche health-food aisles into mainstream savory-snack portfolios as consumers seek nutritional density without sacrificing taste. As of April 2025, the International Monetary Fund reported global disposable incomes at USD 206.88 thousand per capita, enabling these consumers to spend more on snacks, emphasizing quality, authenticity, and creativity. Shoppers pay for perceived authenticity, traceable sourcing, and novel textures, fueling a savory snacks market shift toward higher price tiers. Challenger brands such as Jackson’s and Lesser Evil brandish non-GMO, regenerative-agriculture claims that resonate with eco-aware households, forcing global leaders to launch premium sub-lines or execute bolt-on deals. In Asia-Pacific, imported United States and Japanese chips command premium shelf prices in Tier-1 Chinese cities, merging aspirational branding with trusted food-safety standards
Online and omni-channel retail expansion
Food and beverage e-commerce penetration has surged across developed markets, and the savory snacks market is growing even faster online because products are lightweight, non-perishable, and highly gift-able. Online Retail Stores are projected to grow at 11.34% CAGR through 2031, the fastest among distribution channels, as platforms such as Amazon Fresh, Instacart, and Alibaba's Tmall integrate snacks into grocery delivery and quick-commerce services. Subscription models exemplified by SnackCrate, Universal Yums, and Graze are converting one-time buyers into recurring revenue streams by curating international and niche products that physical retailers cannot economically stock. In Asia-Pacific, quick-commerce platforms such as Blinkit in India and GrabMart in Southeast Asia are delivering snacks within 10 to 15 minutes, creating a new competitive front where speed and convenience trump price.
Restraints Impact Analysis of Savory Snacks Market*
| RESTRAINT | (~) % IMPACT ON CAGR FORECAST | GEOGRAPHIC RELEVANCE | IMPACT TIMELINE |
|---|---|---|---|
| Stricter sodium-reduction mandates redefining recipe reformulations | -0.5% | North America, Europe, early adoption in Asia-Pacific | Short term (≤ 2 years) |
| Crop and supply-chain disruptions elevating input costs | -0.7% | Global, most acute in North America, Europe, and Asia-Pacific | Short term (≤ 2 years) |
| Intensifying competition from protein bars and meal-replacements | -0.4% | North America, Europe, urban centers in Asia-Pacific | Medium term (2-4 years) |
| ESG scrutiny of palm and seed-oil supply chains | -0.3% | Global, regulatory pressure strongest in Europe | Medium term (2-4 years) |
| Source: Mordor Intelligence | |||
Stricter sodium-reduction mandates redefining recipe reformulations
The United States Food and Drug Administration's voluntary sodium-reduction targets, finalized in Phase II guidance in 2024, set category-specific limits that require chips and crisps to reduce sodium to 2,300 milligrams per Reference Amount Customarily Consumed by 2026, a 15% reduction from 2020 baselines. Replacing sodium chloride with potassium chloride adds bitter notes and lifts recipe cost 20–30%. Manufacturers are investing in salt-enhancing technologies microencapsulation, crystal-size optimization, and topical application that deliver equivalent saltiness with 25% less sodium, but these processes require capital expenditure on new coating equipment and reformulation trials. Consumer acceptance remains a risk: blind taste tests show that sodium reductions above 20% trigger noticeable flavor deficits, potentially eroding brand loyalty and driving consumers toward unregulated imported products.
Crop and supply-chain disruptions elevating input costs
Potato and corn prices spiked 25% to 35% in 2024 and 2025 due to drought in the United States Midwest, flooding in India's Punjab region, and geopolitical tensions disrupting Black Sea grain exports[3]Source: USDA, "Agricultural Prices", usda.gov. These disruptions compressed gross margins for snack manufacturers, many of whom operate on 10% to 15% EBITDA margins and lack pricing power to pass full cost increases to retailers. n response, manufacturers are diversifying sourcing geographies, signing multi-year contracts with growers, and investing in agronomic partnerships that guarantee supply at fixed prices. PepsiCo's Sustainable Farming Program, which covers 100,000 acres in North America, provides seeds, irrigation technology, and crop insurance to contracted farmers, reducing supply volatility while lowering carbon intensity. Smaller manufacturers lacking scale struggle to secure specialty chipping cultivars, exposing them to spot-market volatility.
*Our forecasts treat driver/restraint impacts as directional, not additive. The impact forecasts reflect baseline growth, mix effects, and variable interactions.
Savory Snacks Market Segment Analysis
By Product Type:
Protein-Dense Formats Outpace Traditional ChipsChips and crisp-based snacks captured 38.32% of 2025 revenue, anchored by potato chips, tortilla chips, and corn crisps that headline retail end-caps worldwide. Potato chips continue to dominate impulse bays in North America and Europe, but pulse-based chips using lentils and black beans gain shelf space in natural retailers as gluten-free alternatives. Seaweed crisps gain popularity in Japan and coastal cities of the United States, leveraging their low-calorie and umami-rich appeal. These snacks are increasingly favored by health-conscious consumers seeking nutritious alternatives to traditional chips.
The savory snacks market segment comprising nuts, seeds, and trail mixes is anticipated to grow at a CAGR of 6.93% through 2031, representing the fastest growth among product types. This growth is driven by increasing consumer demand for healthier snack options that offer both nutritional benefits and convenience. Consumers are increasingly opting for almonds, cashews, and chickpea clusters due to their protein content of 5–10 grams per serving and minimal ingredient processing. Additionally, the rising awareness of plant-based diets and the preference for snacks with clean labels and natural ingredients are further contributing to the expansion of this market segment.




By Flavor Profile:
Flavored Variants Dominate Through Regional CustomizationFlavored variants accounted for 75.17% of the projected 2025 revenue and are growing at a CAGR of 6.66%, significantly outpacing classic salted products. Popular flavors such as spicy jalapeño, Korean BBQ, and Sichuan peppercorn are complemented by hybrid offerings, updated quarterly based on AI-driven predictions. These hybrid flavors are designed to cater to evolving consumer preferences, blending traditional tastes with innovative combinations. Limited-edition releases leverage digital marketing strategies, with influencers promoting new flavors through unboxing videos and social media campaigns. These promotions often generate significant consumer interest, leading to rapid sell-outs and reinforcing brand visibility.
Classic salted or lightly salted chips primarily function as cost-effective SKUs in private-label programs and foodservice bulk offerings, but their growth remains modest due to constraints imposed by sodium-reduction targets. These targets limit the ability to reformulate products while maintaining their traditional taste profiles. To revitalize plain chip formats, brands are incorporating cues such as “mineral-rich sea salt” or “pink Himalayan salt,” which offer perceived health benefits while staying within acceptable seasoning levels. These strategies aim to appeal to health-conscious consumers who seek simpler ingredient lists without compromising on flavor.
By Category:
Free-Form Surges on Clean-Label and Allergen-Free ClaimsConventional savory snacks accounted for 78.46% of 2025 revenue, encompassing standard formulations that use wheat, dairy, artificial flavors, and preservatives to optimize cost, shelf life, and mass-market appeal. These products dominate value packs, club stores, and vending machines where price per ounce is the primary purchase driver. Manufacturers are reformulating conventional lines to remove artificial colors, flavors, and preservatives, a strategy exemplified by PepsiCo's Simply brand and Kellanova's commitment to eliminate artificial ingredients from North American snacks by 2025.
Free-Form products spanning gluten-free, organic, non-GMO, vegan, and allergen-free claims are expanding at 7.52% CAGR from 2026 to 2031, the fastest rate among category splits, as health-conscious consumers prioritize ingredient transparency and dietary restrictions. Gluten-free snacks appeal to celiac sufferers and the broader wellness community that associates gluten avoidance with digestive health. Organic certification, governed by USDA National Organic Program standards in the United States and EU Organic Regulation in Europe, commands price premiums by guaranteeing pesticide-free ingredients and non-GMO sourcing. Free-form brands such as Siete, Lesser Evil, and Hippeas have built loyal followings by emphasizing clean labels, achieving distribution in Whole Foods, Sprouts, and Target, and attracting acquisition interest from multinational incumbents seeking to diversify portfolios
By Distribution Channel:
Online Retail Disrupts Traditional Shelf-Space EconomicsSupermarkets and hypermarkets accounted for 53.95% of the 2025 distribution share, driven by high foot traffic, strategic placement of impulse-purchase items, and promotional pricing strategies to boost volume. These channels leverage established relationships with multinational brands, slotting fees that benefit existing players, and private-label programs targeting price-sensitive consumers. Additionally, supermarkets and hypermarkets provide a wide range of product categories under one roof, offering convenience to consumers. The presence of loyalty programs and in-store experiences also contributes to retaining customers and increasing repeat purchases.
Online Retail Stores are surging at 11.34% CAGR from 2026 to 2031, the fastest growth rate among distribution channels, as e-commerce platforms, quick-commerce services, and direct-to-consumer brands bypass traditional retail gatekeepers. Amazon Fresh, Instacart, and Alibaba's Tmall integrate savory snacks into grocery delivery, enabling consumers to replenish pantry staples without visiting physical stores. Direct-to-consumer brands leverage social-media advertising, influencer partnerships, and performance marketing to acquire customers at lower cost. Quick-commerce platforms Blinkit in India, GrabMart in Southeast Asia, Getir in Europe deliver snacks within 10 to 15 minutes, creating a new competitive front where speed and convenience trump price.
Geography Analysis
North America Savory Snacks Market
North America accounts for 38.74% of global revenue, driven by Frito-Lay’s direct-store-delivery system and a strong snacking culture spanning school lunches to late-night activities. The United States leads in absolute sales, benefiting from a wide variety of snack options and extensive retail distribution networks. Canada exhibits faster growth in baked and reduced-sodium snack lines due to increasing health awareness and stricter labeling regulations, which encourage consumers to opt for healthier alternatives. In Mexico, the market leans toward spicy flavors and small-format packs priced under USD 1.00, emphasizing affordability and accessibility. Local corn-based snacks incorporate indigenous spice blends, enhancing their appeal and catering to traditional taste preferences.
APAC Savory Snacks Market
Asia-Pacific is the fastest-growing region, with a CAGR of 7.83%, fueled by urbanization, increasing disposable incomes, and localized flavor innovations in countries like China, India, and Indonesia. The rapid expansion of urban centers has led to a growing demand for convenient and affordable snack options, while rising disposable incomes have enabled consumers to explore premium and innovative products. Regional players like Balaji in Gujarat and Calbee in Japan focus on region-specific SKUs, which multinational companies replicate using AI-driven flavor mapping to cater to local tastes. Additionally, the region’s cultural diversity fosters experimentation with unique flavors, such as spicy, tangy, and sweet combinations, which resonate with local consumers and drive market growth.
Europe Savory Snacks Market
Europe demonstrates strong value growth despite moderate volume increases, supported by premiumization and stringent food safety standards that encourage research and development investments. Germany and the United Kingdom lead in per-capita consumption, driven by a preference for high-quality and innovative snack products. Regulations such as the EU Deforestation Regulation and sodium limits create opportunities for compliance-based differentiation, compelling manufacturers to develop healthier and more sustainable offerings. Meanwhile, Eastern Europe is expanding modern trade channels, accommodating both global and domestic competitors and increasing the availability of diverse snack options. The region’s emphasis on sustainability, health-consciousness, and premiumization continues to shape consumer preferences and drive market growth.

Regulatory Landscape
Savory snacks manufacturers face tightening food-safety, nutrition, and labeling requirements across major markets, with compliance increasingly driven by formal targets and documented traceability. In the United States, the Food and Drug Administration (FDA) has advanced voluntary sodium-reduction targets across 163 food categories, reinforcing reformulation pressure for chips and crisps as Phase II guidance moves toward 2026 category limits referenced in market practice. The FDA also finalized the FSMA rule on additional traceability records for certain foods, which supports broader adoption of interoperable lot-level documentation and strengthens recall readiness across ingredient and finished-goods flows.
In Europe, the general food information framework (including Regulation (EU) No 1169/2011) supports mandatory labeling practices, while food-safety criteria continue to tighten, including new Listeria monocytogenes criteria in foodstuffs applicable from July 1, 2026 via amendments to Regulation (EC) No 2073/2005. In Asia, country-specific food-safety reforms introduce additional compliance variability for global brands and exporters; Vietnam issued Decree No. 46/2026/ND-CP (January 26, 2026) to elaborate measures for the Law on Food Safety, and an amended Food Safety Law is scheduled for submission to the National Assembly in October 2026. These changes raise the value of standardized quality systems, shelf-life validation, and region-ready label architectures for multinational snack portfolios.
Competitive Landscape
The Global Savory Snacks Market exhibits moderate fragmentation, indicating that multinational incumbents coexist with regional specialists and emerging disruptors. PepsiCo, Mars (Kellanova), and Mondelez collectively command major share of the global revenue, leveraging scale advantages in procurement, manufacturing, and distribution that smaller players cannot replicate. Mars' USD 36 billion acquisition of Kellanova in 2024 signals consolidation pressure, as the combined entity gains negotiating leverage with retailers, cross-selling opportunities across chocolate and snack portfolios, and cost synergies in supply-chain operations.
White-space opportunities are emerging in free-form categories, direct-to-consumer channels, and functional snacks that blur the line between indulgence and nutrition. Brands such as Siete, Lesser Evil, and Hippeas have built USD 100 million to USD 300 million businesses by targeting health-conscious consumers through Whole Foods, Amazon, and subscription boxes, prompting PepsiCo to acquire Siete for USD 1.2 billion to capture this demographic . Technology is reshaping competitive dynamics: AI-driven flavor development reduces time-to-market, digital twins optimize production efficiency, and blockchain-enabled traceability systems satisfy ESG compliance requirements that favor established players with regulatory expertise.
Smaller entrants are leveraging social-media marketing and influencer partnerships to acquire customers at lower cost than traditional trade promotions, bypassing incumbent distribution advantages. Competitive intensity is rising as protein bars, meal-replacement shakes, and ready-to-drink beverages encroach on traditional snacking occasions, forcing savory-snack manufacturers to fortify portfolios with functional claims protein, fiber, probioticsthat appeal to health-conscious consumers.Leading companies are also prioritizing sustainability to meet retailer and consumer expectations. Efforts include investing in eco-friendly packaging materials like bio-based films and lightweight corrugated boxes, which help reduce transportation emissions and align with corporate net-zero goals.
Savory Snacks Industry Leaders
-
PepsiCo Inc.
-
Mondelez International, Inc.
-
Mars Inc.
-
The Campbell's Company
-
Intersnack Group
- *Disclaimer: Major Players sorted in no particular order
Savory Snacks Market Companies Covered in this Report
- PepsiCo Inc.
- Mars Inc.
- Mondelez International Inc.
- General Mills Inc.
- Conagra Brands Inc.
- Calbee Inc.
- ITC Limited
- Utz Brands Inc.
- Intersnack Group
- The Campbell's Company
- The Hershey Company
- Blue Diamond Growers
- Arca Continental SAB de CV
- Grupo Bimbo SAB de CV
- Nestlé SA
- Hain Celestial Group
- Balaji Wafers Pvt Ltd
- Herr Foods Inc.
- Link Snacks Inc.
- Amplify Snack Brands
- Orkla ASA

Market Opportunities and Future Outlook
Better-for-you engineering is creating product and margin whitespace beyond label-only reformulation, particularly where sodium and fat reduction needs to align with taste expectations. Processing and line-integration upgrades are being commercialized to preserve crunch and flavor while lowering oil pickup, including vacuum-driven de-oiling showcased by TNA Solutions at interpack 2026 and integrated potato chip processing lines introduced by PPM Technologies and Key Technology at SNACKEX 2026. Work on fermentation-derived ingredients (for example, yeast extracts) also supports more layered flavor profiles while helping manufacturers reduce sodium and maintain clean-label ingredient decks.
Capacity localization and supply-chain risk reduction are additional visible opportunities as manufacturers add domestic hubs and diversify manufacturing footprints to manage crop volatility and logistics costs. In the United States, Shearer’s Foods opened a 390,000-square-foot production facility in Moraine, Ohio after a USD 110 million investment (June 2026), while CRISP POWER opened a USD 15 million facility in Stafford, Texas to move away from an import-reliant model toward domestic manufacturing (June 2026). In Asia-Pacific, PepsiCo committed USD 665 million in India through 2030 to expand food manufacturing capacity across Madhya Pradesh, Assam, and Tamil Nadu, reinforcing the operational advantage of localized plants for fast-growing urban demand and quick-commerce replenishment patterns.
Recent Industry Developments in Savory Snacks Market
- July 2026: Mondelēz International entered discussions regarding a potential acquisition of Snackworks, a South African snacks business owned by AVI Ltd. The talks point to renewed M&A optionality in emerging snack markets, where established local distribution can help accelerate portfolio scale. If progressed, the plan would add competitive pressure on incumbents and regional players across Southern Africa.
- February 2026: Takis (Grupo Bimbo) launched six new flavors in the United States under the campaign "All Intense, Not All Spicy," expanding the brand beyond its core spicy positioning. By offering options across a wider heat spectrum, the launch broadened addressable occasions and helped protect shelf space against incumbent flavored chip and tortilla competitors. The rollout also underscored how flavor-led innovation cycles support premium pricing in mainstream retail.
- August 2024: Mars announced an agreement to acquire Kellanova, bringing brands such as Pringles and Cheez-It into Mars' snacking-led portfolio upon closing. The deal signaled consolidation at scale, with the combined entity positioned to strengthen retailer negotiations and bundle promotions across multiple snack categories. The transaction also intensified competitive dynamics for global savory snack leaders across procurement, distribution, and brand investment.


Savory Snacks Market Report Scope and Research Methodology
Market Definition and Coverage
For this study, the savory snacks market covers packaged, ready-to-eat snack foods that are mostly salty, spicy, or savory, and are consumed between meals across retail and online channels.
Scope exclusions: We exclude sweet snacks and dessert-type items, and we also exclude freshly prepared foodservice snacks that are not sold as packaged products.
Segments Covered in This Report
-
By Product Type
-
Chips and Crisp-Based Snacks
- Potato Chips
- Tortilla and Corn Chips
- Rice and Pulse-Based Chips
- Multigrain Chips
- Cheese and Dairy-Based Chips
- Seaweed and Marine-Based Crisps
- Nuts, Seeds and Trail Mixes
- Pretzels
- Popcorn Snacks
- Meat and Jerky Snacks
- Extruded and Puffed Snacks
- Other Product Types
-
Chips and Crisp-Based Snacks
-
By Flavor Profile
- Classic Salted/ Plain
- Flavored
-
By Category
- Conventional
- Free-Form
-
By Distribution Channel
- Supermarkets/Hypermarkets
- Convenience/Grocery Stores
- Online Retail Stores
- Other Distribution Channels
-
By Geography
-
North America
- United States
- Canada
- Mexico
- Rest of North America
-
Europe
- Germany
- United Kingdom
- France
- Italy
- Spain
- Netherlands
- Poland
- Belgium
- Sweden
- Russia
- Rest of Europe
-
Asia-Pacific
- China
- India
- Japan
- Australia
- New Zealand
- Indonesia
- South Korea
- Thailand
- Singapore
- Rest of Asia-Pacific
-
South America
- Brazil
- Argentina
- Colombia
- Chile
- Peru
- Rest of South America
-
Middle East and Africa
- Saudi Arabia
- United Arab Emirates
- Turkey
- South Africa
- Nigeria
- Egypt
- Morocco
- Rest of Middle East and Africa
-
North America
Data Sources, Market Sizing, and Validation
Desk Research
Desk work started by mapping what counts as savory snacks in public statistics, then aligning that with category definitions used by retailers and industry bodies. We referred to sources such as national statistics offices, customs and trade databases, the USDA and similar agriculture agencies, FAO food supply series, and public health and nutrition publications that track snacking frequency and category shifts.
To translate the category structure into value, we also used company annual reports, investor presentations, earnings call transcripts, and reputable press coverage to understand pricing moves, packaging sizes, and channel mix changes. In a few cases, paid subscriptions for company financials, news and financials, and patent databases were used to speed up data gathering and cross-check timelines. These examples are illustrative only, and there are many other public sources that were consulted to collect data, validate assumptions, and clarify open questions.
Primary Interviews and Surveys
Primary work was used to confirm what is included in the category, and to pressure-test assumptions like price progression, channel margins, and the pace of premiumization. We spoke with a mix of brand-side and channel-side experts, along with category managers and distributors, to capture demand signals by region and to close gaps that desk research does not fully explain.
Distribution of primary research fieldwork respondents
| Company type | Respondent position | Region |
|---|---|---|
| Top tier: 38% | CXOs: 14% | APAC: 48% |
| Mid tier: 40% | Functional/Unit leaders: 31% | EMEA: 29% |
| Smaller Players: 22% | Managers: 55% | Americas: 23% |
Market-Sizing & Forecasting
Sizing was built using a top-down and bottom-up approach, where packaged food spend, category splits, and snack penetration signals were used to reconstruct the savory-snack demand pool by region, followed by product and channel splits. To keep totals realistic, we corroborated results with selective bottom-up approximations using sampled price-per-pack ranges, indicative volumes by key formats (such as chips, nuts, popcorn, pretzels, and extruded snacks), and retailer and distributor channel checks.
Inputs that materially shaped the model included inflation-adjusted snack price movement, promotional intensity, shifts toward baked and better-for-you positioning, growth in online grocery availability, and regional snacking frequency trends. Where product-level value splits were not consistently available, we used proxy indicators (such as packaged food category shares and shelf-space cues), then re-balanced the model so regional totals remained consistent.
For forecasting, we used a scenario-led multivariate regression that links market value to macro indicators (income growth and food inflation) plus category signals (penetration and channel mix), and then adjusts the curve using expert feedback on expected pricing and premiumization. When short-term shocks were visible, smoothing was applied so the year-to-year path stayed plausible and explainable.
Data Validation & Update Cycle
Outputs were checked at multiple steps by comparing regional totals against independent signals like packaged food growth rates, trade movement where relevant, and public pricing trends. When a split looked inconsistent, the assumptions behind it were revisited, and follow-up outreach was triggered to confirm whether the change was real or model-driven.
Before sign-off, variance checks were run across regions, product groups, and channels so that no single assumption could over-pull the result. The report is refreshed annually, and interim updates are made when material events shift pricing, supply, or consumer demand. Before delivery, a final review pass is completed so clients receive the latest updated view.
Mordor Intelligence's Savory Snacks Market Size Compared With Other Published Estimates
Published savory snack numbers often vary, even when the topic name looks identical, because the included products, channels, and timing assumptions can change the total. Differences also show up when one estimate is built from consumption signals, while another relies more on broad packaged-food ratios.
In this market, the largest gaps usually come from whether meat snacks, nuts and trail mixes, and newer sub-categories (such as seaweed and multigrain crisps) are counted fully, and how retail versus foodservice is treated. Currency conversion timing, the speed at which average selling prices are assumed to rise, and how frequently inflation and channel mix inputs are refreshed can also push the market size apart, especially in high-inflation years.
Benchmark comparison
| Source | Market Size | Gaps in Research Methodology |
|---|---|---|
| Mordor Intelligence | USD 272.22 B (2026) | |
| Industry Data Provider A | USD 289.15 B (2025) | Uses a different base year and a broader slicing of the category, which can shift totals when baked versus fried and flavor groupings are treated as separate value pools, and when price progression is applied more uniformly across regions. |
| Global Publisher B | USD 320.90 B (2024) | Appears to apply a wider scope definition with less explicit treatment of retail versus foodservice, and the earlier base year can inflate the comparison if inflation and pack-size mix shifts are not normalized to the same timing. |
The spread is easiest to explain through scope and timing rather than math alone, since one set of numbers is anchored in 2026 while others start in 2024 to 2025. When meat snacks and trail mixes are included only as packaged retail items and price progression is refreshed using region-level inflation checks, the total stays closer to the true demand pool, a discipline applied by Mordor Intelligence.


Key Questions Answered in the Report
What CAGR is forecast for the global savory snacks market through 2031?
A 5.85% CAGR will lift value from USD 272.22 billion in 2026 to USD 361.64 billion by 2031.
Which product line is expanding fastest?
Nuts, seeds, and trail mixes are projected to grow at a 6.93% CAGR over 2026-2031.
How quickly is online retail advancing?
Online retail stores are set to rise at an 11.34% CAGR, the fastest of all channels.
Which region leads current revenue?
North America commands 38.74% of global sales, anchored by entrenched snacking habits.
Page last updated on:


 Your data is secure and never sold or shared.


