
Saudi Arabia Pizza Restaurants Market Size and Share
Market Overview
| Study Period | 2021 - 2031 |
|---|---|
| Forecast Data Period | 2026 - 2031 |
| Base Year Market Size (2025) | USD 2.15 Billion |
| Market Size (2026) | USD 2.33 Billion |
| Market Size (2031) | USD 3.47 Billion |
| Growth Rate (2026 - 2031) | 8.32 % |
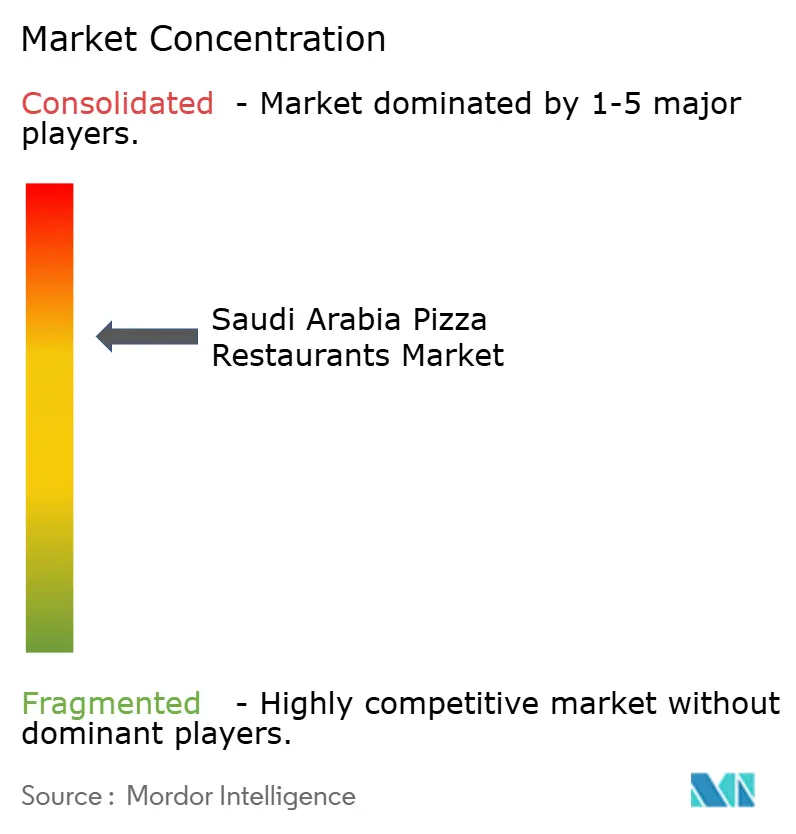
| Market Concentration | Medium |
Major Players *Disclaimer: Major Players sorted in no particular order Image © Mordor Intelligence. Reuse requires attribution under CC BY 4.0. | |
Saudi Arabia Pizza Restaurants Market Analysis by Mordor Intelligence
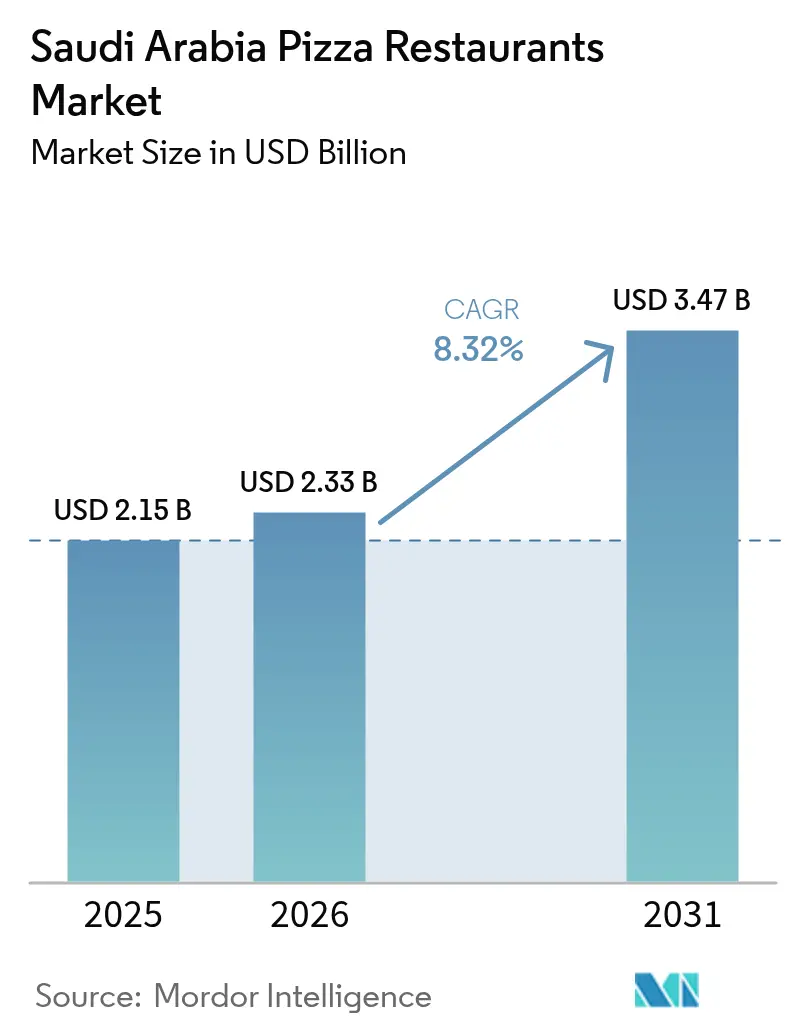
Saudi Arabia pizza restaurant market size in 2026 is estimated at USD 2.33 billion, growing from 2025 value of USD 2.15 billion with 2031 projections showing USD 3.47 billion, growing at 8.32% CAGR over 2026-2031. Strong household spending, the rollout of Vision 2030 hospitality projects, and steady tourism inflows underpin revenue expansion for chained and independent operators alike. Rapid urban population growth, supportive franchise regulation are broadening demand for casual dining formats that combine value pricing with convenience. Digital ordering, cloud-kitchen networks, and cashless payments are lowering market-entry barriers while letting smaller brands scale beyond their home cities. Menu premiumization, evidenced by the double-digit growth of gourmet and artisanal offerings, is widening average ticket values even as traditional pizza maintains volume leadership. Competitive intensity is rising as international franchisees add new stores, local entrepreneurs deploy asset-light delivery kitchens, and food-tech platforms funnel incremental traffic to both segments.
Key Report Takeaways
- By restaurant type, quick-service restaurants led with 62.15% revenue share in 2025; cafés and bars are forecast to post the fastest 8.78% CAGR through 2031.
- By outlet structure, chained outlets captured 61.74% of the Saudi Arabian pizza restaurant market share in 2025, while independent outlets are growing at 8.47% CAGR to 2031.
- By menu, traditional pizza accounted for 38.96% of the Saudi Arabia pizza restaurant market size in 2025, and gourmet pizza is advancing at an 8.41% CAGR through 2031.
- By geography, the Central region held 43.05% revenue share in 2025; the Western region is set to expand at 9.02% CAGR to 2031.
Note: Market size and forecast figures in this report are generated using Mordor Intelligence’s proprietary estimation framework, updated with the latest available data and insights as of 2026.
Saudi Arabia Pizza Restaurants Market Trends and Insights
Drivers Impact Analysis*
| Driver | (~) % Impact on CAGR Forecast | Geographic Relevance | Impact Timeline |
|---|---|---|---|
| Rising disposable income and Westernized eating-out culture | +2.1% | Nationwide with Central and Western clusters | Medium term (2-4 years) |
| Growing expatriate community | +1.8% | Riyadh, Jeddah, Dammam | Long term (≥4 years) |
| Digitalization and online ordering | +2.3% | Urban centers countrywide | Short term (≤2 years) |
| Rise in gourmet and artisanal pizzas | +1.5% | Central and Western corridors | Medium term (2-4 years) |
| Aggressive marketing and promotions | +1.2% | Riyadh, Jeddah, Dammam | Short term (≤2 years) |
| Surge in cloud-kitchen franchise formats | +1.1% | Urban centers countrywide | Medium term (2-4 years) |
| Source: Mordor Intelligence | |||
Rising disposable income and westernized eating-out culture
Saudi Arabia's Vision 2030 is transforming household spending patterns, particularly in the food service sector. With the Kingdom's GDP exceeding USD 1 trillion, a strong middle class has developed, driving higher discretionary spending. According to the Capital Market Authority, consumer expenditure in Saudi Arabia amounted to SAR 1,684.3 billion in 2024[1]. This behavioral change extends beyond demographics, reflecting a shift from traditional home dining to a preference for dining out. The introduction of family dining sections and the increasing acceptance of mixed-gender dining have expanded the market to include families and professional women, alongside young men. Cultural reforms under Vision 2030 have redefined dining out as a social activity rather than a necessity, boosting demand for pizza restaurants that provide casual and affordable dining options. This trend is especially evident in urban areas, where expatriate influences and local lifestyle aspirations have normalized Western dining habits.
Growing expatriate community
Saudi Arabia's expatriate population plays a dual role as a demand driver and cultural influencer for pizza consumption. In Saudi Arabia, the number of non-Saudi residents reached approximately 15.7 million in 2024, compared to 14.5 million in 2023, according to the General Authority of Statistics[2]. These diverse international communities, primarily located in major economic hubs, have integrated pizza into the local dining culture, making it a popular choice across cultural lines. Beyond consumption, expatriates shape local food preferences through workplace interactions and social connections. With higher disposable incomes and established dining-out habits, this demographic has created a premium market segment that supports gourmet pizza offerings and delivery services. Their presence in key economic areas, such as Riyadh's Diplomatic Quarter, Jeddah's business districts, and the Eastern Province's industrial zones, ensures consistent demand even during local economic fluctuations. As early adopters of digital ordering platforms and premium dining trends, expatriates act as market influencers, driving the adoption of innovative pizza restaurant concepts. This demographic stability provides pizza operators with predictable revenue streams and serves as a testing ground for menu innovations that can later be tailored to local markets.
Digitalization and online ordering
Saudi Arabia's food service sector is undergoing a digital transformation, fueling the growth of pizza restaurants by boosting accessibility and operational efficiency. According to the Saudi Internet Report 2024, released by the Communications, Space and Technology Commission (CST), internet penetration in Saudi Arabia stands at an impressive 99%[3]. This robust digital framework allows pizza restaurants to transcend traditional geographic boundaries. This is especially advantageous for smaller operators, enabling them to rival established chains by offering superior delivery experiences. Moreover, the fusion of cloud kitchen models with digital ordering platforms has not only slashed operational costs but also broadened market reach. The embrace of technology spans beyond mere ordering; it encompasses inventory management, customer relationship management, and predictive analytics, all aimed at refining menu offerings and pricing strategies. With a tech-savvy demographic, Saudi Arabia presents a fertile ground for digital-first pizza ventures that emphasize convenience and customization, moving away from conventional dine-in models. Innovations such as QR menus, contactless payments, real-time delivery tracking, and AI-driven chatbots are not just enhancing service efficiency but are also pivotal in boosting customer satisfaction and encouraging repeat orders.
Rise in gourmet and artisanal pizzas
The pizza market in Saudi Arabia is undergoing a premiumization trend, reflecting a shift in consumer preferences toward high-quality ingredients and unique dining experiences. This movement toward gourmet offerings is primarily driven by increased exposure to global culinary trends through travel, social media, and expatriate influence. Consequently, there is growing demand for artisanal pizza concepts that focus on ingredient quality rather than competing on price. This trend aligns with broader consumer preferences for fresh, locally-sourced ingredients. Gourmet pizza establishments are capitalizing on this shift, achieving higher profit margins and fostering customer loyalty. Their premium positioning not only mitigates price-based competition but also strengthens brand differentiation. This growth is particularly notable in affluent urban areas, where dining is seen as an experience rather than a basic necessity. Social media, especially among younger demographics, has amplified the demand for visually appealing, Instagram-worthy pizzas that command premium prices. Additionally, the artisanal pizza trend aligns with health-conscious consumption patterns, as premium concepts often highlight organic ingredients, traditional preparation methods, and customizable options, catering to dietary-conscious consumers seeking alternatives to mass-market offerings.
Restraints Impact Analysis*
| Restraint | (~) % Impact on CAGR Forecast | Geographic Relevance | Impact Timeline |
|---|---|---|---|
| High operational costs | -1.9% | Major city high-street zones | Short term (≤2 years) |
| Growing health-conscious consumer segment curbing calorie-dense meals | -1.2% | Largest metropolitan areas | Medium term (2-4 years) |
| Supply chain disruptions | -.1.1% | Nationwide | Short term (≤2 years) |
| Dependence on delivery infrastructure | -0.8% | Largest metropolitan areas | Medium term (2-4 years) |
| Source: Mordor Intelligence | |||
High operational costs
Increasing costs in labor, real estate, and supply chains are reducing profits and slowing growth for pizza restaurants, with smaller operators and new entrants being the most affected. The Nitaqat labor law in Saudi Arabia enforces local hiring quotas, which raises labor expenses as Saudi nationals typically earn higher wages than expatriates. Additionally, operators must invest in training to ensure operational efficiency. Real estate prices in prime locations have risen significantly due to Vision 2030's urban development initiatives. Regulatory compliance extends beyond labor and imports, requiring adherence to Saudi Food and Drug Authority standards for food safety, licensing, and operational practices. These regulations demand ongoing investments in training, equipment, and documentation systems. Independent operators, lacking the economies of scale that international franchises benefit from, face greater challenges, putting them at a disadvantage compared to established chains. In many markets, operational costs are rising faster than revenues, forcing operators to either accept reduced margins or increase prices, which could lead to a decline in customer traffic.
Growing health-conscious consumer segment curbing calorie-dense meals
Saudi consumers' growing health awareness is challenging traditional pizza concepts that depend on calorie-rich, processed ingredients. This heightened dietary awareness is especially evident among the youth and urban professionals, who often link pizza with unhealthy eating. This perception poses challenges for operators aiming to broaden their customer base. Social media amplifies this health-conscious trend. Research shows that while Saudi consumers often order unhealthy foods, like pizza, via social platforms, this creates a cognitive dissonance that could deter repeat purchases. Furthermore, with the government championing healthy eating and an enhanced quality of life, there's an increasing scrutiny on calorie-heavy foods. This scrutiny could pave the way for regulatory actions, such as mandatory nutritional labels or tighter marketing controls. In response to this health trend, pizza operators are overhauling their menus, sourcing different ingredients, and reshaping their marketing strategies. They aim to address consumer health concerns while preserving the flavors that encourage repeat visits. However, this shift demands hefty investments in research and development. For smaller operators, these investments can be particularly challenging, as they often struggle to create healthier options without straining their budgets or compromising operational efficiency.
*Our forecasts treat driver/restraint impacts as directional, not additive. The impact forecasts reflect baseline growth, mix effects, and variable interactions.
Segment Analysis
By Outlet Type: Entrepreneurial Independents Win Share from Large Chains
Chained outlets contributed 61.74% of 2025 revenue, underpinned by trusted logos, national advertising, and multistore supply efficiencies that secure favorable rental terms. This dominance delivers predictable royalty flows to master franchisees while assuring landlords of creditworthy tenants. Independent players, however, recorded the fastest 8.47% CAGR through 2031, leveraging artisanal positioning and hyper-local menu tweaks that resonate with district tastes. Innovative independents adopt micro-kitchen pods linked to delivery apps, achieving capital-light scale while sidestepping dining-room rent. As a result, the Saudi Arabian pizza restaurant market size for independents is rising steadily, signaling a gradual dilution of chain supremacy.
Chained brands counter by adding store-within-store kiosks inside hypermarkets, reducing build-out costs and enhancing last-mile coverage. They also integrate loyalty wallets that consolidate QSR brand portfolios under one interface, heightening customer stickiness. Meanwhile, independents form buying cooperatives for bulk procurement of cheese and flour, lowering unit input costs.

By Restaurant Type: QSR Heft Meets Café-Bar Momentum
Quick-service units held 62.15% value in 2025 as speed, drive-thru lanes, and price points align with commuter habits. The Saudi Arabia pizza restaurant market size within QSR therefore shapes overall channel averages and sets the promotional cadence calendar. Cafés and bars are scaling fastest at 8.78% CAGR (2026-2031), capitalizing on relaxed public-gathering rules that now permit music, outdoor seating, and late-night service. Their ambience lengthens dwell time and lifts beverage attachment rates which in turn elevate table checks.
Full-service venues pursue a hybrid design that merges counter ordering with table delivery to compress cycle time without sacrificing service aesthetics. Cloud-kitchen specialists benefit from the ride-hailing network to hit 25-minute average delivery windows, thereby capturing incremental share during peak traffic snarls. The competitive boundary between formats is blurring as operators experiment with dual branding; for instance, a QSR storefront by day pivots to a lounge-style setting at night with minimal fixture changes.
By Menu Type: Mass-Market Classics, Anchor, Premium, Upsell Pathways
In 2025, traditional pizza held a 38.96% market share, supported by family-sized value bundles and familiar flavors. The demand for traditional pizza is driven by both local taste preferences and strong familiarity with standard pizza formats, especially at major chain outlets. Meanwhile, gourmet pizza, with an 8.41% CAGR (2026-2031), reflects the readiness of upper-income consumers to invest in imported truffle oil and aged parmesan. Specialty recipes, such as seafood toppings popular along the Red Sea coast, not only expand dining occasions but also meet religious dietary requirements.
Although customizable pizzas hold a smaller share in Saudi Arabia's market, they represent a strategic opportunity. Digital menu configurators increase average revenue per order without adding complexity to kitchen operations. Operators use tiered topping pricing to encourage consumers to choose premium options, enhancing contribution margins even with a wider range of ingredient SKUs. This menu segmentation supports targeted marketing efforts: for instance, kids’ cheese personal pizzas at mall kiosks and thin-crust sourdough in upscale districts.
By Region: Central Revenue Engine Spurs Western Outperformance
Riyadh, located in the Central region, accounts for 43.05% turnover, driven by dense corporate payrolls, high weekday footfall, and an advanced logistics network supporting national commissaries. Mega-projects like Diriyah Gate are introducing mixed-use districts, creating new lunch corridors. In contrast, the Western zone, which includes Jeddah and Mecca, recorded the highest growth at 9.02% CAGR, supported by pilgrim traffic and the launch of Red Sea coastal resorts that extend visitor stays. By 2030, the pizza restaurant market along Saudi Arabia's Western seaboard is expected to close the gap with the Central region.
The Eastern province experiences strong demand due to a large expatriate population in petrochemical hubs. Although the Northern and Southern regions are still underdeveloped, they offer a first-mover advantage because of the limited availability of fast-casual dining options. Regional franchisors customize crust thickness and spice levels to align with local preferences, highlighting the role of geographic micro-segmentation in national network planning.
Geography Analysis
In Riyadh, mixed-use malls, business parks, and entertainment zones significantly contribute to the growth of premium segment sales. These areas witness three distinct peak trading waves daily, reflecting the city's vibrant metropolitan lifestyle and consumer behavior. The city's extensive four-lane highway network facilitates same-day replenishment from centralized dough production facilities. This efficient logistics system ensures consistent product availability while minimizing spoilage rates for chain businesses, thereby enhancing operational efficiency.
Jeddah, recognized as a commercial gateway and cultural hub, supports the growth of specialty outlets. These outlets are designed with rooftop seating that provides scenic sea views, making them highly attractive to tourists. This strategic design not only draws significant tourist foot traffic but also increases their visibility on social media platforms, strengthening their digital presence and customer engagement. In Mecca, the steady monthly arrival of pilgrims, aligned with the lunar calendar, ensures a reliable revenue stream for businesses. This regular influx of visitors helps stabilize revenue fluctuations that might otherwise peak during the summer holiday season, enabling businesses to maintain a more consistent and predictable financial performance throughout the year.
Dammam and Khobar, with their large expatriate labor populations, maintain a consistent weekday takeaway volume, supported by corporate meal-voucher programs. Northern border provinces benefit from cross-trade with Jordan, introducing local consumers to appealing Levantine fusion toppings. In the southern highland cities, the rise of agritourism signals opportunities for farm-to-table sourcing, potentially increasing the use of locally produced cheese and heritage wheat flour in dough formulations. Across all provinces, mandatory SFDA inspection checkpoints ensure safety compliance, providing travelers with confidence in the quality of unfamiliar local brands.
Regulatory Landscape
Saudi Arabia pizza restaurants must meet food-safety and hygiene requirements overseen by the Saudi Food and Drug Authority (SFDA), in addition to municipal licensing for restaurant premises. Compliance work typically covers sanitation controls, staff hygiene, temperature management, traceability, and periodic inspection activity. Enforcement can range from corrective measures to financial penalties and possible closure for serious non-compliance.
Menu transparency requirements have tightened, with SFDA-linked nutrition disclosure requirements effective July 1, 2025. These apply to physical menus, digital menus, and online delivery platforms. Operators also face structured import and clearance obligations for key inputs, including cheese, meats, and sauces, with SFDA product and establishment registration via the Ghad system and clearance workflows aligned to Fasah and Tbadl trade platforms. This increases the importance of compliant documentation and labeling practices across the ingredient pipeline.
Value Chain Analysis
The value chain begins with ingredient sourcing (flour, cheese, meats, vegetables, sauces) and packaging, using a mix of domestic production and imported inputs that pass through SFDA compliance steps and electronic registration processes (including Ghad for product registration and Fasah/Tbadl for clearance). Distributors and logistics providers then supply chilled and ambient goods into brand commissaries and restaurant back-of-house storage. Larger chained operators typically centralize dough preparation, portioning, and procurement to reduce unit costs and stabilize quality, while independents more often rely on local wholesalers and smaller cold-chain capabilities.
In the downstream stage, pizza restaurants convert inputs through standardized kitchen operations (dough prep, baking, and portioning) and monetize through dine-in, takeaway, and delivery. Order flow and customer acquisition are shaped by aggregators and in-house apps. Digital stack providers support menu management, payment, loyalty, and delivery routing, while SFDA hygiene, labeling, and registration requirements influence supplier selection and SKU rationalization. Expansion strategies span traditional outlets and cloud-kitchen formats, and franchising agreements (including Pizza Inn's 50-unit Saudi agreement signed in January 2024) link brand owners with local operators responsible for site development, staffing, and last-mile performance.
Competitive Landscape
The Saudi Arabian pizza restaurant market is moderately concentrated, with international franchise operators holding dominant positions due to their strong brand recognition, efficient operational systems, and substantial financial resources. However, local concepts are increasingly competing with these incumbents by focusing on innovation and cultural adaptation. Major players in the market include Domino’s Pizza Inc., Yum! Brands Inc., Daily Food Co., Papa John’s International Inc., and Little Caesar Enterprises Inc., among others.
Technology adoption has emerged as the primary competitive advantage. Leading operators utilize digital ordering platforms, cloud kitchen models, and data analytics to optimize operations and improve customer experiences. Lorenzo Pizza's rapid expansion to 115 locations, achieved through partnerships with Deliverect and ToYou, highlights how technology-driven operations can achieve growth rates comparable to established franchises without significant capital investments in physical infrastructure.
Cloud-kitchen conglomerates, supported by the Public Investment Fund, are exploring IPO exits, reflecting continued institutional interest in asset-light foodservice platforms. Recent changes to franchise regulations, including ten-year terms and simplified arbitration processes, have increased brand owners' confidence in royalty recovery. Meanwhile, rising compliance costs are discouraging smaller operators, thereby strengthening the bargaining power of mid-sized portfolios.
Saudi Arabia Pizza Restaurants Industry Leaders
-
Daily Food Co.
-
Yum! Brands Inc.
-
Domino’s Pizza Inc.
-
Papa John’s International Inc.
-
Little Caesar Enterprises Inc.
- *Disclaimer: Major Players sorted in no particular order
Market Opportunities and Future Outlook
Delivery-led growth and operational automation create room for operators that can run compliant digital menus across owned channels and third-party apps, while improving order accuracy and delivery timing. Broader fast food activity is also intensifying, with Ministry of Commerce data cited for 2024 showing 63,272 commercial registrations in the fast-food sector by September 2024, including large clusters in Riyadh and Makkah. This supports further network buildout and more targeted pizza catchment planning.
Opportunity clusters around asset-light scaling models (cloud kitchens, micro-kitchen pods, and store-within-store kiosks) alongside premiumization that lifts average ticket values through gourmet and specialty offerings. At the same time, cost pressure, reported as 10 to 20 percent operational cost increases over the two years leading up to mid-2025 in the fast-food sector, pushes operators toward centralized procurement, distributor partnerships, and menu engineering. These approaches help protect margins while meeting the SFDA-aligned nutritional disclosure and allergen transparency requirements introduced in 2025.
Recent Industry Developments
- July 2026: Maestro Pizza (Daily Food Co.) released a 2026 progress update outlining operational execution during the year. The communication highlighted continued focus on scaling capabilities and maintaining performance in a competitive, delivery-heavy QSR environment, reinforcing the importance of operational discipline for large domestic brands.
- December 2025: Daily Food Co. completed a major digital infrastructure migration from legacy multi-vendor databases to Huawei Cloud TaurusDB. The move strengthened transaction processing speed and stability, supporting higher order volumes and improving resilience for app-driven and delivery-centric demand.
- February 2024: Rave Restaurant Group (Pizza Inn) entered a franchise agreement with Blessings Basket Company to open 50 restaurants across Saudi Arabia. The deal expanded competitive intensity among chained players and added momentum to franchised growth models beyond the largest incumbent networks.
Research Methodology Framework and Report Scope
Market Definition and Coverage
For this study, the market covers revenue earned in Saudi Arabia from outlets that primarily sell pizza for on-premise dining, takeaway, or delivery, including chain-led and independent operators across the country.
Scope exclusions: We exclude retail and frozen pizza sold through grocery channels and do not count foodservice ingredients sales that are not sold as prepared meals to end customers.
Segmentation Overview
- By Outlet Type
- Chained Outlet
- Independent Outlet
- By Restaurant Type
- Cafes and Bars
- Cloud Kitchen
- Full-Service Restaurants
- Quick-Service Restaurants
- By Menu Type
- Traditional Pizza (classic toppings and crusts)
- Gourmet Pizza (premium ingredients, artisanal toppings)
- Specialty Pizza (unique flavors, regional styles)
- Customizable Pizza
- By Geography
- Central (Kingdom Capital Region)
- Western (Mecca and Jeddah)
- Eastern (Dammam and Khobar)
- Northern Region
- Southern Region
Data Sources, Market Sizing, and Validation
Desk Research
Desk research helped us anchor the market to the real operating footprint of pizza-led restaurants in Saudi Arabia, and it also provided practical ranges for pricing, outlet formats, and consumption patterns. We reviewed public statistics and policy context, including Saudi General Authority for Statistics releases, Saudi Central Bank indicators tied to household spending, and Ministry of Commerce updates on business registrations, which are useful signals for outlet-count direction and formalization.
To tighten assumptions, we also used materials from trade and hospitality bodies and public market communication, such as Saudi tourism and entertainment updates, chamber and association websites, and credible news coverage on delivery and dining-out behavior. Where financial disclosure was available, company filings, investor presentations, and audited statements were used to sanity-check revenue per outlet patterns. Paid database subscriptions were used for company financials and intelligence, news and financials, and selective tenders and contracts signals where relevant. These sources are illustrative, and we also used many other references to compile data, validate inputs, and clarify open questions.
Primary Interviews and Surveys
Primary work focused on validating what actually drives pizza restaurant revenue in Saudi Arabia, and where desk sources were silent, we filled gaps through expert conversations. We spoke with operators, franchise and multi-unit managers, supply and procurement contacts, and delivery-focused teams, then cross-checked themes across Central, Western, Eastern, Northern, and Southern Saudi Arabia so the model does not lean on one city pattern.
Distribution of primary research fieldwork respondents
| Company type | Respondent position |
|---|---|
| Top tier: 27% | CXOs: 21% |
| Mid tier: 51% | Functional/Unit leaders: 24% |
| Smaller Players: 22% | Managers: 55% |
Market-Sizing & Forecasting
Market sizing was built using a top-down demand pool reconstruction, where we start from foodservice spending and eating-out intensity, then narrow it to pizza-led outlets using format mix and regional consumption signals. The totals were subsequently corroborated with selective bottom-up checks, including sampled outlet counts by format, typical weekly order throughput, and average ticket size ranges, and then adjusted when interviews indicated that a city or format behaves differently.
A few inputs drive the Saudi Arabia pizza restaurant market most directly, including the split of quick-service versus full-service pizza occasions, the share of delivery and takeaway versus dine-in, the outlet mix between chained and independent players, the pace of store openings and closures, and average selling price movement linked to cheese and wheat cost pressure and discounting. Where independent outlet data is thin, we handle gaps using conservative revenue bands by format and region, and we only scale after cross-checking with operator feedback and local on-ground signals.
For forecasting, we used scenario analysis supported by trend lines in eating-out frequency, delivery penetration, and tourism and entertainment activity, along with expected pricing changes. The final trajectory was aligned to what industry respondents viewed as realistic expansion over the next few years.
Data Validation & Update Cycle
Validation is done through repeated cross-checks between model outputs and independent signals, so one strong assumption does not dominate the result. We compare implied revenue per outlet with what operators say is achievable, review regional splits against population and visitation patterns, and investigate outliers before sign-off.
Before publishing, the work goes through multi-step analyst reviews, and follow-up calls are triggered when interview feedback conflicts with the model or when recent news suggests a meaningful shift in delivery economics or outlet expansion. Reports are refreshed annually, with interim updates when material events occur, and a final pre-delivery pass is completed so clients receive the latest updated view.
Mordor Intelligence's Saudi Arabia Pizza Restaurants Market Size Versus Other Published Estimates
Different published numbers for this market can look confusing at first, but they usually differ for straightforward reasons: what is counted as a pizza restaurant, the base year used, and how delivery-heavy sales are treated.
The main gap comes from mixing total pizza consumption with pizza-led restaurant revenue, and in the Mordor Intelligence approach, sales are counted only when the outlet's primary business is prepared pizza sold to end customers across chain and independent formats in Saudi Arabia.
Benchmark comparison
| Source | Market Size | Gaps in Research Methodology |
|---|---|---|
| Mordor Intelligence | USD 2.33 B (2026) | |
| Trade Release A | USD 1.90 B (2024) | Uses an earlier base year and often reflects a different inflation and pricing path, and the method disclosed in the release is light on outlet-mix and delivery ticket checks, which can understate current run-rate revenue. |
| Industry Newspaper B | USD 1.12 B (2024) | Derives pizza value as a percentage of a broader fast-food total and does not clearly separate pizza-led restaurant sales from adjacent categories or non-restaurant spending, which can shift the estimate depending on the share assumption used. |
The table shows that the spread is mainly explained by base-year choice and how tightly pizza-led restaurant sales are separated from broader fast-food or pizza consumption spending. By keeping inputs traceable to outlet formats, order channels, and price and throughput ranges, the final value can be replicated and checked in a straightforward way.
Key Questions Answered in the Report
What is the current value of the Saudi Arabia pizza restaurant market?
The sector generated USD 2.33 billion in revenue during 2026 and is on track to reach USD 3.47 billion by 2031.
How fast is the market expected to grow?
Revenue is projected to rise at an 8.32% CAGR through 2031, driven by tourism, digital ordering, and rising household incomes.
Which restaurant format holds the largest sales share?
Quick-service restaurants accounted for 62.15% of 2025 turnover, reflecting consumer preference for speed and affordability.
Which geographic region is expanding the quickest?
The Western region covering Jeddah and Mecca is forecast to post a 9.02% CAGR due to tourism and resort investments.